1/4. Joe P. wrote, "Averages are meaningless for determining heat"
You mean "confusing" (to you), not "meaningless."
Set your non-Panasonic microwave oven to half-power. It alternates between full power and zero power with a 50% duty cycle. That heats your coffee just as fast as a half-power microwave oven.
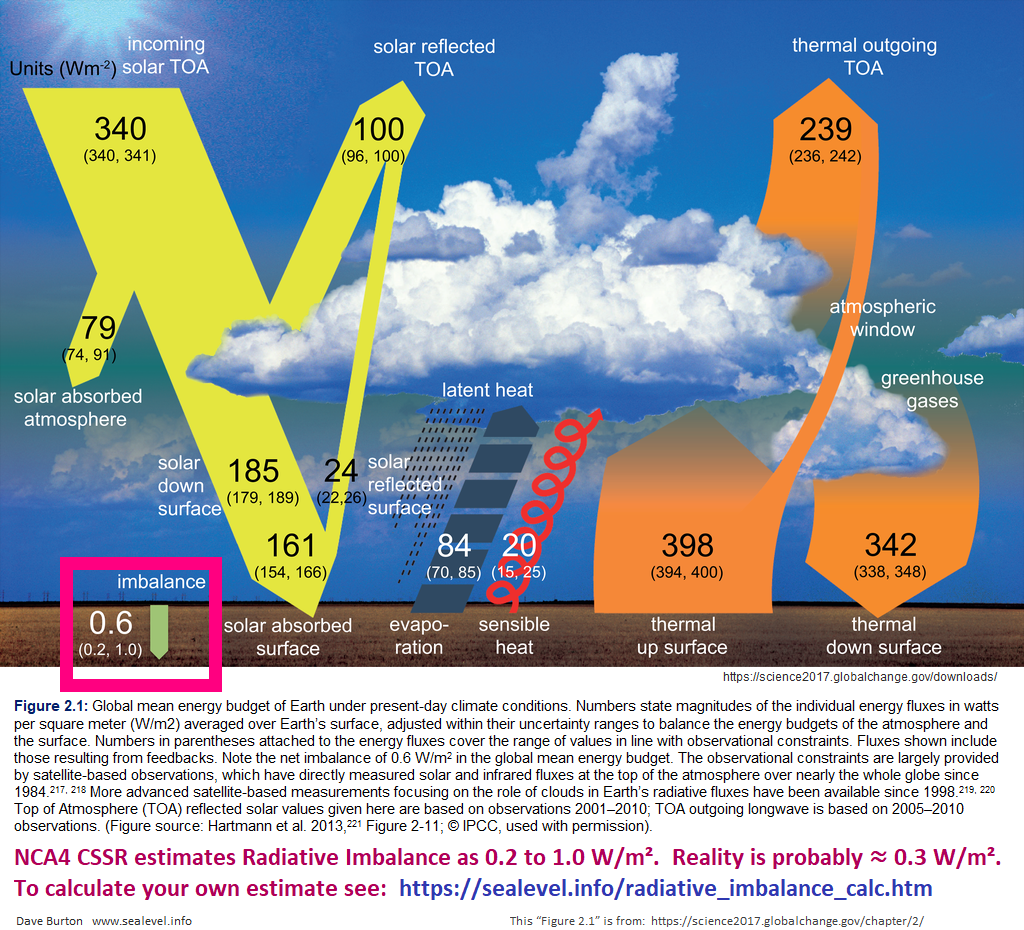
2/4. Joe P. wrote, "160w/m2 bb T is -40C, much too low"
You forgot to add roughly 342 W/m² of downwelling LW IR which originates from GHGs in the atmosphere: sealevel.info/NCA4_global_en…
3/4. Joe P. wrote, "It's derived after reducing TSI / 4 unnecessarily"
It accounts for the fact that the average irradiance over a sphere is 1/4th of the peak irradiance at the point where the surface of the sphere is perpendicular to the light source. It is not "unnecessary."
4/4. Joe P. wrote, "It's used to offset the difference to the GHE"
I have no idea what that's supposed to mean.
Joe P. wrote, "A more realistic number would be around 600w/m2"
Did you overlook the word "solar?" Even if no sunlight were blocked in the atmosphere, average solar energy reaching the surface would be only 1361/4 = about 340 W/m², not 600.
1/7. This PBS piece is extremely misleading. Elevated CO2 greatly improves crop yields, and it mitigates drought impacts, by improving plants' water use efficiency (WUE) and drought resilience. See:
I asked ChatGPT to explain the mechanism by which agronomists have found that elevated CO2 improves crops' WUE and drought resilience. It did a good job:
꧁꧂
In agronomy, the effects of elevated CO2 on plant water use efficiency and drought resilience are extensively studied. One of the key mechanisms through which elevated CO2 levels improve water use efficiency is by reducing stomatal conductance and, consequently, water loss through transpiration.
Stomata are small pores on the surface of plant leaves that regulate gas exchange, including the uptake of CO2 for photosynthesis and the release of water vapor through transpiration. When CO2 levels are elevated, plants can maintain the same or higher rate of photosynthesis while reducing stomatal conductance. This reduction in stomatal conductance leads to a decrease in water loss through transpiration without significantly affecting CO2 uptake, resulting in improved water use efficiency.
Several studies have quantified the effect of elevated CO2 on stomatal conductance and transpiration. For example, a meta-analysis published in 2013 (Kimball et al., 2013) found that under elevated CO2 levels, stomatal conductance decreased by an average of 22%, while transpiration decreased by only 17%. This indicates that plants under elevated CO2 levels were able to reduce water loss more efficiently than they reduced CO2 uptake, leading to an overall improvement in water use efficiency.
Improvements in water use efficiency due to elevated CO2 levels can increase plants' drought resilience by allowing them to maintain adequate hydration during periods of water scarcity. This can be particularly beneficial in arid and semi-arid regions where water availability is limited.
Overall, the literature suggests that elevated CO2 levels can improve water use efficiency in plants by reducing stomatal conductance and water loss through transpiration, which can enhance their resilience to drought conditions.masterresource.org/carbon-dioxide…
2/7. Contrary to climate industry propaganda and misinformation from the leftists at PBS, the scientific evidence is compelling that CO2 emissions and rising CO2 levels are beneficial. Here are some relevant papers: sealevel.info/negative_socia…
3/7. The beneficial effects of elevated CO2 are helping make famines rare for first time in human history. If you're too young to understand how important that is, count yourself blessed! Famine used to be a scourge comparable to war & disease.
1️⃣/4️⃣. That graph shows an estimate of a total of about 500 ZJ added to the the upper 2 km of the oceans since 1955.
Aside: Actually, the first 50 years of the graph are nothing but guesses.
OHC is estimated by models, informed by temperature measurements, made by Argo floats. The first Argo float was deployed in 2000. They didn't reach 3000 units (i.e., one float per 120,000 km²) until 2007.
So the part of their graph prior to about 2005 is 100% codswallop. The kindest thing you can say about it is that it's a plausible guess, consistent with (but you can't say based upon!) convenience samples of sea surface temperatures. It is not data, in any sense.
But never mind that, because that graph also has another problem...
2️⃣/4️⃣. Does it seem odd to you that, even though all the measurements are of temperature, rather than heat content, THEY NEVER REPORT TEMPERATURES?
You should calculate what 500 ZJ means in terms normal people can grok: average water temperature change. If you do that simple exercise, it will be obvious why they do not report it.
3️⃣/4️⃣. I know you won't do it, so I'll do it for you. (You're welcome.)
Total volume of water in the oceans is 1,338,000,000 cubic-km = 1.338e9 km³.
Volume of water in the upper 2000 meters of the oceans: 3.6e8 km² × 0.95 × 2.0 km = 6.84e8 km³ = ≈50% of total ocean volume.
The density of seawater is about 1027 kg/m³ = 1.027 tonne/m³ = 1.027 Gt/km³.
1 Gt = 1e12 kg, so the top 2 km of the world's seawater masses:
7.0e8 Gt × (1e12 kg/Gt) = 7.0e20 kg
So, let's calculate how much energy it takes to warm that much water by 1°C.
Everyone knows 1 cal of energy will raise one gram of fresh water by 1°C, and 1 kcal (1000 cal) warms 1 kg of water by 1°C. 1 cal = 4.184 J, so 4.184e3 J warms 1 kg of pure, fresh water 1°C.
Seawater has an 8% lower specific heat of 3.850e3 J / (kg °C). So:
It takes 7.0e20 kg × 3.850e3 J/kg = 2.695e24 Joules to raise the average temperature of the top 2 km of the oceans by 1°C.
So 500 ZJ (= 5.0e23 J) warms the top 2 km of seawater by an average of (5e23 / 2.695e24) = 0.185 °C, or almost 1/5 of 1°C.
@NASAClimate 1/11. When someone talks about a sea-level measurement record starting in 1993 it means they're using low quality satellite altimetry data, and they're ignoring the much higher quality coastal measurements. It's political propaganda, not unbiased science. sealevel.info/satellite_alti…
2/11. If you use the (much higher quality) coastal measurement data, it becomes clear that there's nothing to worry about.
That's Honolulu, which has the best quality, well-sited, sea-level measurement record in the world. The "straightness" of the blue sea-level trend means that rising CO2 levels haven't had much effect on sea-level.sealevel.info/learnmore.html…
@NASAClimate 3/11. The "straightness" is called "linearity," and it's opposite is called "acceleration." If you don't know how to recognize "acceleration," "deceleration," or "linearity" in a graph, here's a little primer which should help: sealevel.info/acceleration_p…
1/9. @NASAClimate is not one of the divisions & departments of NASA that do science. It's the "JPL Earth Science Communications Team" in Pasadena, which is comprised of "communicators," not scientists.
NASAClimate is a frequent source of misinformation and outright political propaganda.sealevel.info/learnmore.html
@NASAClimate 2/9. Many other parts of NASA still employ real scientists, who do excellent work.
Here's a NASA video about some of that work.
CO2 emissions are very beneficial for natural ecosystems, and NASA satellites measure the resulting "greening" of the Earth.
@NASAClimate 3/9. Do you worry about the Antarctic Ice Sheet melting? This excellent NASA study should put your fears to rest.
Note: Antarctic temperatures average below −40°, so a few degrees of warming obviously cannot melt it. cambridge.org/core/journals/…
@Anymous84861064 @Veritatem2021 @joe51du @JohnWil12363553 @HalBeowa @TheDisproof @SpudNielsen @rln_nelson @GillesnFio @Anvndarnamn5 @MartinDn1001 @3GHtweets @MarcEHJones @tonyjsargeant @Willard1951 @ammocrypta @Rabs1958 @DenisDaly @AristotleMrs @S_D_Mannix @Camburnclimate @ozzorro1 @bomac_macbo @BenKoby1911 @Devonian1342 @GAJAJW @Jaisans @bulkbiker @Climatehope2 @Data79504085 @Mark_A_Lunn @Michael_D_Crow @Hji45519156 @waxliberty @priscian @SuperFoxyLoxy @ChrisBBacon3 @JaapTitulaer @wjack76995 @Rocky35418823 @NobaconEgbert @balls95652097 @BointonGiles @SeekerTheGreat1 @ubique60 @EthonRaptor @RMcgillss @PeterGleick @DeSmog 2/7. I've also already explained to you why the natural sinks which remove CO2 from the air will continue to accelerate as long as CO2 levels continue to rise.
3/7. Natural CO2 removal mechanisms, which already remove at least (5.4 Gt CO2 / 2.1294 Gt/ppmv) = 2.5 ppmv/year, accelerate by an additional 1 ppmv/year for every 40-50 ppmv increase in atmospheric CO2 concentration.
That's a very powerful "negative feedback" which limits the rise in CO2 concentration, and ensures that the temperature increase will remain modest and benign.