Putting All The ICT Pieces Together 🧪
Master PO3 & Frameworks
A Thread 🧵
Master PO3 & Frameworks
A Thread 🧵
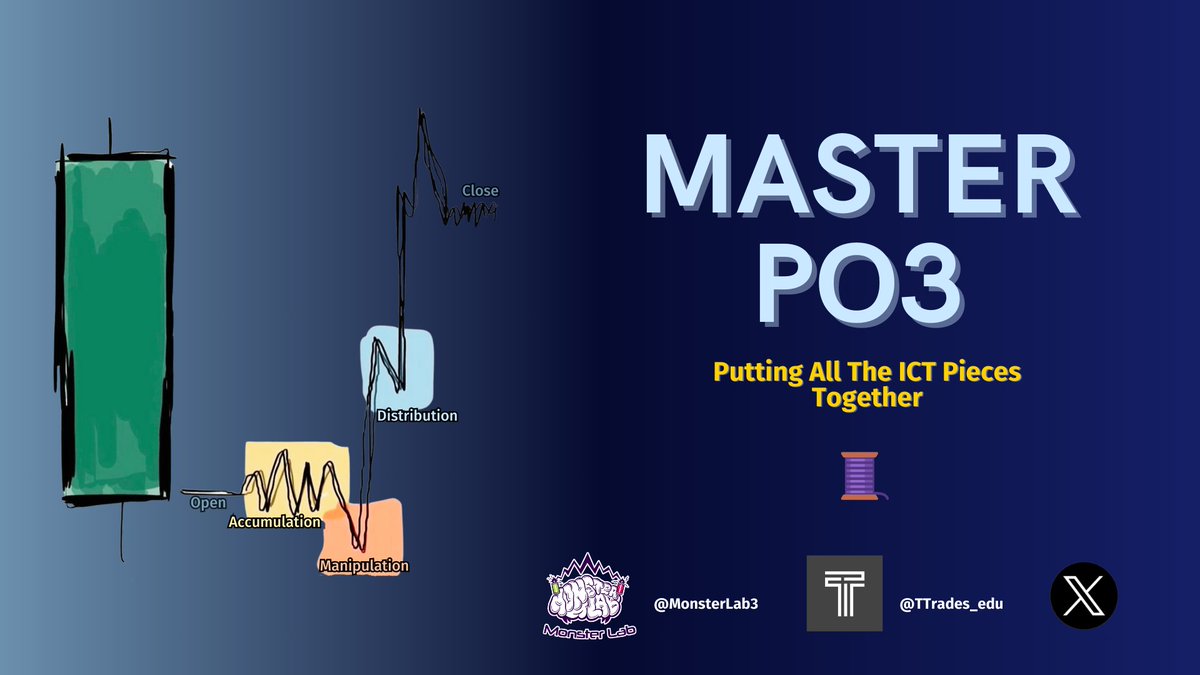
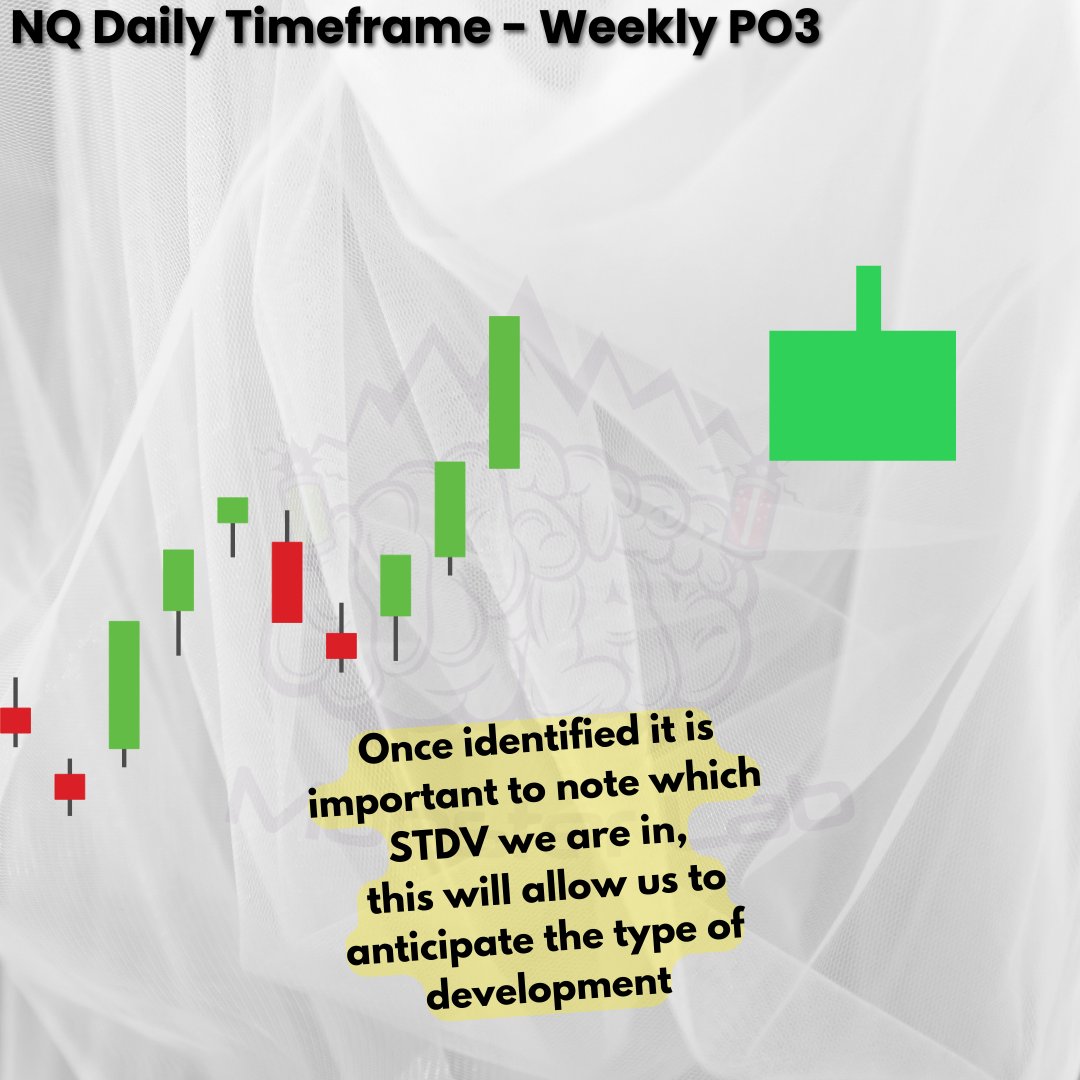
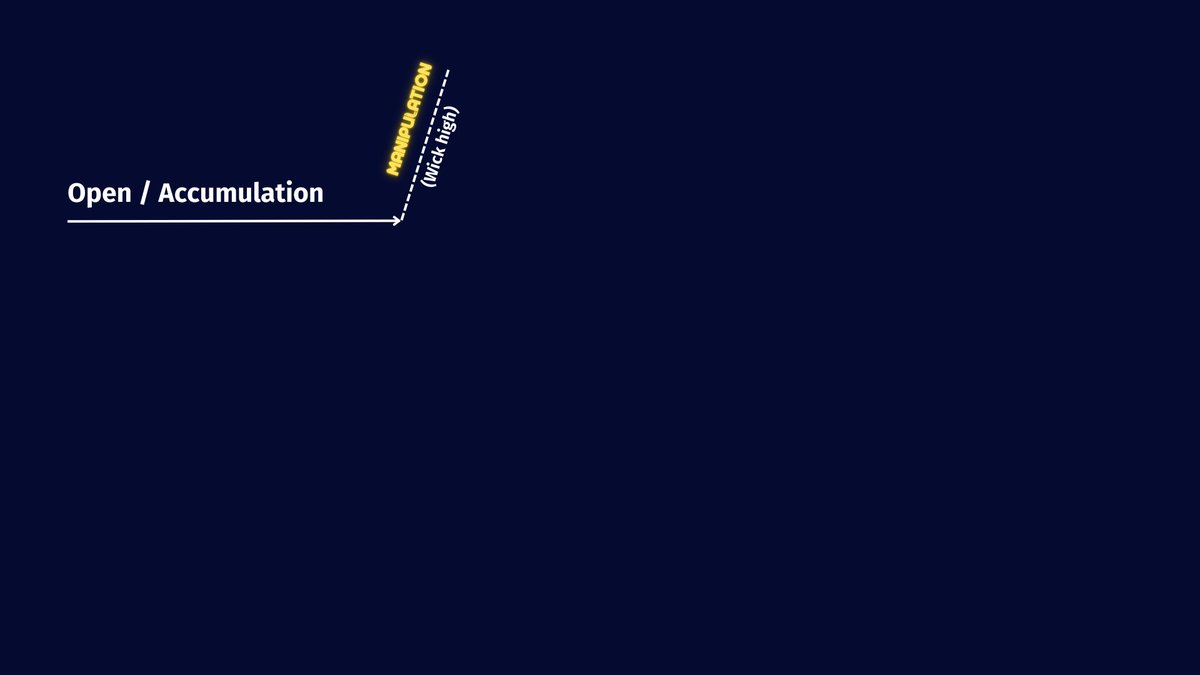
The Beginning: Opening / Accumulation
Each PO3 has an Opening and at the same time starts the Accumulation Phase.
The opening is the time, while the accumulation is the development of the Price.
This phase is when the market moves, gathering orders without a clear direction.
Each PO3 has an Opening and at the same time starts the Accumulation Phase.
The opening is the time, while the accumulation is the development of the Price.
This phase is when the market moves, gathering orders without a clear direction.

Now
What comes after the accumulation?
The Manipulation.
This phase serves to generate orders in the opposite direction since this movement or phase moves in the opposite direction of the Higher Time Frame.
In other words, it is the wick high for the candle in development.
What comes after the accumulation?
The Manipulation.
This phase serves to generate orders in the opposite direction since this movement or phase moves in the opposite direction of the Higher Time Frame.
In other words, it is the wick high for the candle in development.
Now
Last phase of PO3
The Distribution Phase
The distribution starts when the liquidity of the manipulation is generated these are: Sell Stops, are below the lows.
In other words, they are the stop losses of the orders that were entered in the movement of the manipulation.
Last phase of PO3
The Distribution Phase
The distribution starts when the liquidity of the manipulation is generated these are: Sell Stops, are below the lows.
In other words, they are the stop losses of the orders that were entered in the movement of the manipulation.

This applies also in the opposite direction: Buy Stops.
The distribution is for printing the candle body, for the candle in development, or the PO3 in development.
The distribution is for printing the candle body, for the candle in development, or the PO3 in development.
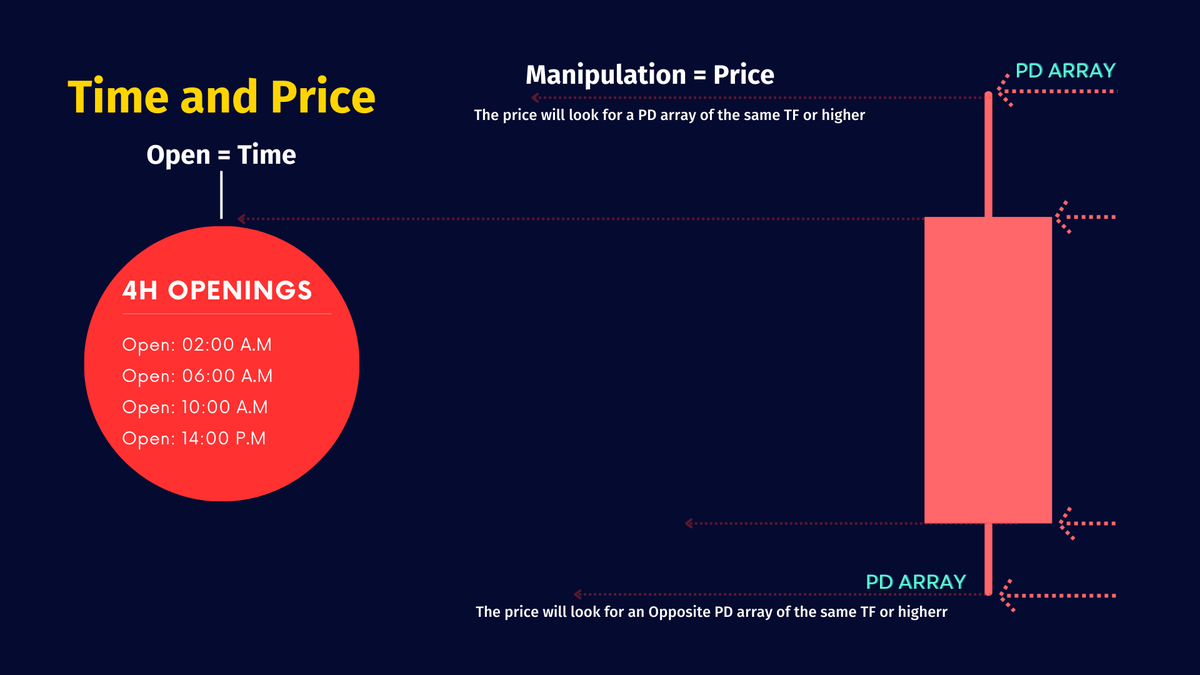
Power of Three: Time And Price
When price moves to the manipulation phase, price will be moving to a specific PD Array.
In other words, at a specific price
It can be a Daily FVG, Breaker...
When price moves to the manipulation phase, price will be moving to a specific PD Array.
In other words, at a specific price
It can be a Daily FVG, Breaker...
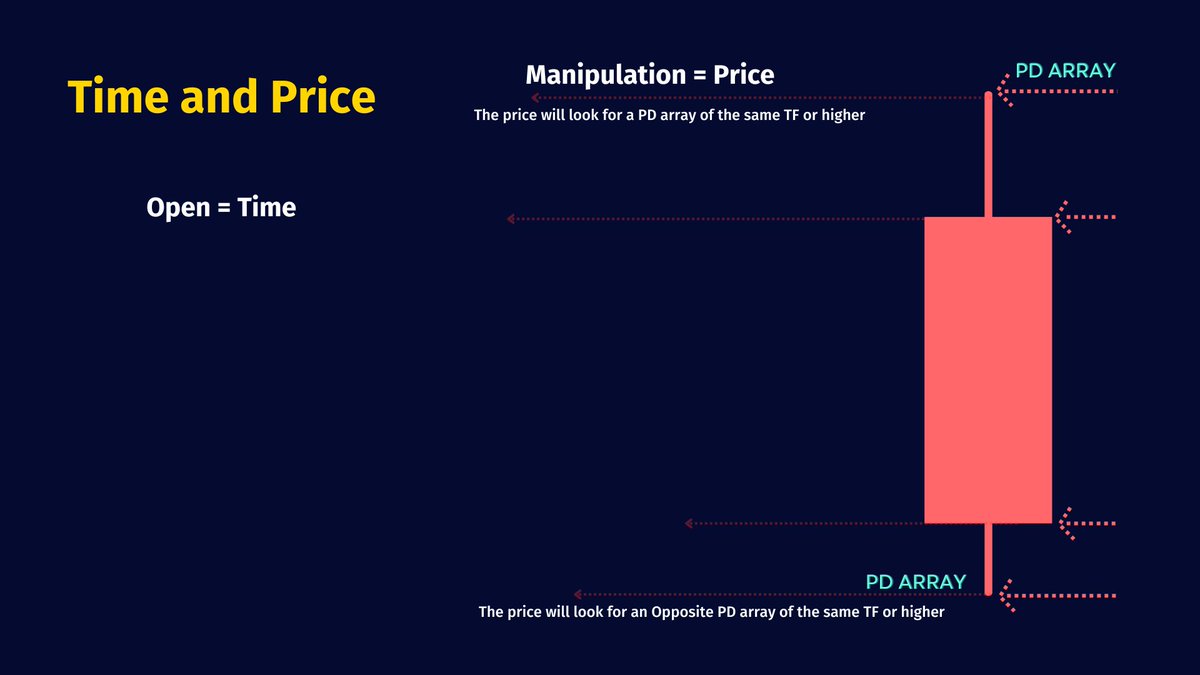
The same timeframe or a higher timeframe.
Never lower
Lower when you have the higher timeframe framework and need to re-find these PD Arrays.
But your main PD Array is for the same timeframe or HTF.
Never lower
Lower when you have the higher timeframe framework and need to re-find these PD Arrays.
But your main PD Array is for the same timeframe or HTF.
PO3 4H Openings: Index Futures & Forex (New York Time)
These concepts are for any timeframe.
But this time we will focus on the 4H Openings for intraday purposes
Within the daily candle, you can find multiple 4H candles
You only need one single candle to make money.
These concepts are for any timeframe.
But this time we will focus on the 4H Openings for intraday purposes
Within the daily candle, you can find multiple 4H candles
You only need one single candle to make money.

Inside the PO3 of the 4H candle
We can find the open, wick low, distribution, wick high and the close.
BUT inside this candle in LTF you can find the Internal Dynamics or the price movements.
You can find different types of movements.
Price does not move linear
We can find the open, wick low, distribution, wick high and the close.
BUT inside this candle in LTF you can find the Internal Dynamics or the price movements.
You can find different types of movements.
Price does not move linear

At the same time within these internal dynamics
We can find SMTs "Smart Money Tool" that confirm the wick low from the image above
So, we can go into more detail about this
But let's focus on the frameworks so you can work them into your charts.
We can find SMTs "Smart Money Tool" that confirm the wick low from the image above
So, we can go into more detail about this
But let's focus on the frameworks so you can work them into your charts.
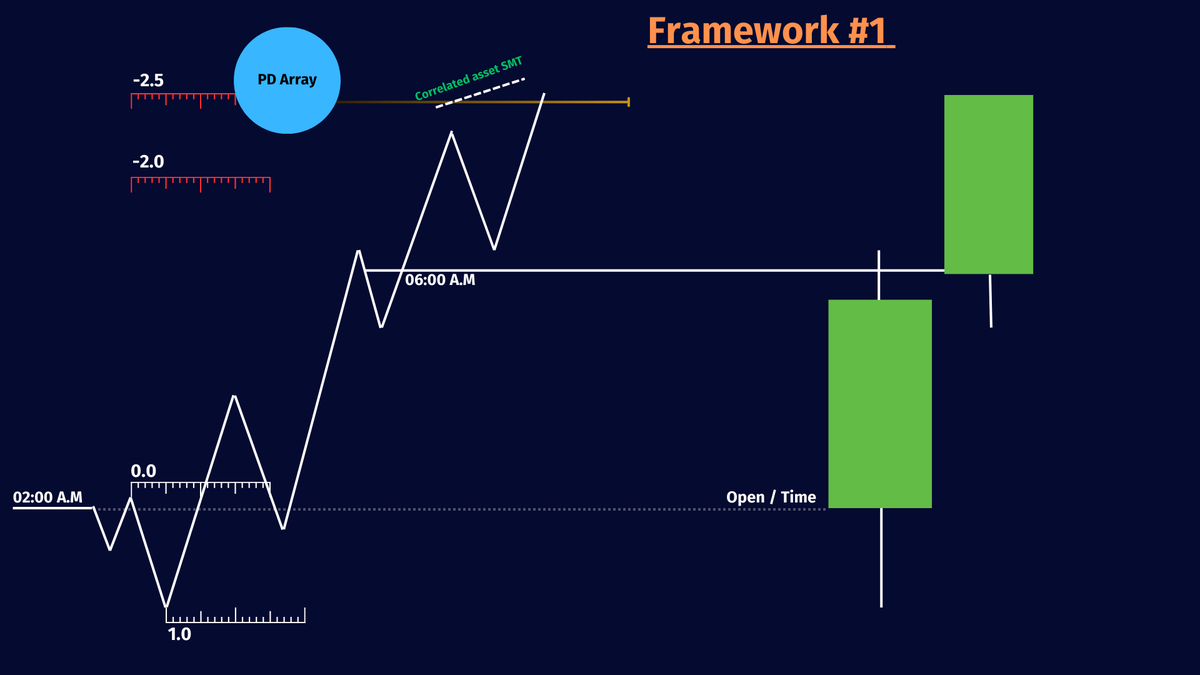
Framework #1
When you identify the opening and the manipulation stage
You can measure the manipulation leg with the STDVs.
In the 2.0 and 2.5 Deviations you can find the last movements and you can find the zone for a retracement or reversal.
When you identify the opening and the manipulation stage
You can measure the manipulation leg with the STDVs.
In the 2.0 and 2.5 Deviations you can find the last movements and you can find the zone for a retracement or reversal.
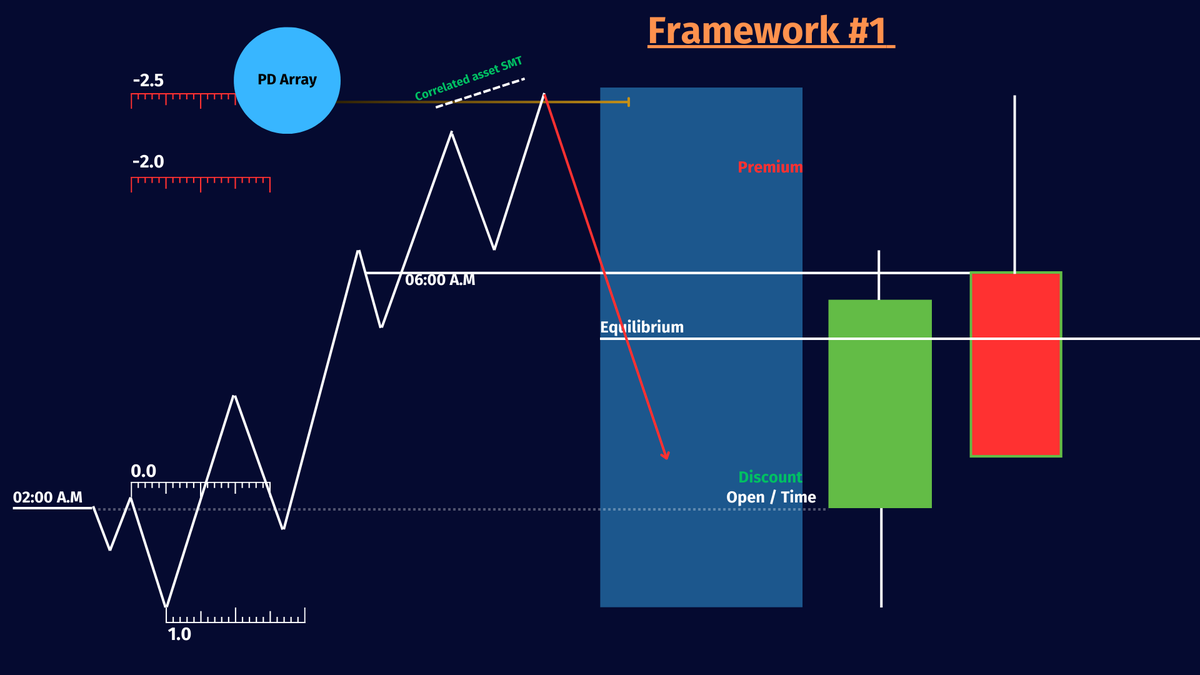
Once 2.0, 2.5 STDV has been reached.
We identify the Current Range Equilibrium and anticipate a move below the Equilibrium to Discount.
We identify the Current Range Equilibrium and anticipate a move below the Equilibrium to Discount.

End of this thread.
We could go into more detail, but the thread would be too long.
This thread was made from a collaborative video by Dexter with TTrades.
You will find framework #2 and all these concepts more detailed inside the video.
We could go into more detail, but the thread would be too long.
This thread was made from a collaborative video by Dexter with TTrades.
You will find framework #2 and all these concepts more detailed inside the video.
• • •
Missing some Tweet in this thread? You can try to
force a refresh