Arjo Profile picture
Jul 21 10 tweets 3 min read Read on X
MMC Episode 1: PD Arrays

A Thread 🧵 Image
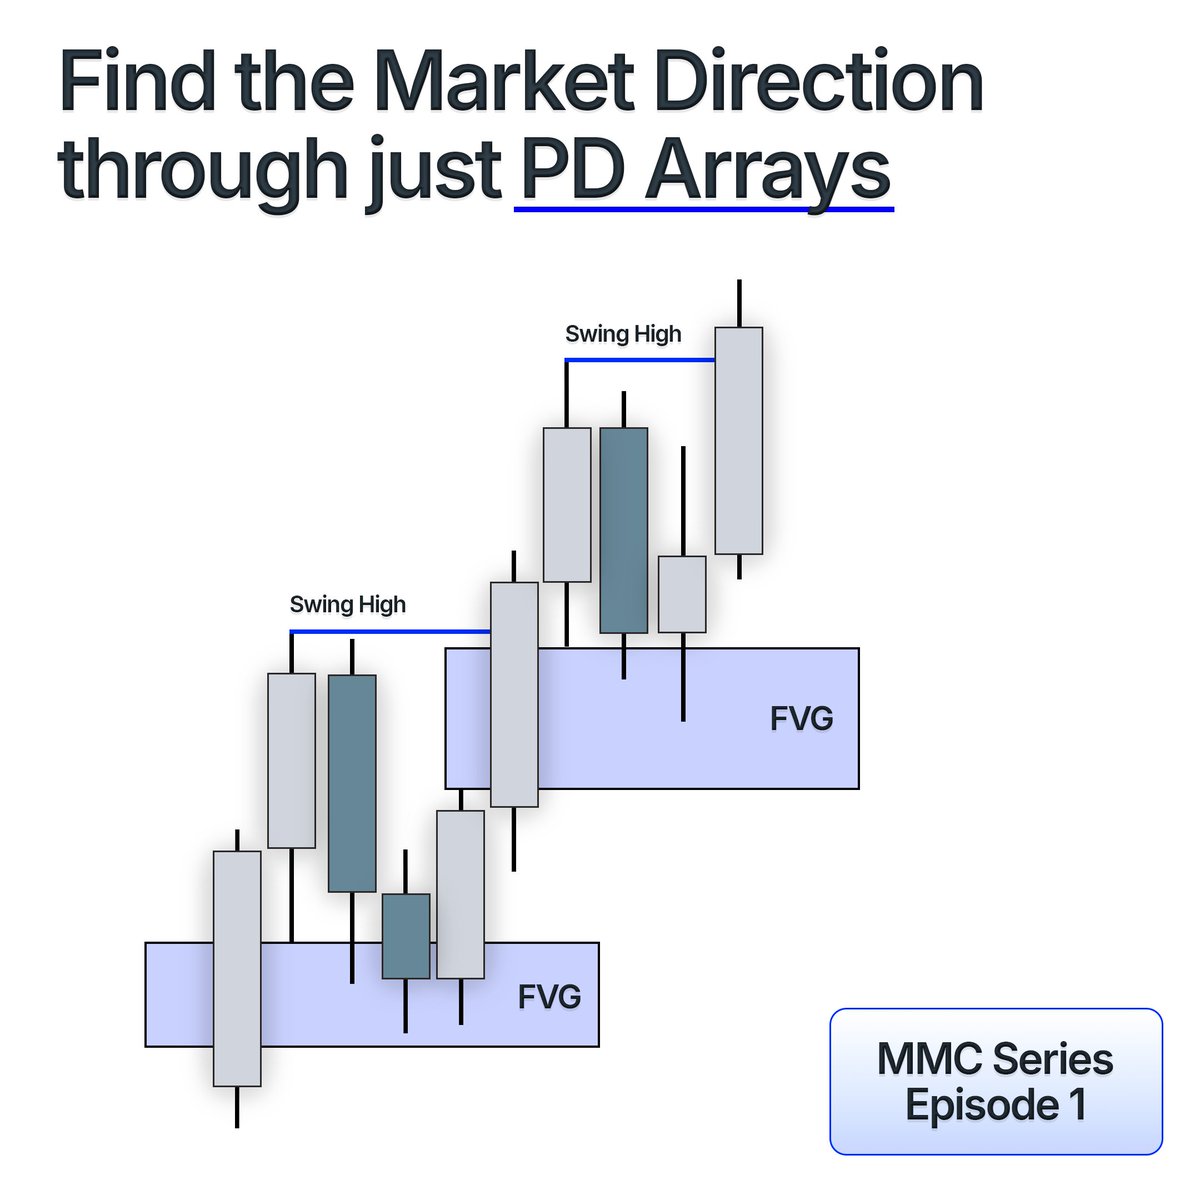
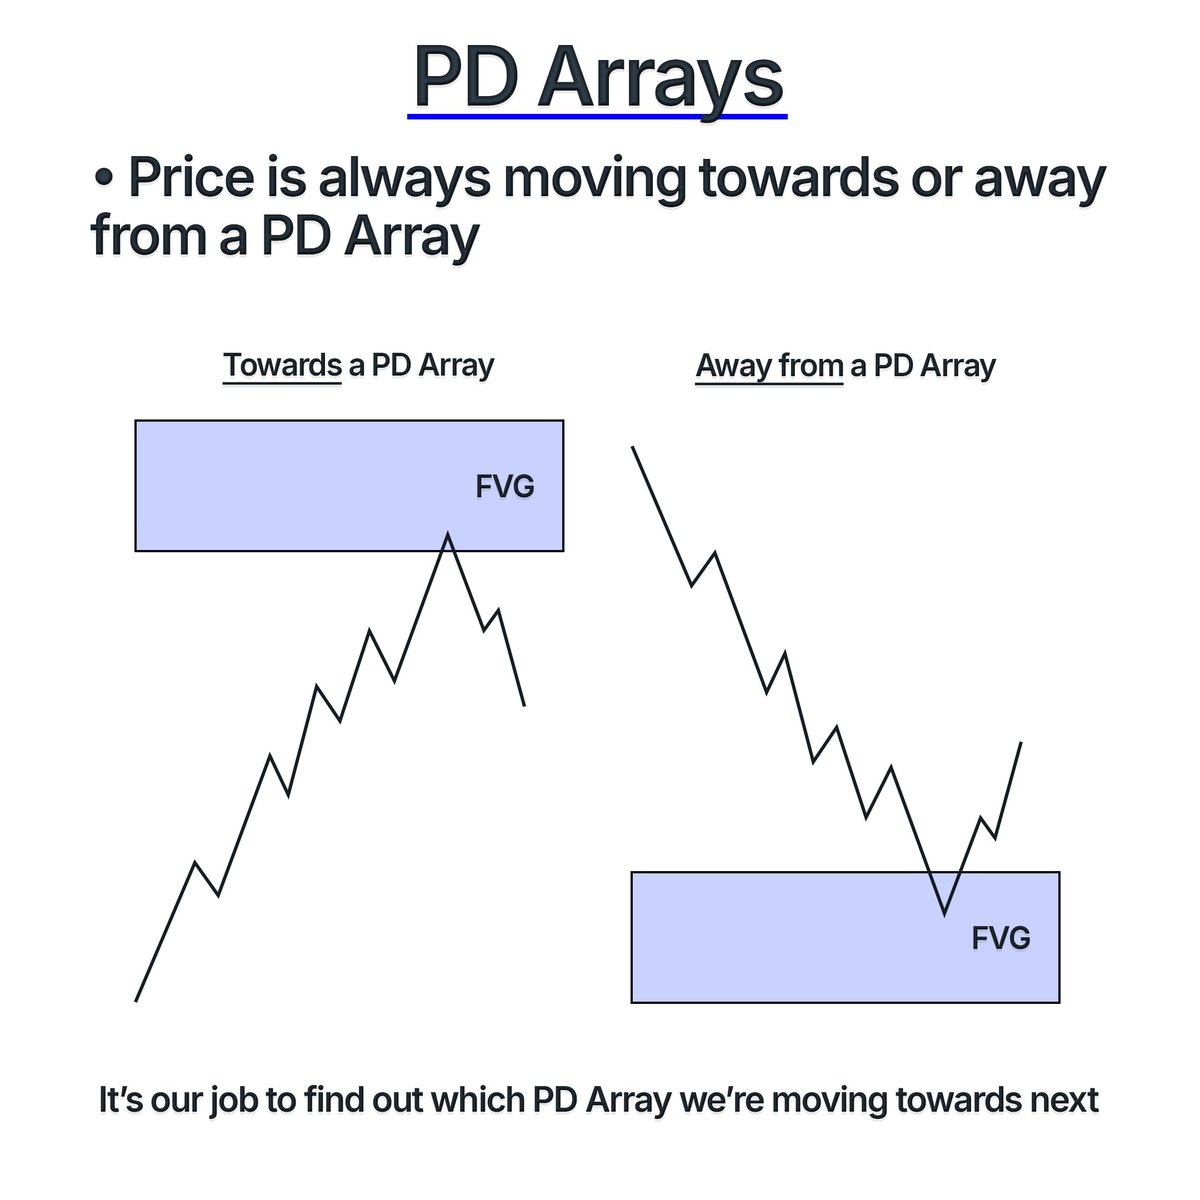
First off we need to understand what a PD Array actually is. Image
Price is constantly either moving towards or away from a PD Array. Image
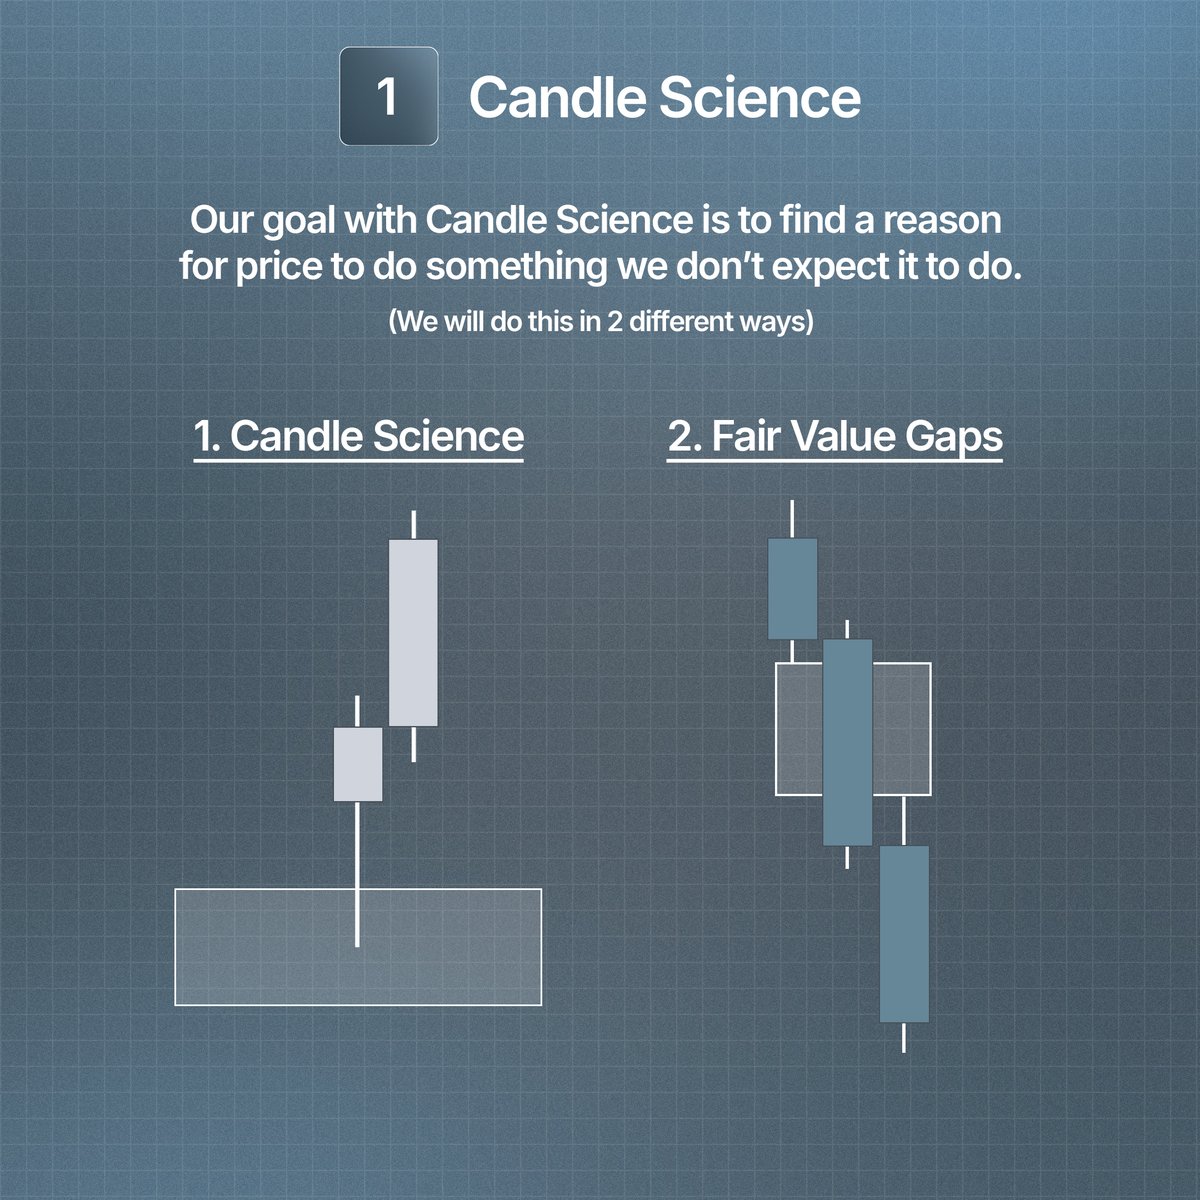
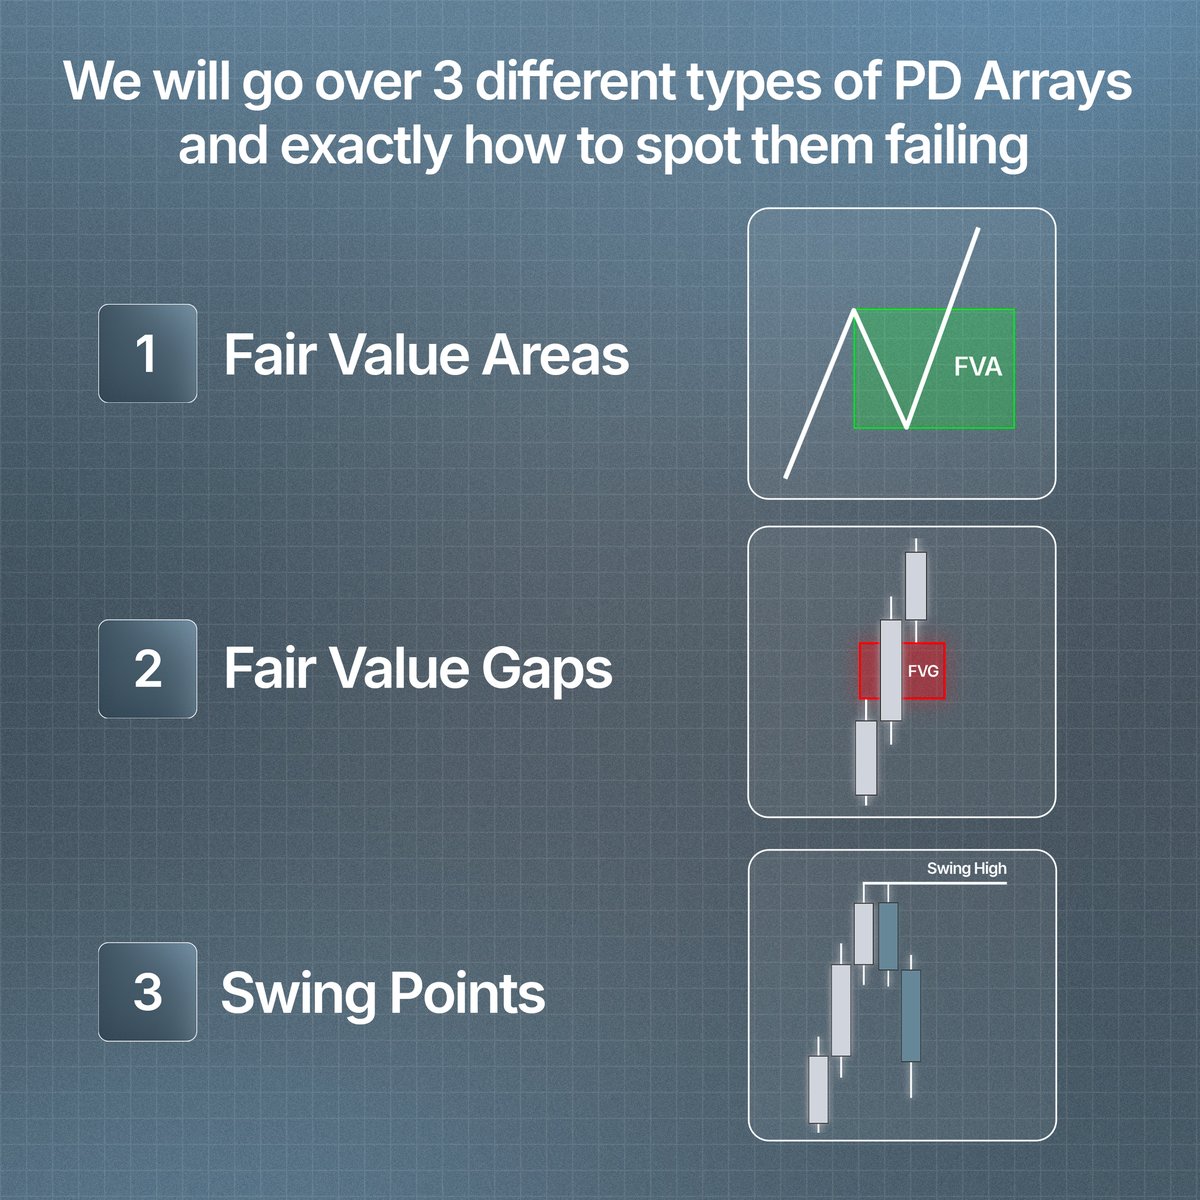
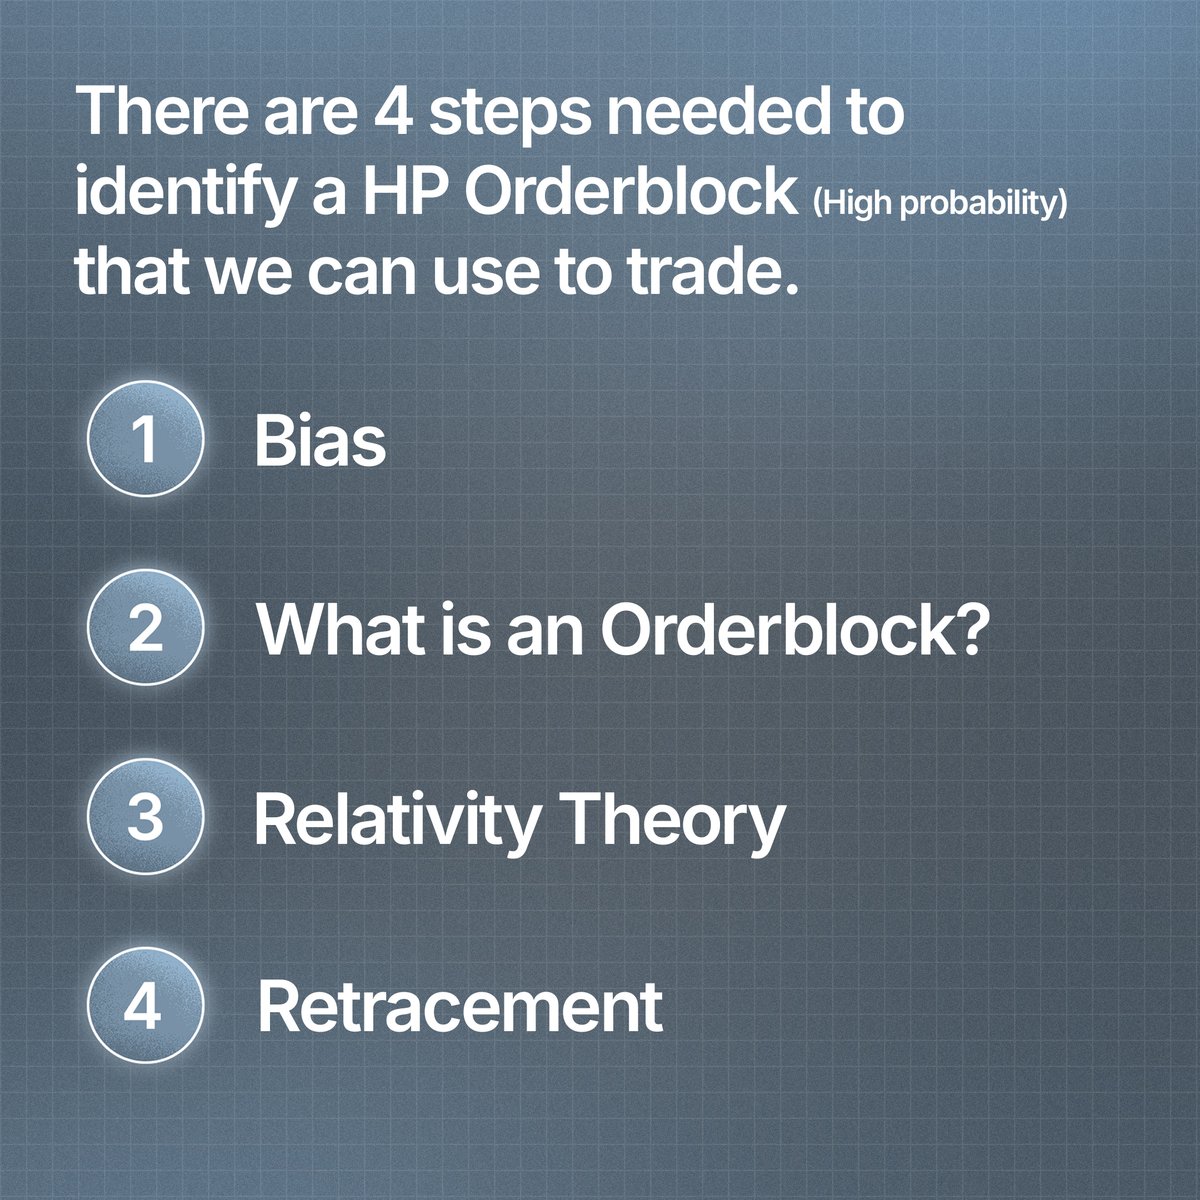
To start off we just need to focus on 3 basic PD Arrays. Image
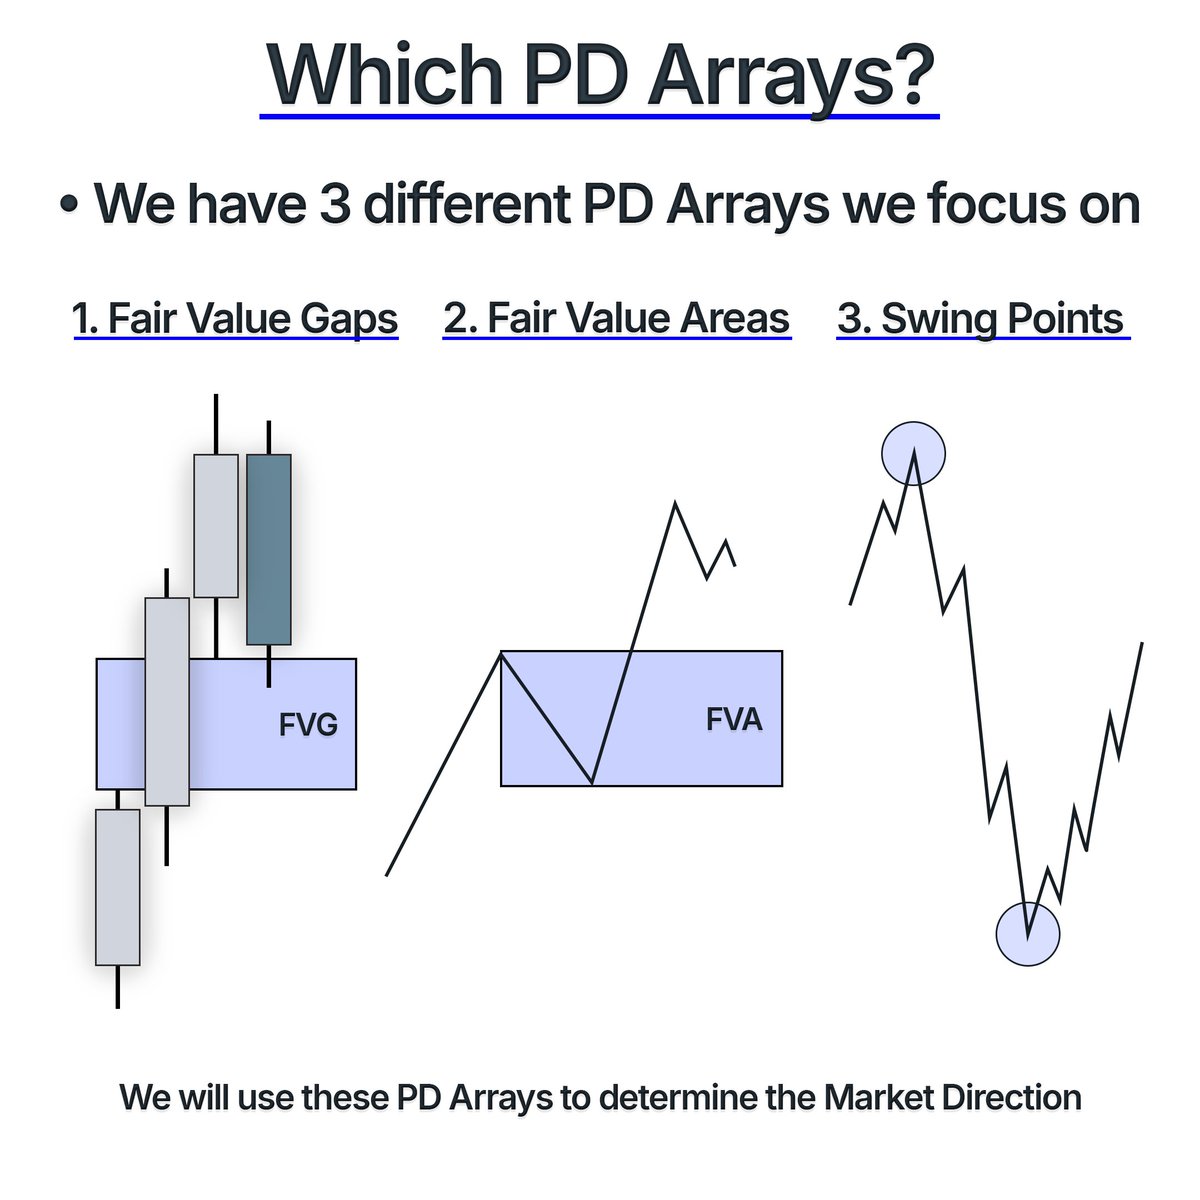
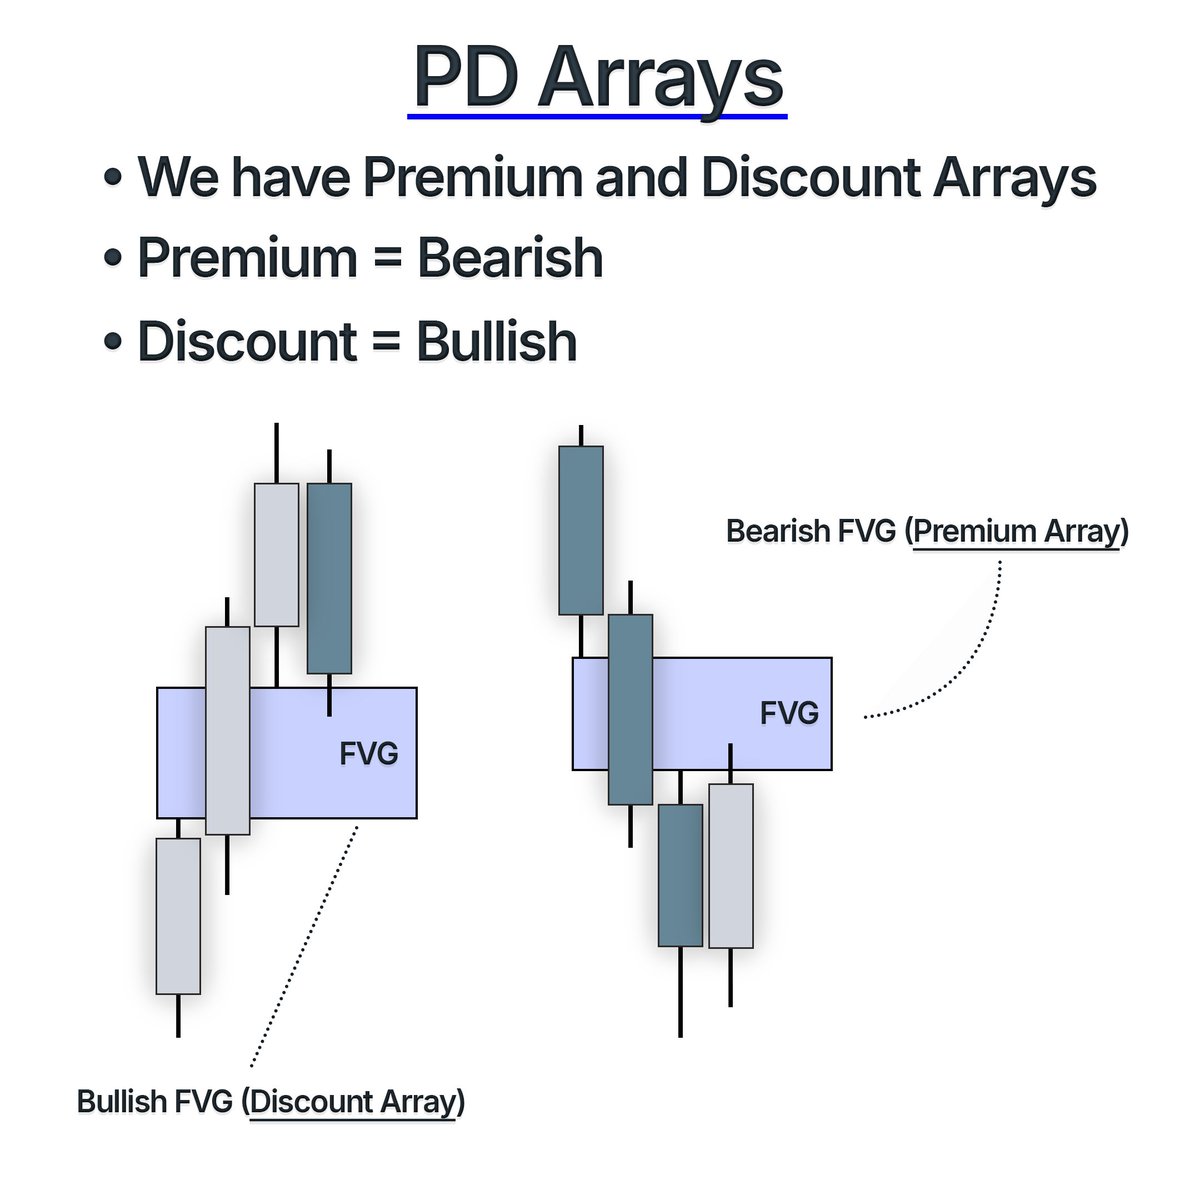
First off we have Fair Value Gaps. FVGs are the superior PD Array as the other PD Arrays are no longer relevant if we don't understand FVGs. Image
Secondly we have Fair Value Areas. FVAs are only relevant to us when we want to trade off of a FVA. We don't necessarily want to trade towards a FVA. Image
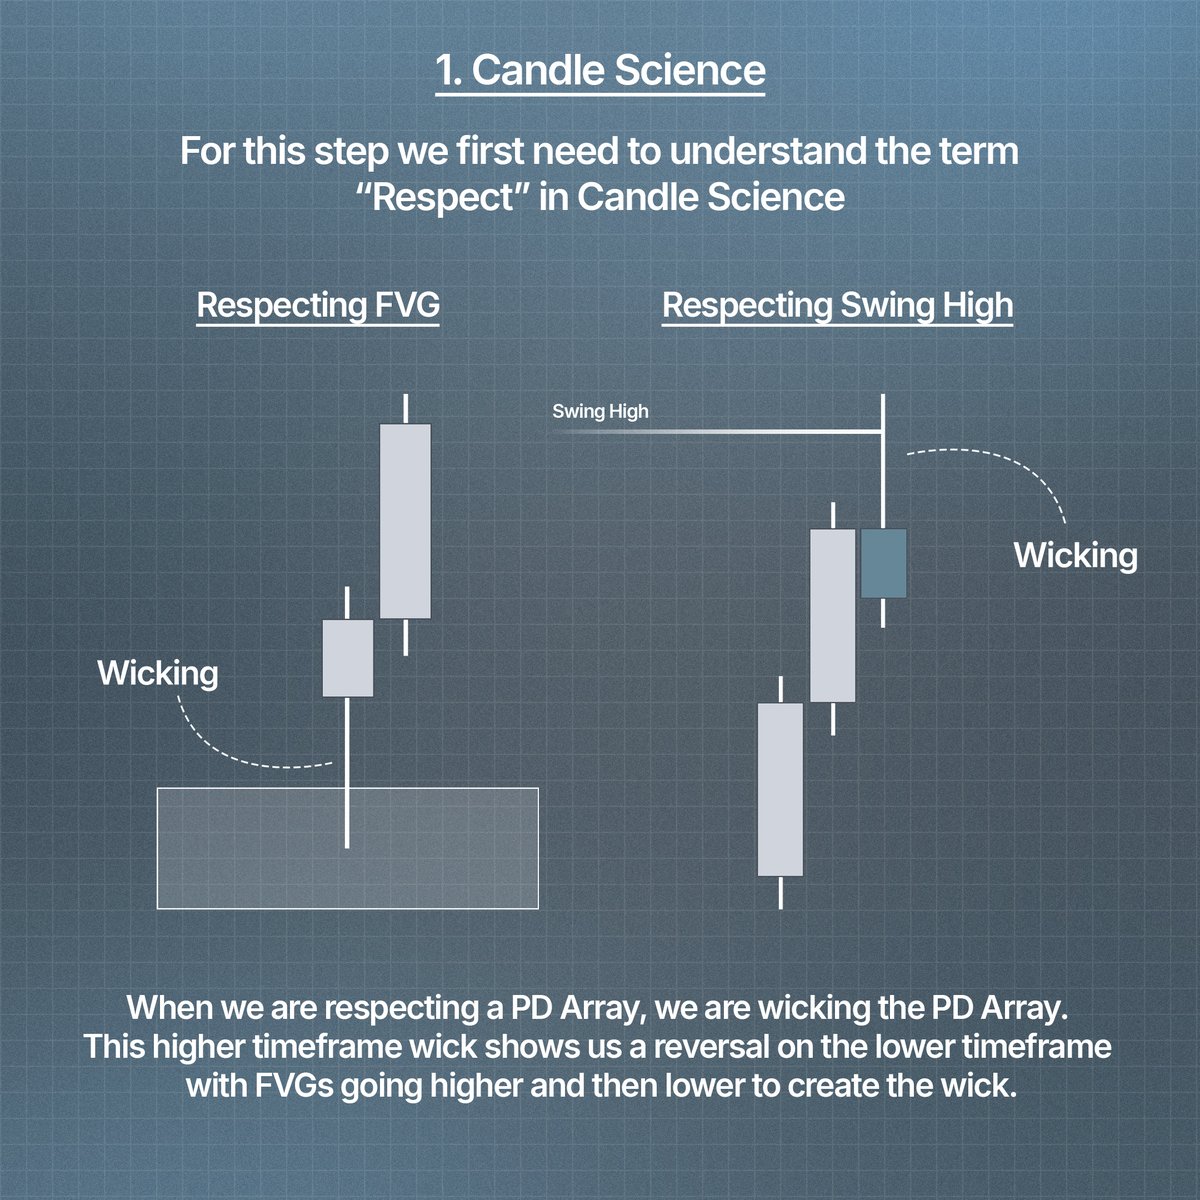
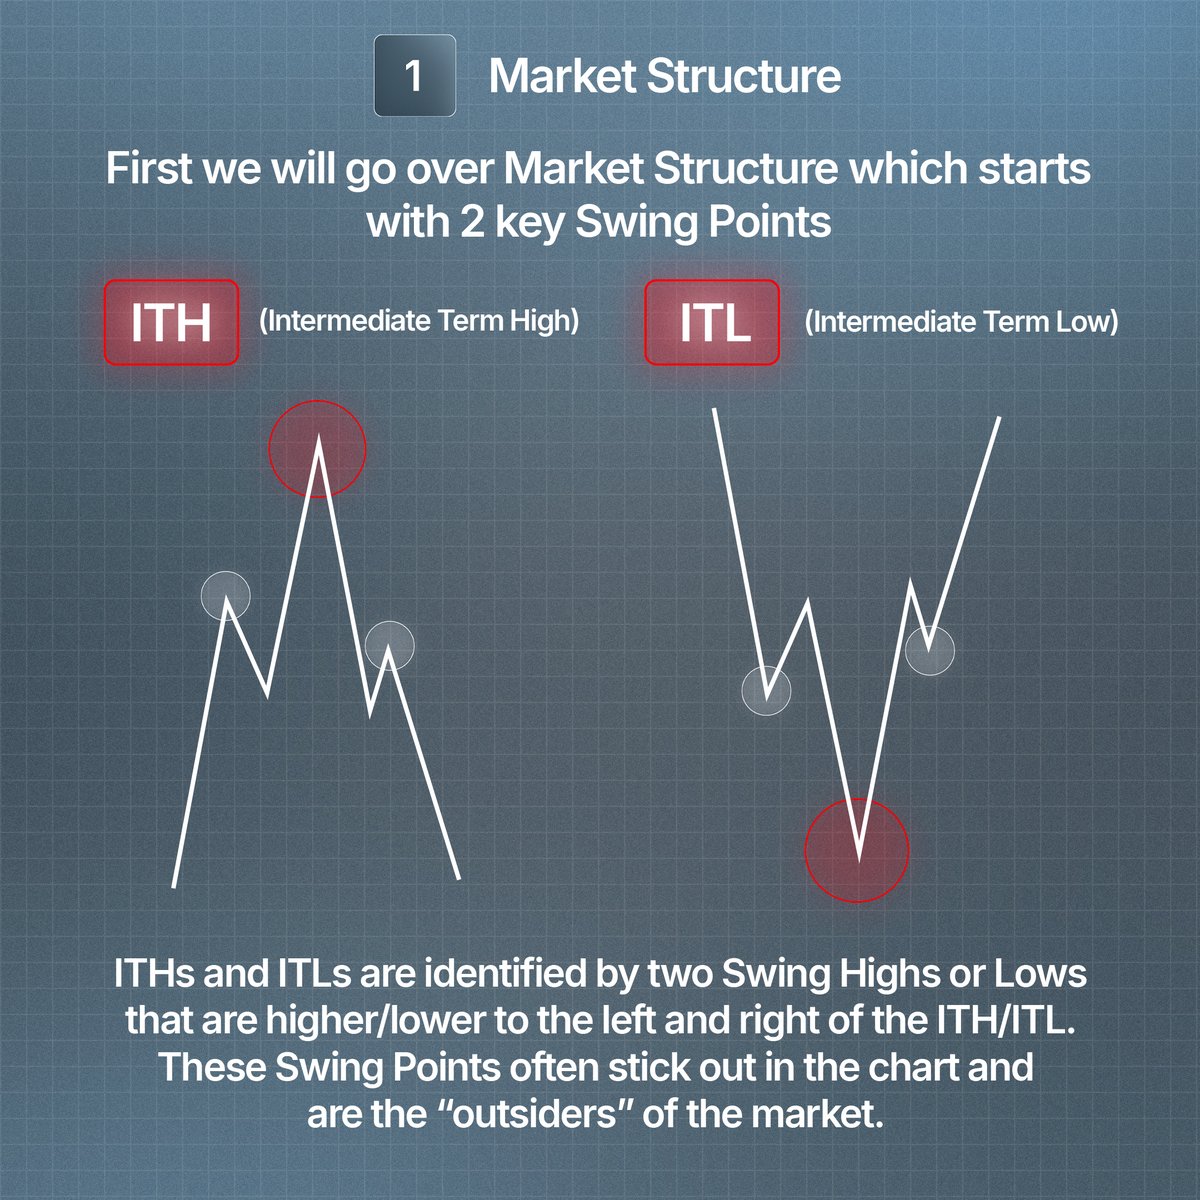
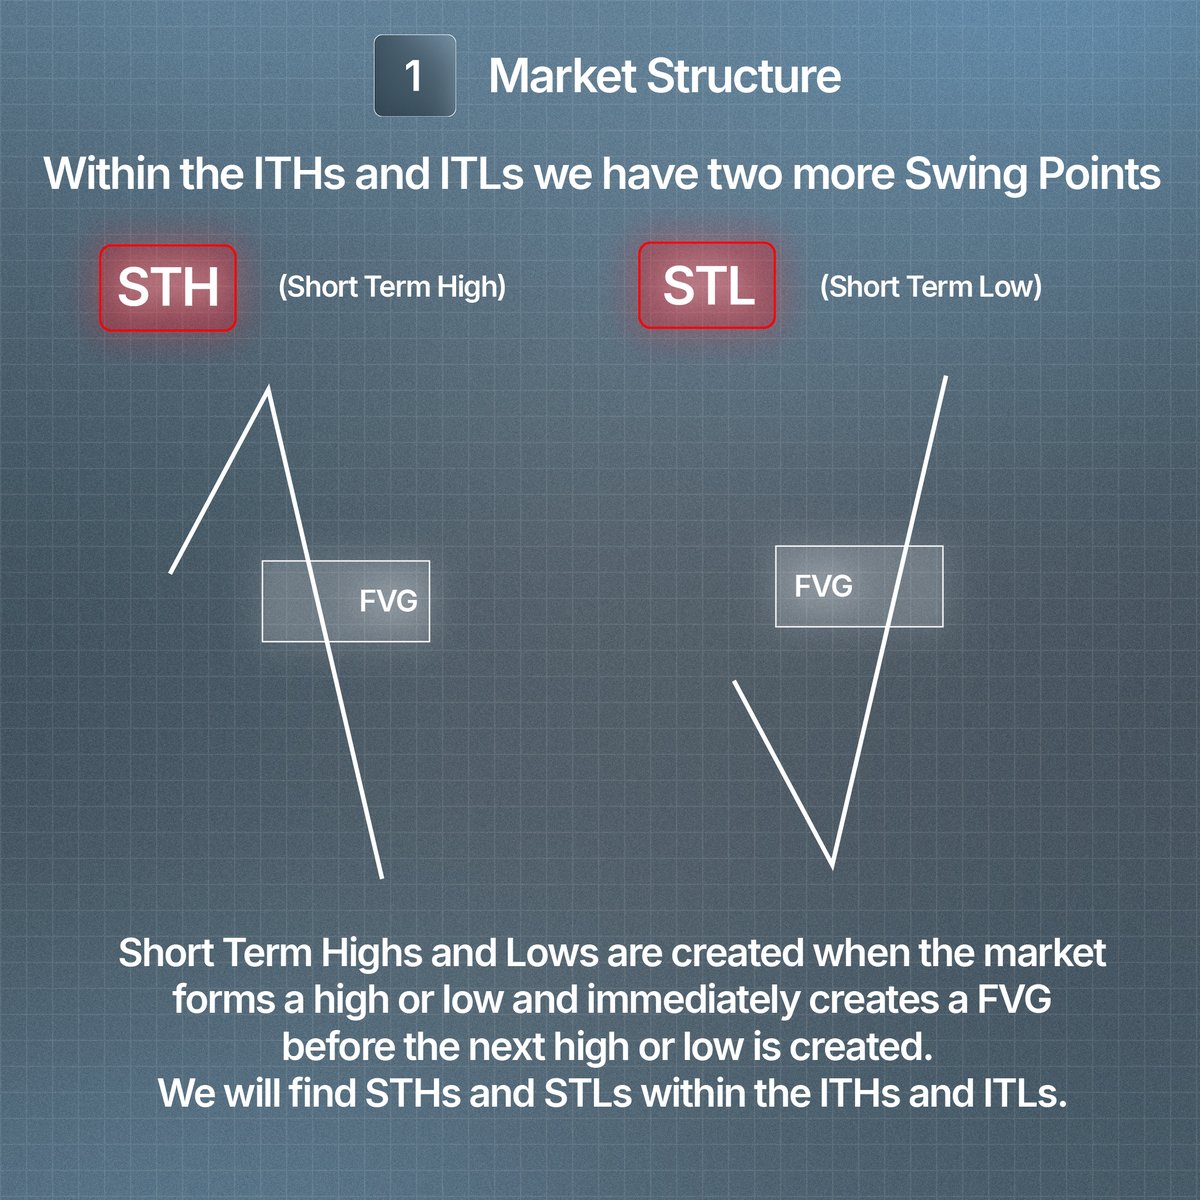
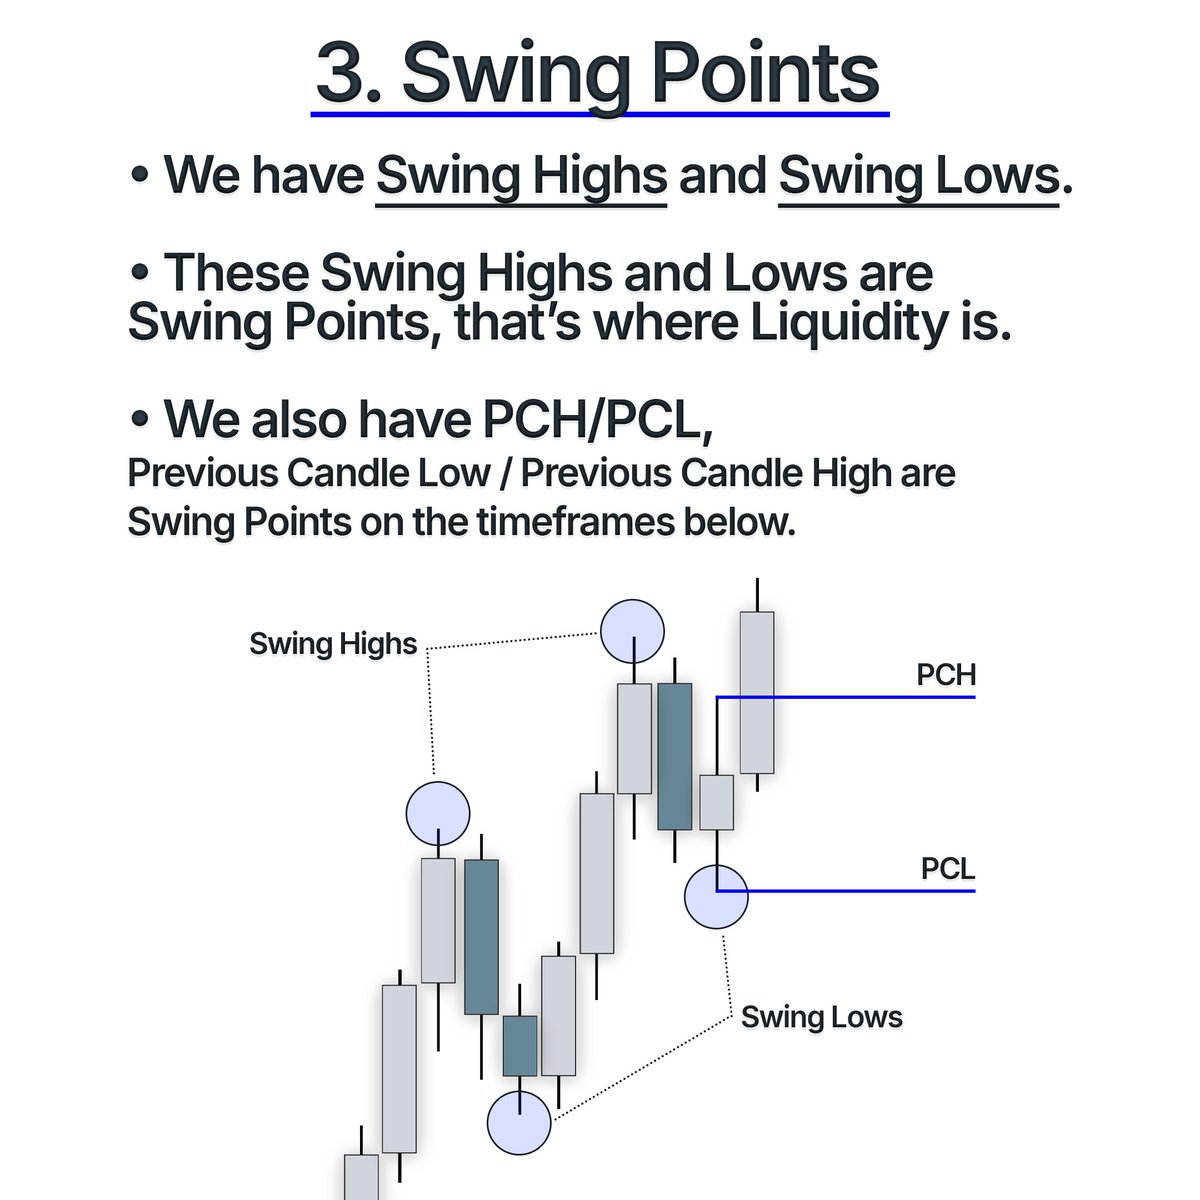
Lastly we have Swing Points. These consist of Swing Highs and Swing Lows. Added to this we can also look at Previous Candle Highs/Lows. Image
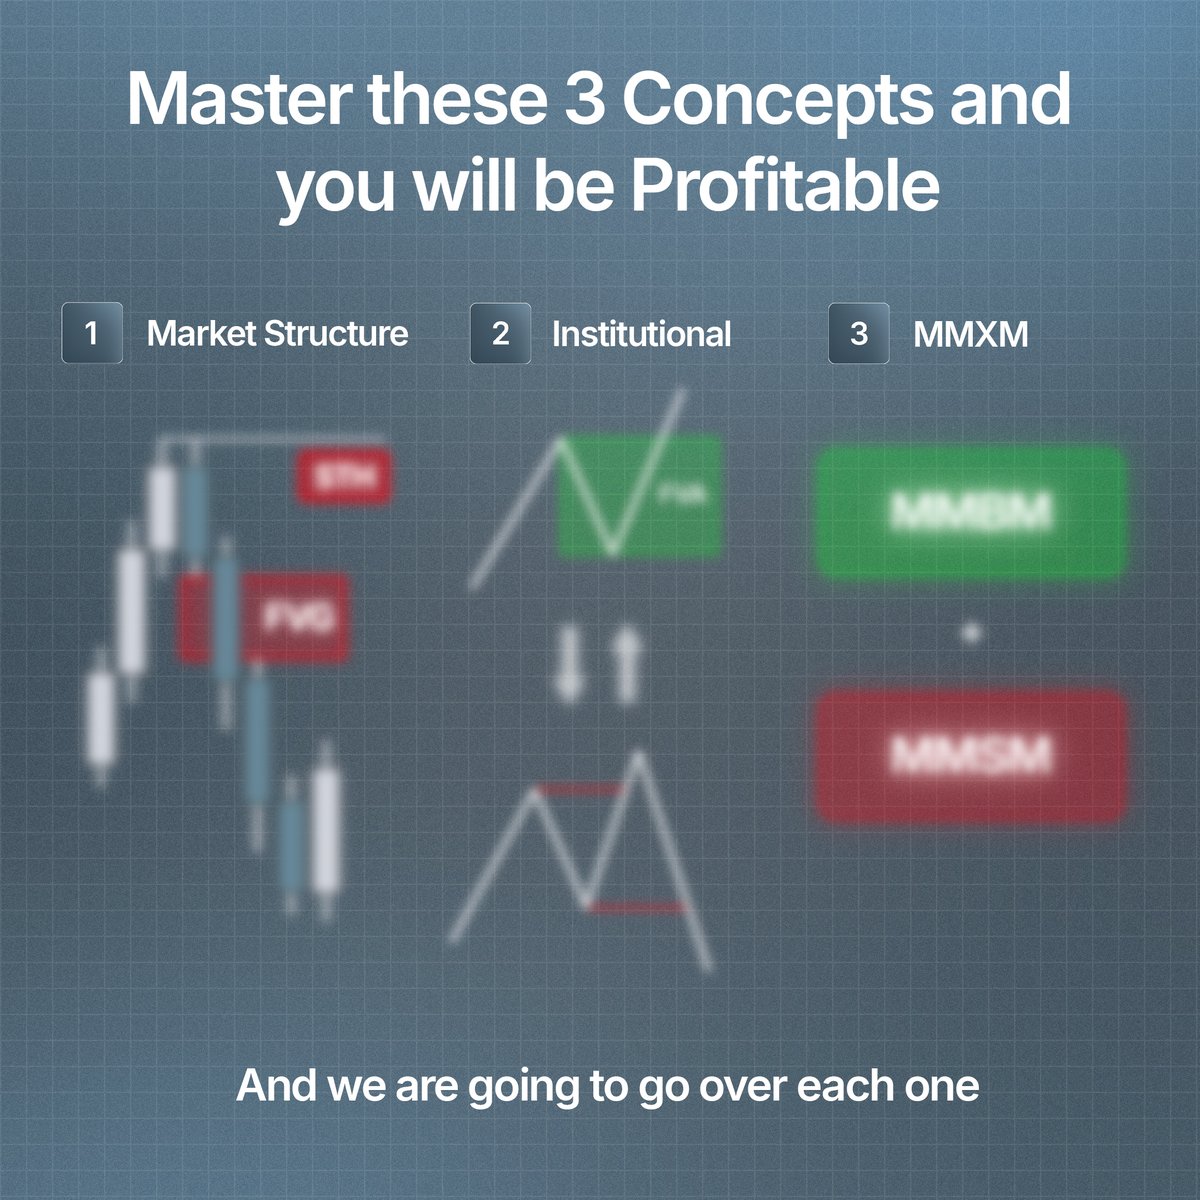
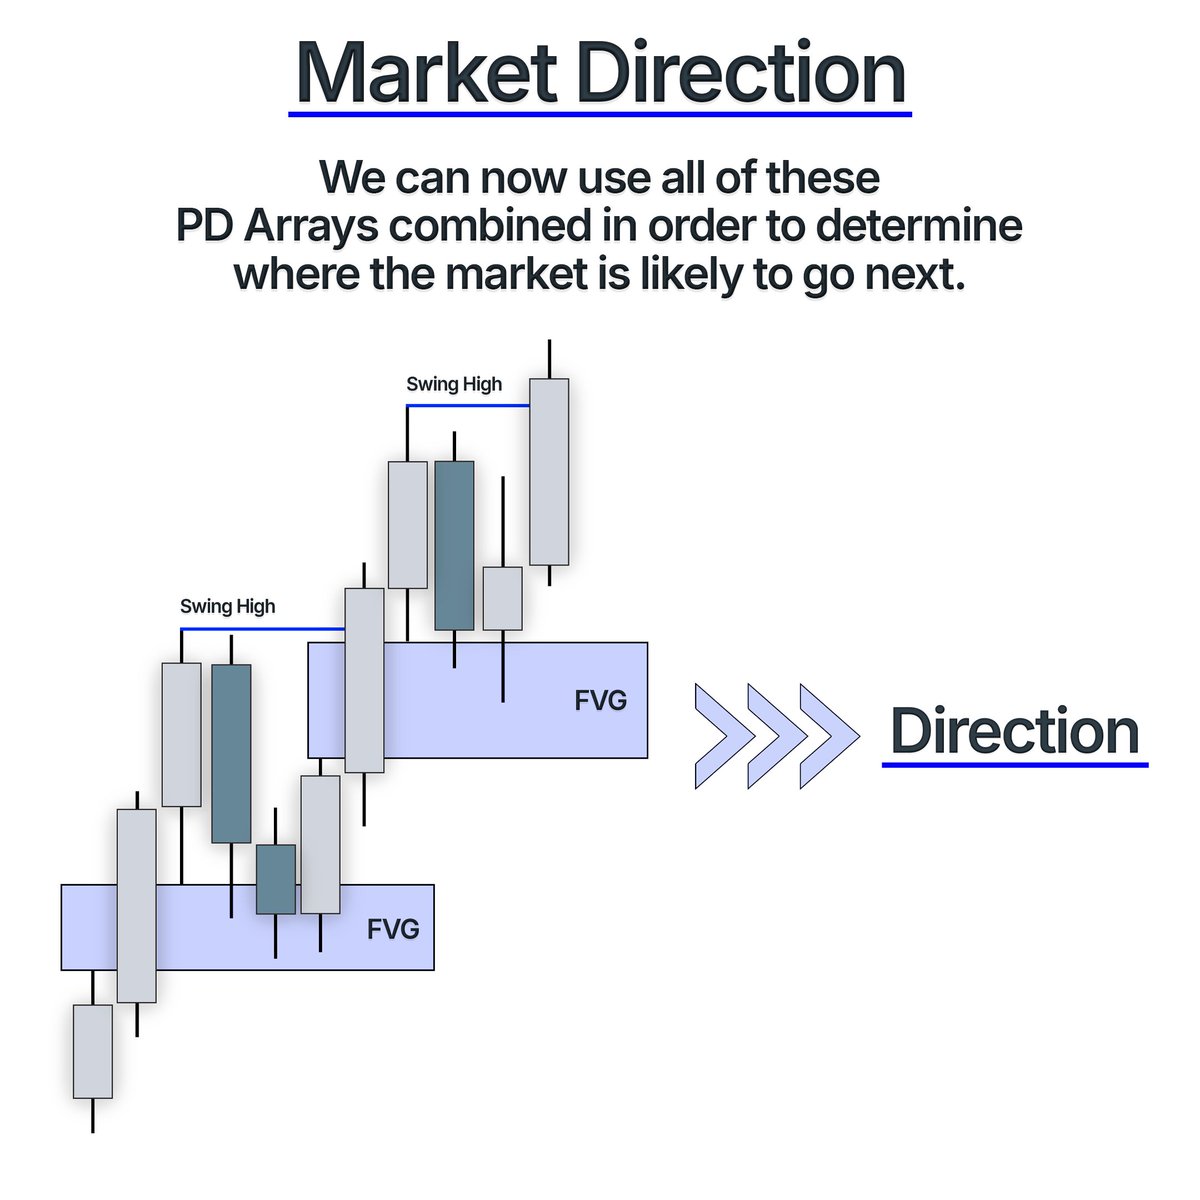
Using just these 3 PD Arrays we can determine where the market is likely to trade next. Image
To practice how to identify these PD Arrays and the market direction we have a Case Study that you can complete to deepen your knowledge. Image
Full Video👇

• • •

Missing some Tweet in this thread? You can try to force a refresh
 

Keep Current with Arjo

Arjo Profile picture

Stay in touch and get notified when new unrolls are available from this author!

Read all threads

This Thread may be Removed Anytime!

PDF

Twitter may remove this content at anytime! Save it as PDF for later use!

Try unrolling a thread yourself!

how to unroll video
  1. Follow @ThreadReaderApp to mention us!

  2. From a Twitter thread mention us with a keyword "unroll"
@threadreaderapp unroll

Practice here first or read more on our help page!

More from @arjoio

Jun 30
Entry Confirmations in 2️⃣ easy steps.

A Thread 🧵 Image
First we need to look at Candle Science. Here we need to determine if there is a reason for price to do something we don't expect it to do, in other words go against our Bias. Image
To understand this we first need to understand what "Respect" in Candle Science means. We will use this to determine if price is respecting a PD Array. Image
Read 11 tweets
Jun 16
Candle Science made easy in 3 steps ✅

A Thread 🧵 Image
What actually is Candle Science?

Candle Science is looking at one candle on the HTF and knowing what the next candle is likely to do. Image
First we need to define what PD Arrays we will be using. We will be using FVGs, Swing Points and Previous Candle Highs/Lows. Image
Read 8 tweets
Jun 9
Master these 3 Concepts and you will be Profitable 💵

A Thread 🧵 Image
First we start off with Market Structure. In specific, Intermediate Term Highs and Lows. Image
Once we understand ITHs and ITLs we can look closer into those with Short Term Highs and Lows. Image
Read 10 tweets
Jun 2
Everything you need to figure out if a PD Array will hold or not ❌

A Thread 🧵 Image
We will go over 3 types of PD Arrays. Image
First we will look at Fair Value Areas. Image
Read 10 tweets
May 26
Everything you need to know about Timeframes ✅

A Thread 🧵 Image
We have 5 steps when formulating a trade idea. The 5 Foundational Levels. Image
For each Foundational Level we will use a variety of timeframes. Image
Read 11 tweets
May 19
Everything you need to know about Orderblocks ✅

A Thread 🧵 Image
There are 4 main steps to identify and validate high probability Orderblocks. Image
Step 1 - Bias

The Bias is the direction in the market that we want to trade towards. This is determined by our DOL. Image
Read 8 tweets

Did Thread Reader help you today?

Support us! We are indie developers!


This site is made by just two indie developers on a laptop doing marketing, support and development! Read more about the story.

Become a Premium Member ($3/month or $30/year) and get exclusive features!

Become Premium

Don't want to be a Premium member but still want to support us?

Make a small donation by buying us coffee ($5) or help with server cost ($10)

Donate via Paypal

Or Donate anonymously using crypto!

Ethereum

0xfe58350B80634f60Fa6Dc149a72b4DFbc17D341E copy

Bitcoin

3ATGMxNzCUFzxpMCHL5sWSt4DVtS8UqXpi copy

Thank you for your support!

Follow Us!

:(