1/ This @FT article is a perfect example on how the media can manipulate information to support a particular narrative.
Let's critically examine the article, its sources, and the rhetorical strategies used to reach favourable conclusions.
🧵
Let's critically examine the article, its sources, and the rhetorical strategies used to reach favourable conclusions.
🧵
https://twitter.com/adilray/status/1822206754114949346
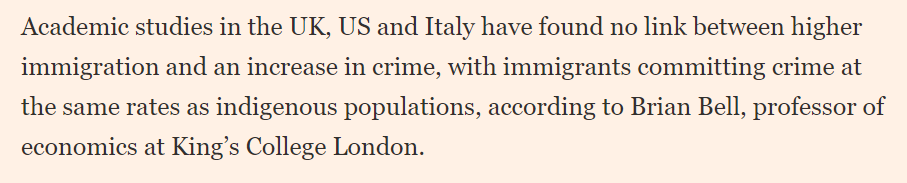
2/ The first contentious claim is that migrants commit crimes at the same rate as natives, often conflating the 'general population' with 'native.'
However, ONS data reveals that 13 of 18 (72%) ethnic groups have higher arrest rates than the native White British population.
However, ONS data reveals that 13 of 18 (72%) ethnic groups have higher arrest rates than the native White British population.

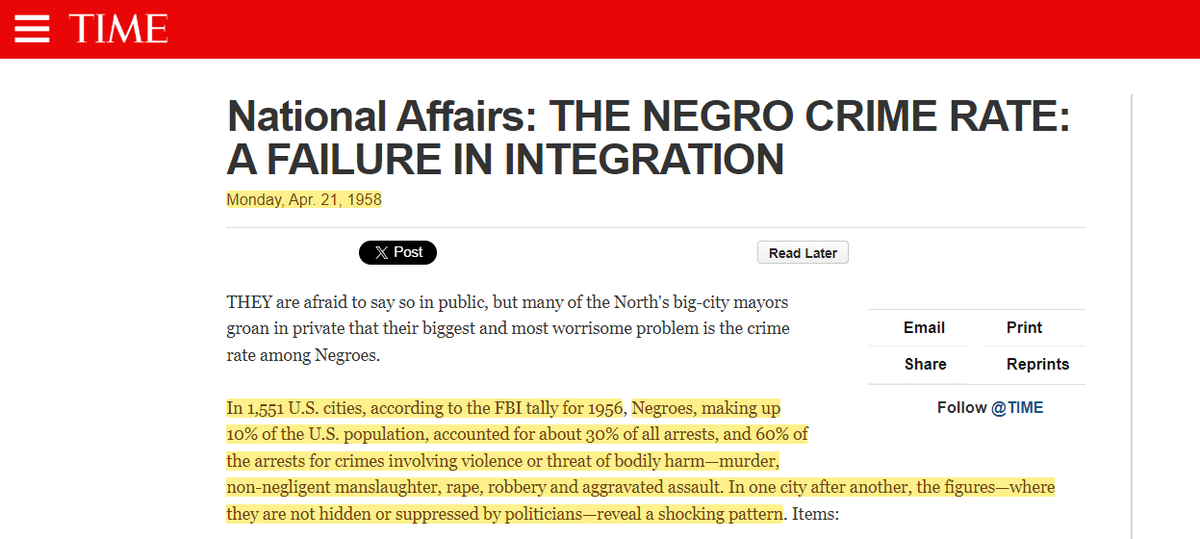
3/ The article cites the US as evidence that immigrants commit crimes at the same rates as the natives.
This is a common tactic for those pushing pro-immigration arguments, although comparing these populations is completely misleading
This is a common tactic for those pushing pro-immigration arguments, although comparing these populations is completely misleading
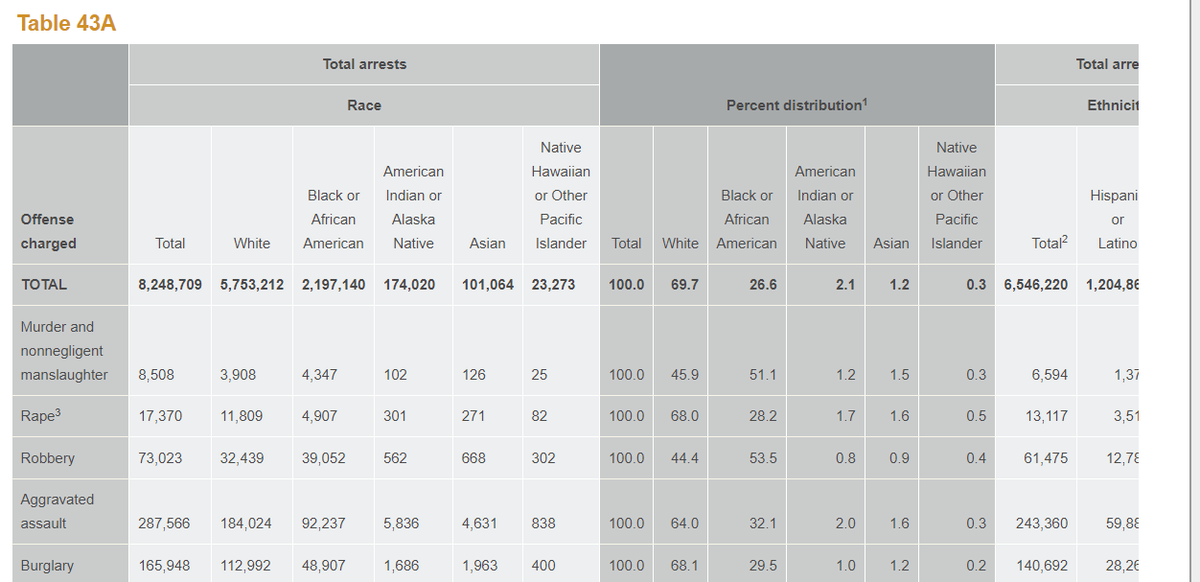
4/ Why?
The US has a large native Black population (13%) who since the 1950s, have consistently accounted for 40-60% of the violent crime in the country according to FBI data
1:
2: content.time.com/time/subscribe…
archive.ph/iVKkY
The US has a large native Black population (13%) who since the 1950s, have consistently accounted for 40-60% of the violent crime in the country according to FBI data
1:
2: content.time.com/time/subscribe…
archive.ph/iVKkY
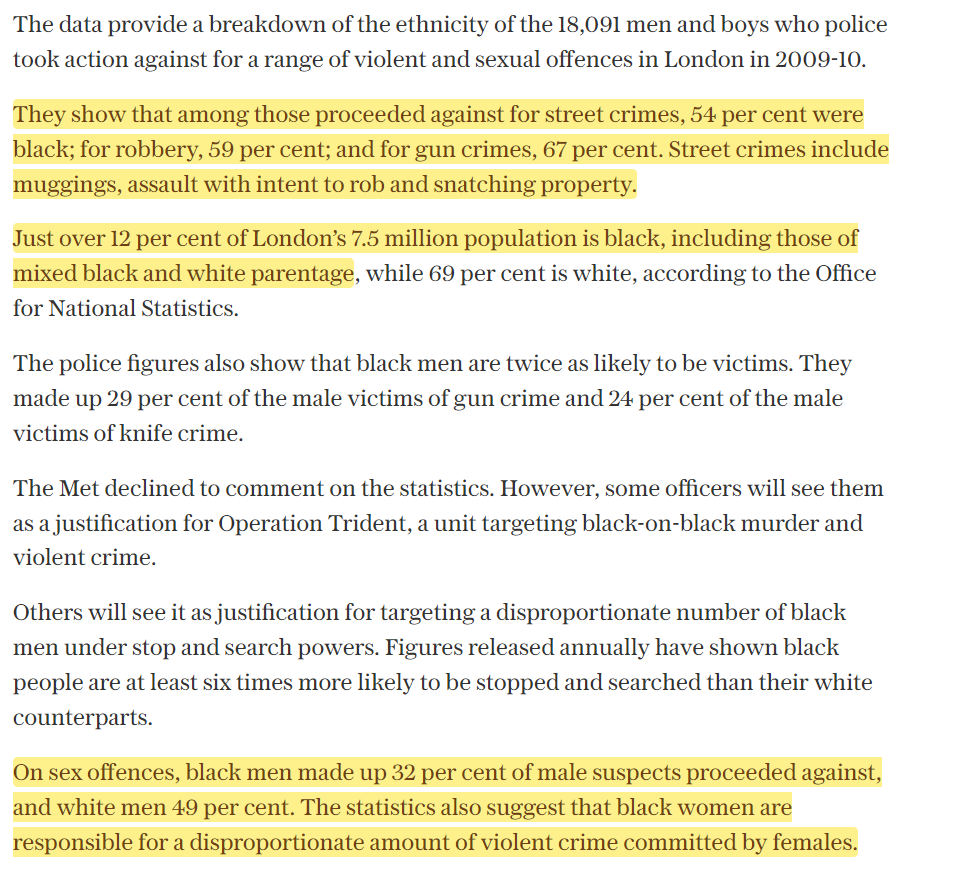
5/ Although US stats are eerily similar to London, with Black Londoners being 13% of the city's pop. but account for:
•61% of knife homicide
•59% of robberies
•67% of gun crime
•54% of street crime
•32% of sex offenses
1:
2: london.gov.uk/press-releases…
telegraph.co.uk/news/uknews/cr…
•61% of knife homicide
•59% of robberies
•67% of gun crime
•54% of street crime
•32% of sex offenses
1:
2: london.gov.uk/press-releases…
telegraph.co.uk/news/uknews/cr…

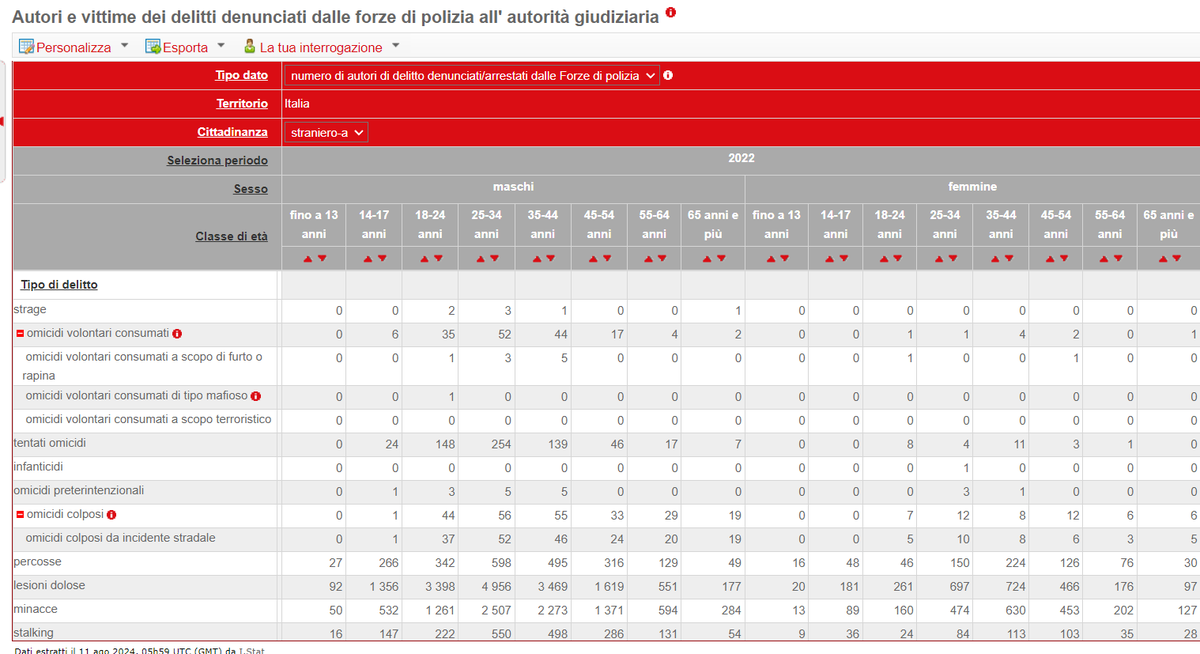
6/ They also reference Italy (without source)
Migrants account for 8.45% of the Italian population but 31% of the prison population
In 2021, migrants committed:
•20% of homicides
•39% of sexual assaults
•52% of robberies
1:
2: rapportoantigone.it/ventesimo-rapp…
giustizia.it/giustizia/it/m…
Migrants account for 8.45% of the Italian population but 31% of the prison population
In 2021, migrants committed:
•20% of homicides
•39% of sexual assaults
•52% of robberies
1:
2: rapportoantigone.it/ventesimo-rapp…
giustizia.it/giustizia/it/m…
7/ We also have data for crimes by minors in Italy.
The data shows that non-EU minors commit (attributable to their age group):
•65% of muggings
•50.2% of thefts
•48.1 percent of robberies
•47.7 percent of sexual assaults
•40.4 percent of beatings
dati.istat.it/Index.aspx?Dat…
The data shows that non-EU minors commit (attributable to their age group):
•65% of muggings
•50.2% of thefts
•48.1 percent of robberies
•47.7 percent of sexual assaults
•40.4 percent of beatings
dati.istat.it/Index.aspx?Dat…
8/ The article references a 2013 study which compares the UK population against a handful of newly accepted EU countries (Poles, Latvians, etc classed as A8) and asylum seekers.
The FT article does its best to obfuscate the findings pertaining to asylum seeker crime rates
The FT article does its best to obfuscate the findings pertaining to asylum seeker crime rates
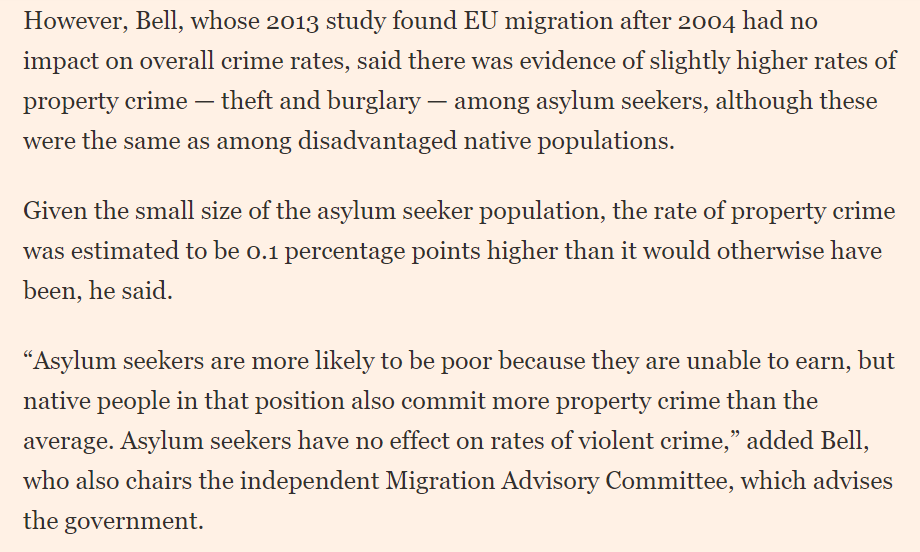
9/ The study's findings reveal that asylum seekers commit crimes at four times the rate of the general population
An important detail that the FT article conveniently didn't mention
Here is a link to the study:
eprints.lse.ac.uk/59323/1/CEP_Be…
An important detail that the FT article conveniently didn't mention
Here is a link to the study:
eprints.lse.ac.uk/59323/1/CEP_Be…
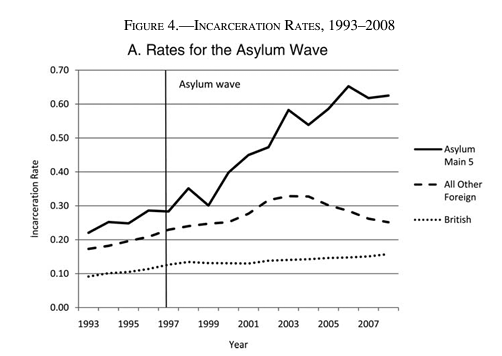
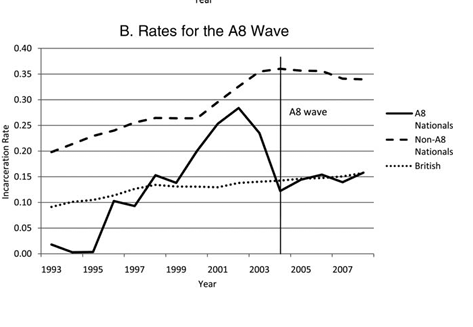
10/ The data shows that by 2007, EU A8 migrants had similar incarceration rates to the British population, while non-A8 migrants had more than double the rate.
The FT article, however, only focuses the A8 cohort, while drawing conclusions about immigration as a whole
Curious..
The FT article, however, only focuses the A8 cohort, while drawing conclusions about immigration as a whole
Curious..
11/ If you want a thorough breakdown on impact of migration on crime, here's a thread which has data from several nations (including the UK) across Europe.
It's notable that the FT chose not to include any of these statistics
It's notable that the FT chose not to include any of these statistics
https://x.com/CompositeGuy_/status/1731305796225384926
12/ The next section focuses on the economy
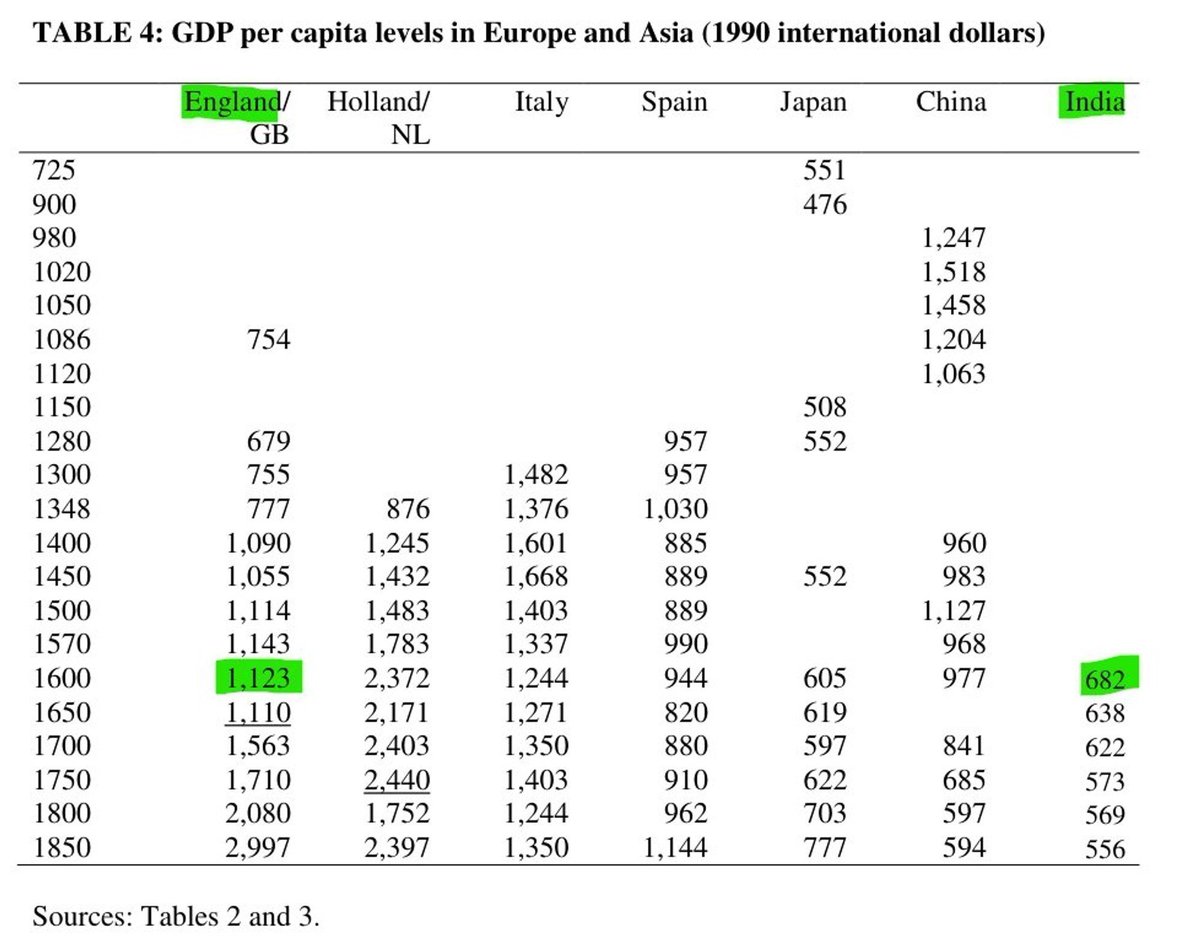
The statement that net immigration (or rather increasing the population) leads to a larger economy is true, but does it improve our quality of life?
India has a larger economy than Canada, but has considerably worse living standards
The statement that net immigration (or rather increasing the population) leads to a larger economy is true, but does it improve our quality of life?
India has a larger economy than Canada, but has considerably worse living standards
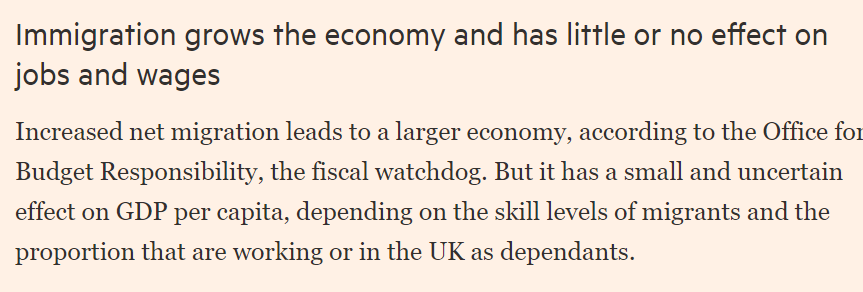
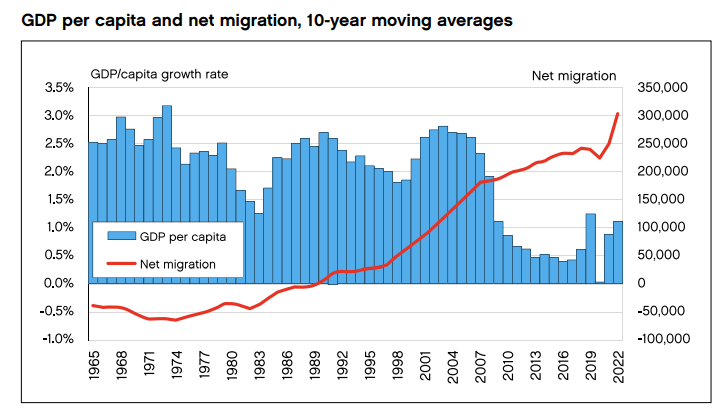
13/ The article claims "it has a small and uncertain effect on GDP per capita"
What we actually see is GDP per capita growth stagnating as immigration increases.
If mass-immigration is good for the economy, when will we see real positive returns on it?
cps.org.uk/wp-content/upl…
What we actually see is GDP per capita growth stagnating as immigration increases.
If mass-immigration is good for the economy, when will we see real positive returns on it?
cps.org.uk/wp-content/upl…
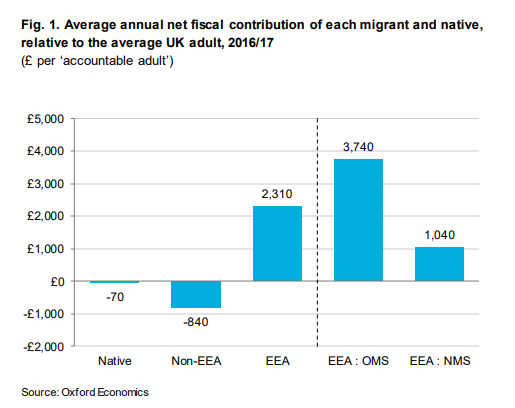
14/ An Oxford study revealed that EEA migrants are positive contributors (+£4.7bn) while non-EEA migrants are negative (-£9bn) and contribute substantially less to the economy than the native population (native includes 2nd, 3rd, 4th generation migrants)
oxfordeconomics.com/resource/the-f…
oxfordeconomics.com/resource/the-f…
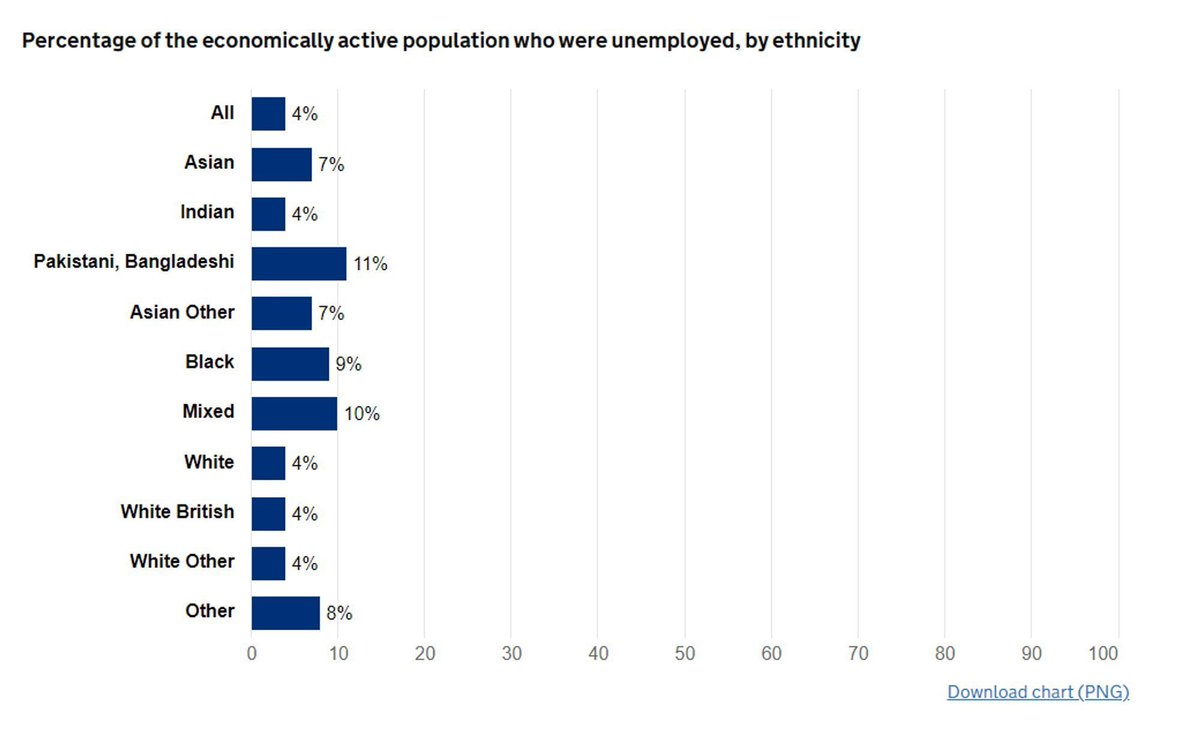
15/ Conflating 'native' with 'UK born' renders the effects of immigration by different groups almost meaningless.
Using ethnic group data, we can see that except for Indians, all non-European migrants have lower rates of employment than the native White British population
Using ethnic group data, we can see that except for Indians, all non-European migrants have lower rates of employment than the native White British population
16/ ONS data shows that all non-White group categories were net beneficiaries in terms of taxes paid and benefits received

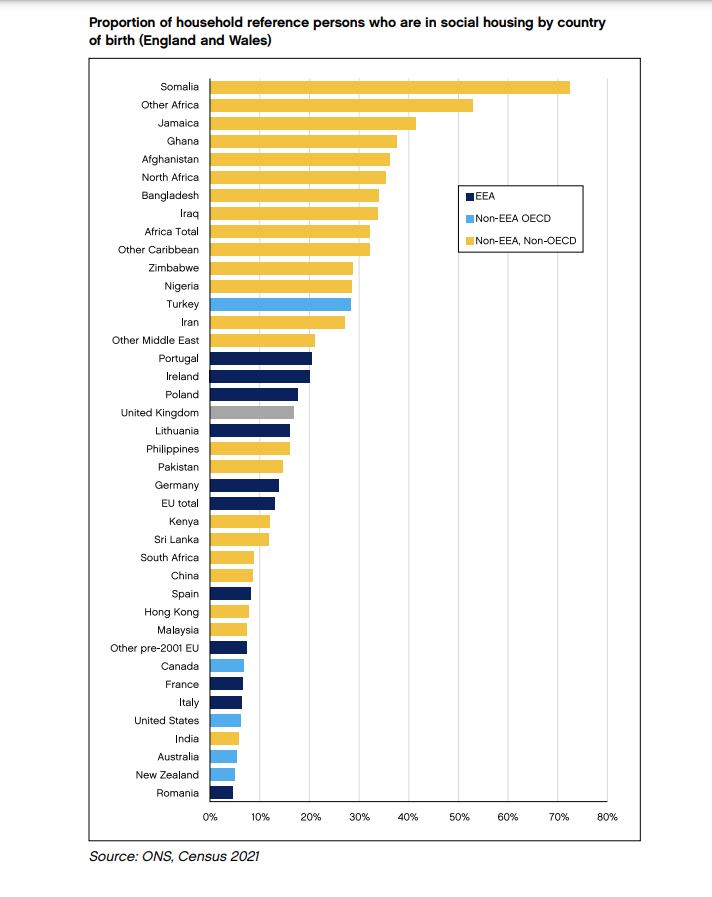
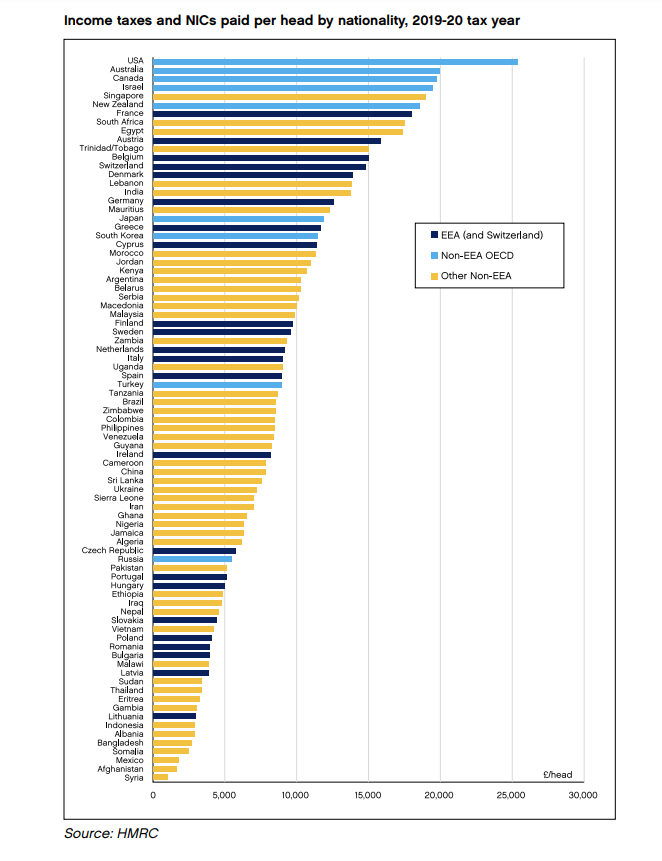
17/ Here is the data on social housing rates and per capita income by nationality
The charts show Anglosphere migrants to be the largest contributors while migrants from predominately Muslim or African nations to be the least likely to.
cps.org.uk/wp-content/upl…
The charts show Anglosphere migrants to be the largest contributors while migrants from predominately Muslim or African nations to be the least likely to.
cps.org.uk/wp-content/upl…
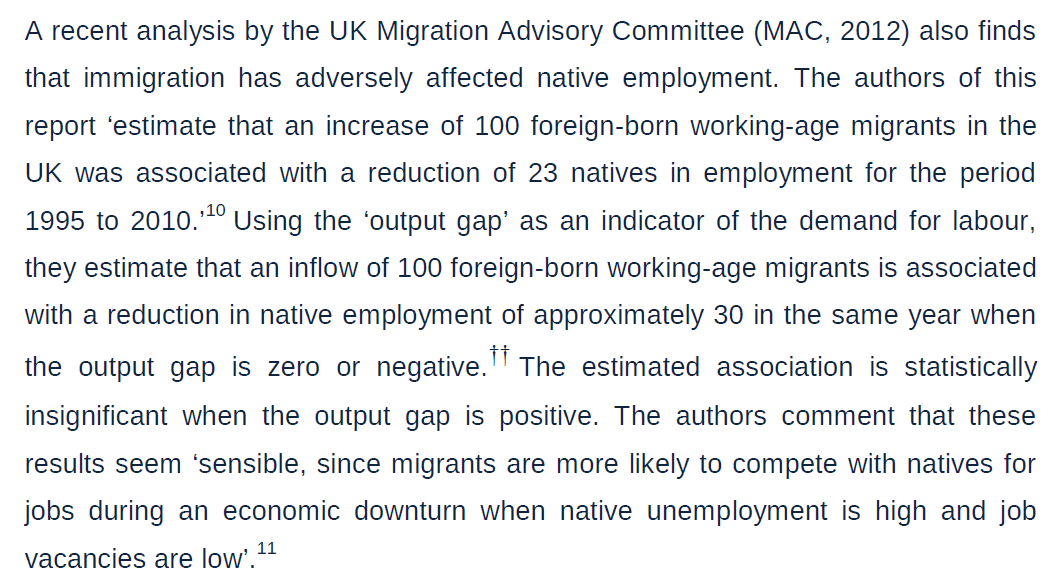
18/ The FT article acknowledges that immigration suppresses wages for those at the lower end of the income distribution
Research has also found that an increase of 100 foreign-born migrants was linked to a reduction of 23 natives in employment
readkong.com/page/large-sca…
Research has also found that an increase of 100 foreign-born migrants was linked to a reduction of 23 natives in employment
readkong.com/page/large-sca…
19/ Here’s a thread that provides a more in-depth analysis of immigration's impact on European economies.
The conclusion is Western and East Asian migrants tend to be beneficial, while migrants from the global south tend to be net negative.
The conclusion is Western and East Asian migrants tend to be beneficial, while migrants from the global south tend to be net negative.
https://x.com/CompositeGuy_/status/1701336115385663501
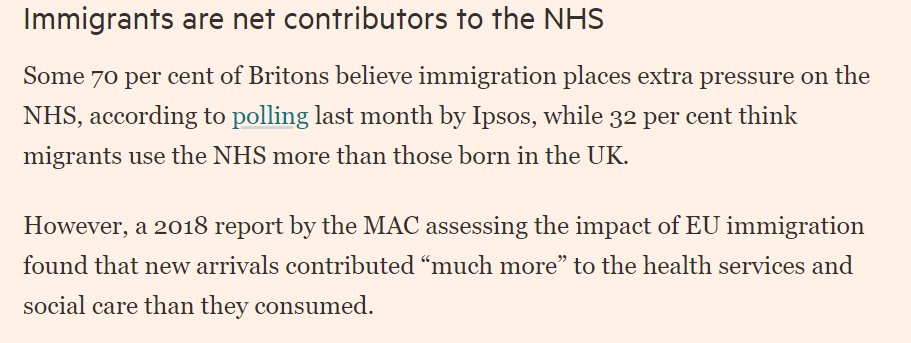
20/ The next section addresses the NHS
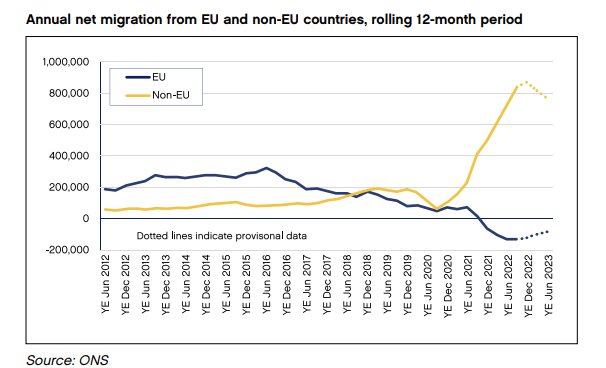
Here, the authors once again use EU migrants, who are positive contributors, to generalise about immigration overall, despite non-EU migrants being net negative contributors
Non-EU migrants make up the overwhelming majority of our migrants
Here, the authors once again use EU migrants, who are positive contributors, to generalise about immigration overall, despite non-EU migrants being net negative contributors
Non-EU migrants make up the overwhelming majority of our migrants
21/ The authors claim "Immigration is also essential for staffing the NHS" but is it?
Currently, the government caps the number of training places at UK medical schools at 7,500
bbc.co.uk/news/health-62…
Currently, the government caps the number of training places at UK medical schools at 7,500
bbc.co.uk/news/health-62…
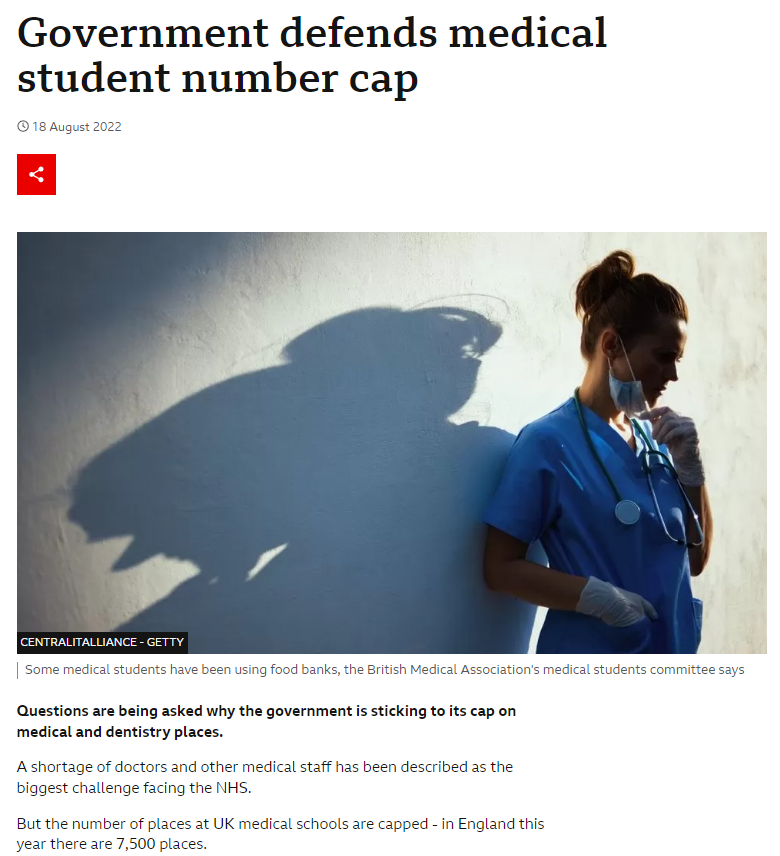
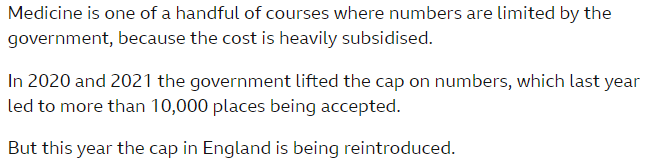
22/ When the cap was temporarily lifted in 2020/21 to 10,000, demand for medical training places surged, but the cap was reinstated in 2022.
Every year, hundreds of straight A students are rejected from all medical courses to which they applied due to the government policy.
Every year, hundreds of straight A students are rejected from all medical courses to which they applied due to the government policy.
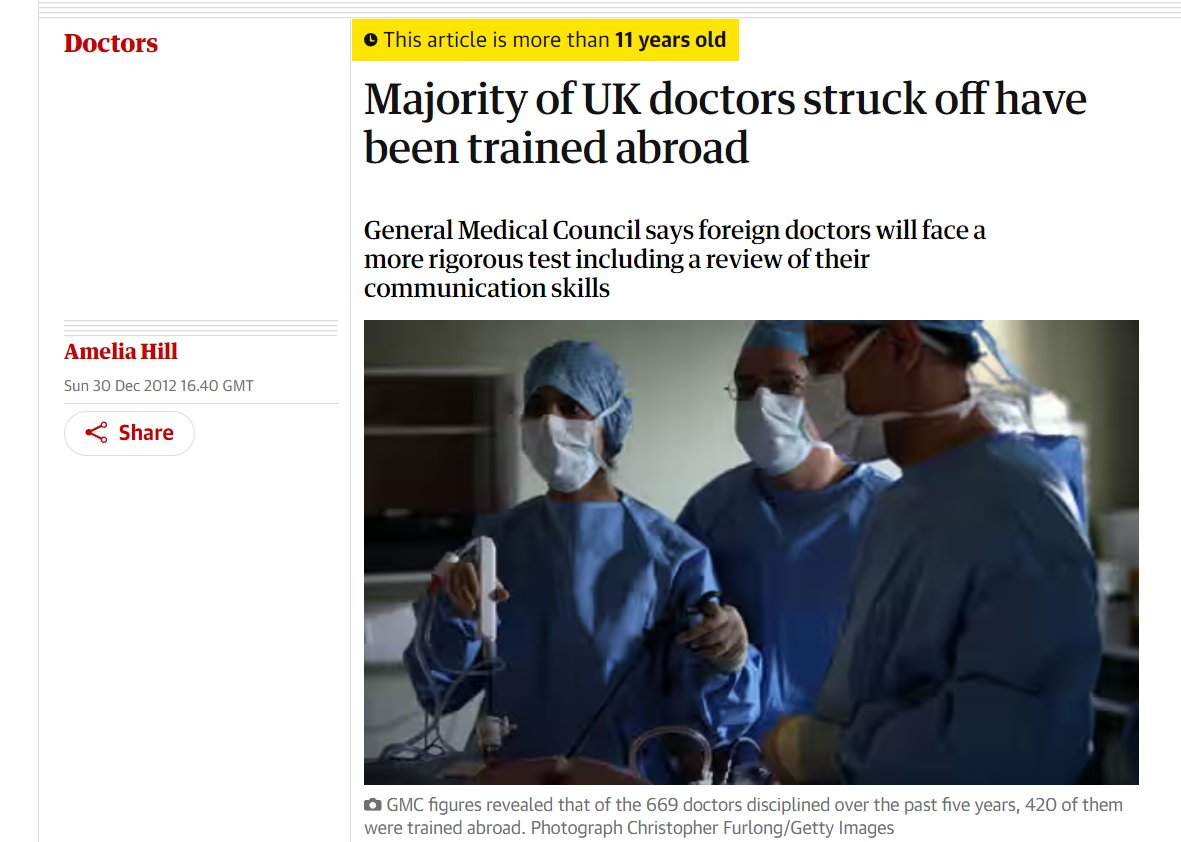
23/ This policy also compromises the quality of our NHS.
Most UK doctors who are struck off were trained abroad.
You can review the latest malpractice cases here - so far this month, 80% have foreign backgrounds.
mpts-uk.org/hearings-and-d…
Most UK doctors who are struck off were trained abroad.
You can review the latest malpractice cases here - so far this month, 80% have foreign backgrounds.
mpts-uk.org/hearings-and-d…
24/ Last year, only 2.6% of immigrants arrived via the Health and Social Care Visa route.
This proportionate to the amount of current working age population in the UK that are registered as a doctor or nurse
This proportionate to the amount of current working age population in the UK that are registered as a doctor or nurse
https://x.com/BernoulliDefect/status/1821908015324291282
25/ To conclude, mass-immigration makes the UK more dangerous, poorer, and isn't necessary to keep the NHS.
It's revealing that, despite selective data and misrepresentation, they struggle to find any positive effects and at best can claim immigration is neutral.
It's revealing that, despite selective data and misrepresentation, they struggle to find any positive effects and at best can claim immigration is neutral.
• • •
Missing some Tweet in this thread? You can try to
force a refresh