#Gold's bull run is once again kicking miners into high gear to expand the supply.
Note #Bitcoin is the only asset that is inelastic to demand which makes it unique.
What I find interesting is that this chart is printing higher lows as technology gets better. IMO this chart will breakout in the 2030s and we'll see much more gold enter the market.
Gold production has been in consolidation since 2015, but the exponential climb in tech and new demand is ready to move gold production to the next level.
• • •
Missing some Tweet in this thread? You can try to
force a refresh
I have some good news and [maybe] some bad news for you.
GOOD NEWS: Risk SIgnal is trending downwards, meaning over the broader environment buy-side liquidity is dominating. We are setting up for another solid run on the long time frame.
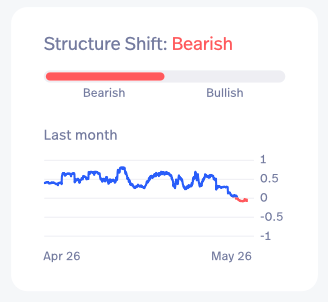
However the strength of this bullish run from 75k->112k is starting to break down, I covered this in my last post.
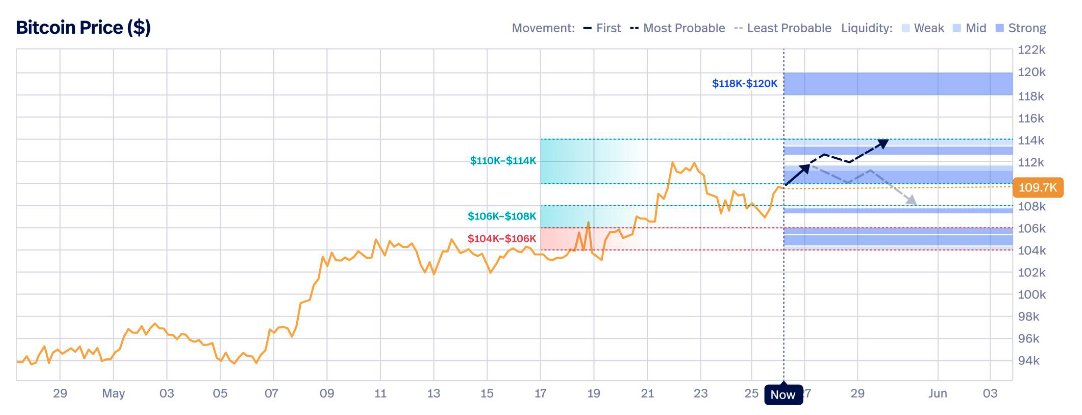
This week is absolutely critical, if we do not get follow through, then we will be up for another consolidation period.
Chart courtesy of @swissblock__'s framework which powers @bitcoinvector - any institution, hedge fund or pubco which touches global macro, BTC or alt-coins should be subscribed to @bitcoinvector because it's absolutely the highest quality battle tested quant framework available for BTC that has stood the test of time over multiple cycles carrying significant capital and the introductory pricing is a steal.
In the short term my main concern are the late comer speculators taking long positions while an immense amount of potential profit taking is ready to dump (SOPR).
This week's spot buying will strongly influence the next 1-2 months of price action. We are in a pivot zone.
Exactly 3 years ago I shut down a business making me millions per year.
Here's a 🧵on how it started, why I shut it down and why I'm helping to build something better for this industry.
The idea was simple: help plebs navigate the markets.
On-chain signals was still a new thing, I was very early in this field.
That's the cool thing about BTC... the sea of transactions on the network is public, with smarts you can figure out which way the price may go.
The Bitcoin Forecast launched Oct 2020 on Substack and grew quickly.
Substack reached out to me going "whoa, you're not doing anything like what we normally see in top writers and your readership per letter is way beyond anything we've seen"
BTC fundamentals have turned bullish, not a bad setup to break all time highs.
I took a break from X to enjoy the NZ summer but every week I put out a series of analysis to my subscribers (this is a hobby, NOT a long term project).
Thought I'd post this update publicly.
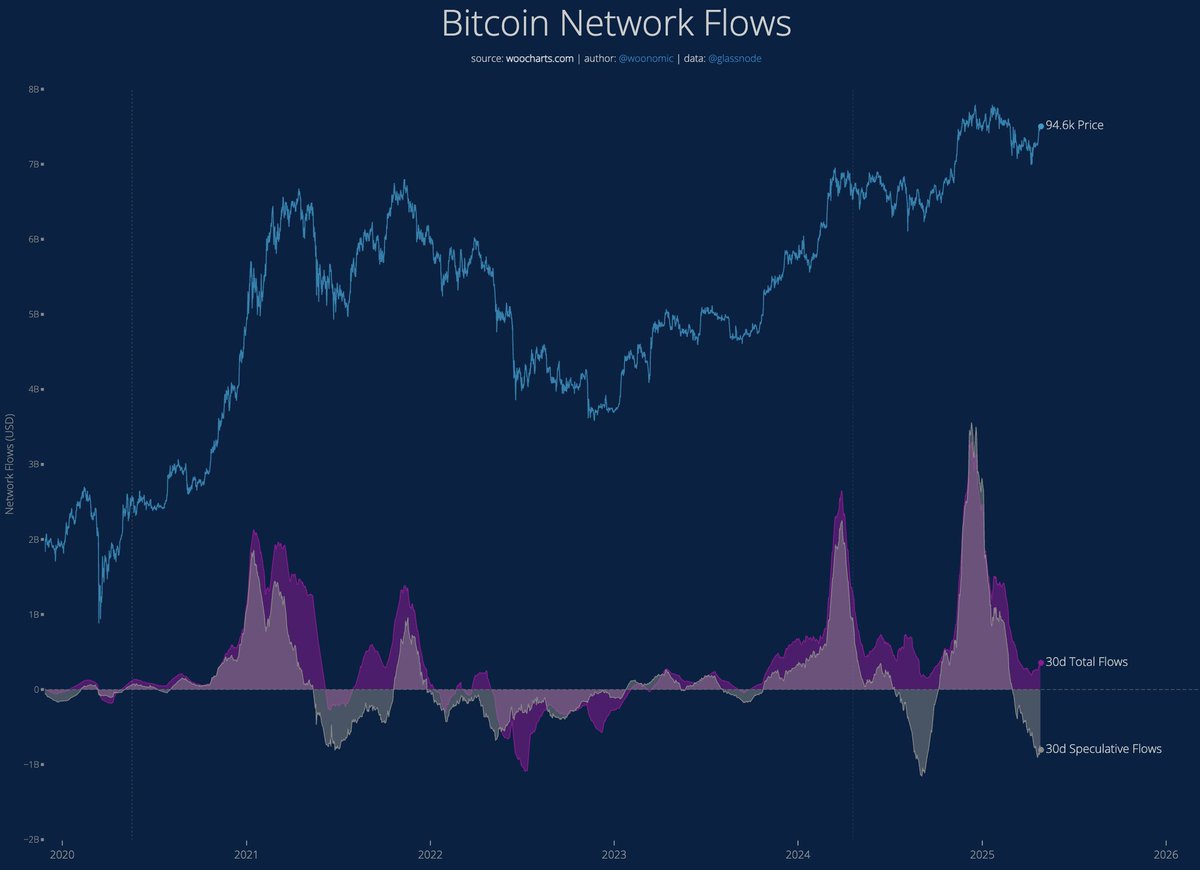
Capital flows into the network are ramping up.
Both total and speculative flows have bottomed, when both align they join forces to make a bullish environment anchored in fundamentals.
Our Risk Model has started its trend back down. This means liquidity has returned to the market.
Downside pull backs will be muted in this enviroment.
How can $MSTR possibly trade at 2.7x their BTC treasury?
I suspect we are seeing the start of $5-10b of inflows in anticipation of a SP500 listing right now.
If true, then it's still warming up.
Consider 20-30% of the SP500's $50T marketcap comes from passive index tracking funds and ETFs.
Inclusion into the SP500 means MSTR gets a chunk of that money.
Inflow estimates:
$10-15b from passive index tracker funds
$5-10b additional from speculative inflows
When would it happen?
FASB accounting practices go live for MSTR on 1st Jan 2025, that's a prerequisite before a listing can take place. After that MSTR will meet most of the requirements, with the last requirement being a committee decision.