Decoding OHLC/OLHC: Candle Anatomy
By the end of this thread, you will understand the anatomy of candles and how to 𝗳𝘂𝗹𝗹𝘆 𝗰𝗮𝗽𝗶𝘁𝗮𝗹𝗶𝘇𝗲 on OHLC/OLHC.
A Thread 🧵
By the end of this thread, you will understand the anatomy of candles and how to 𝗳𝘂𝗹𝗹𝘆 𝗰𝗮𝗽𝗶𝘁𝗮𝗹𝗶𝘇𝗲 on OHLC/OLHC.
A Thread 🧵
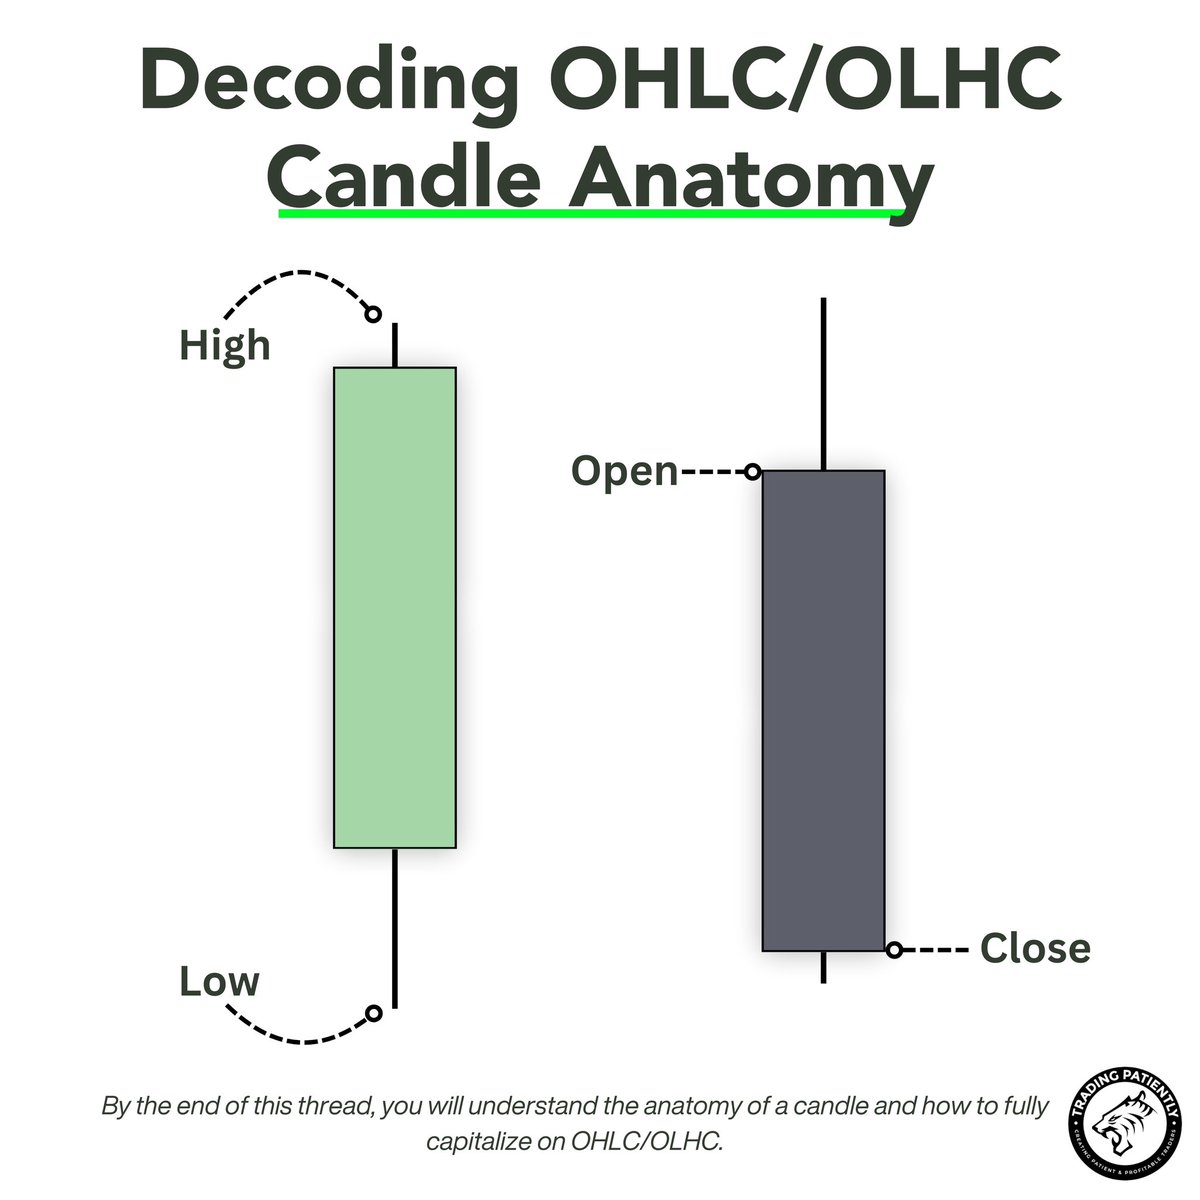
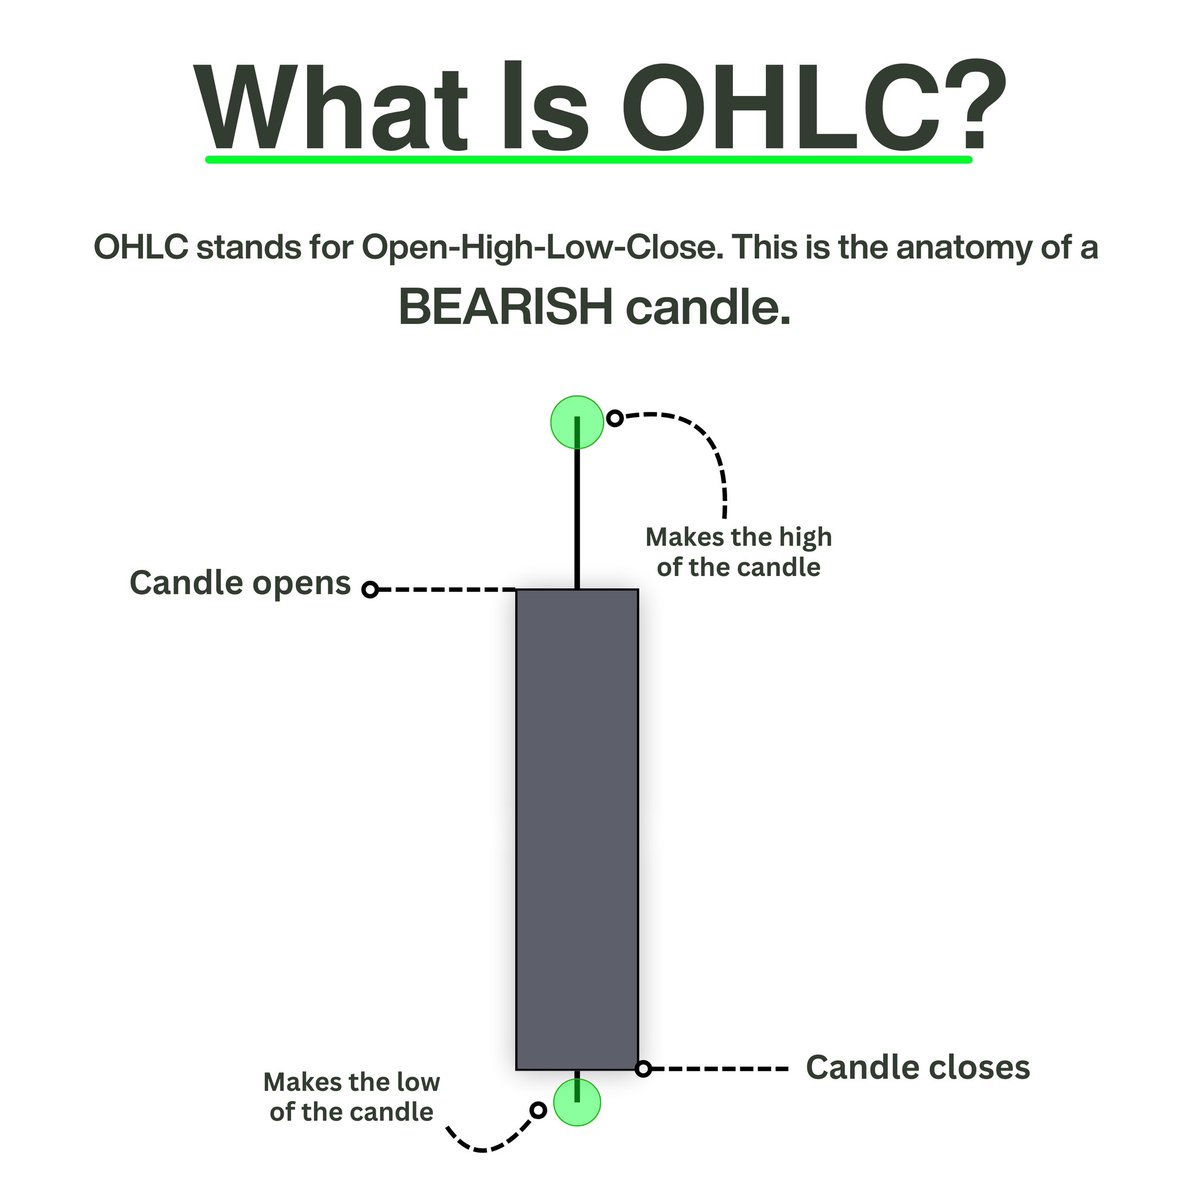
𝗪𝗵𝗮𝘁 𝗜𝘀 𝗢𝗛𝗟𝗖?
OHLC stands for Open-High-Low-Close. This is the anatomy of a BEARISH candle. A bearish candle opens, makes the high of the candle, expands making the low of the candle and then closes.
OHLC stands for Open-High-Low-Close. This is the anatomy of a BEARISH candle. A bearish candle opens, makes the high of the candle, expands making the low of the candle and then closes.
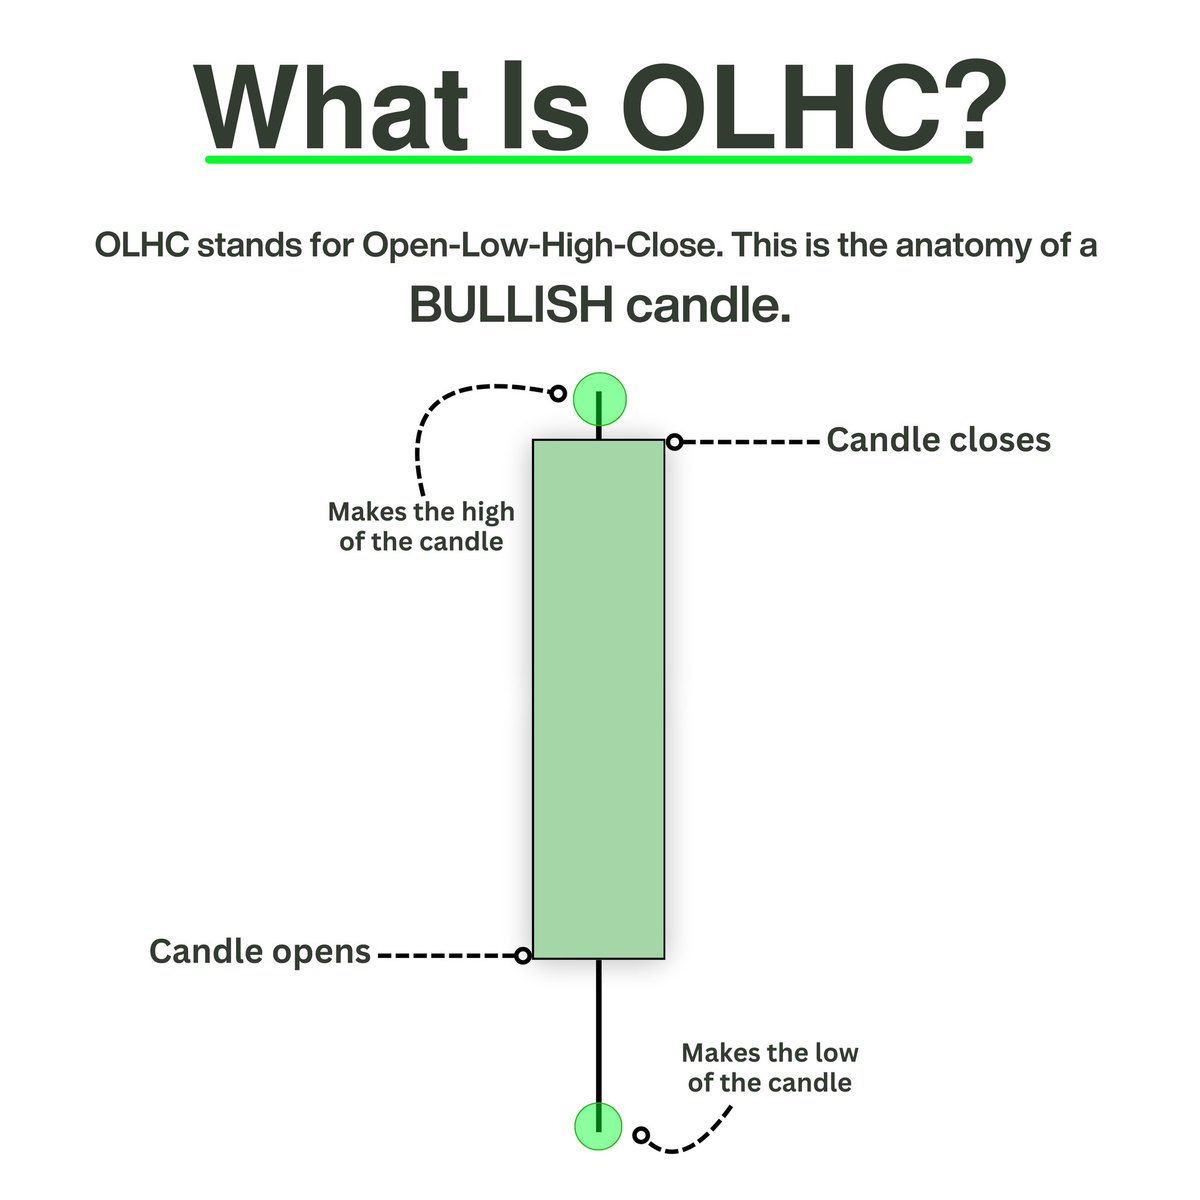
𝗪𝗵𝗮𝘁 𝗜𝘀 𝗢𝗟𝗛𝗖?
OLHC stands for Open-Low-High-Close. This is the anatomy of a BULLISH candle. A bullish candle opens, create the low of the candle, expands making the high of the candle and then closes.
OLHC stands for Open-Low-High-Close. This is the anatomy of a BULLISH candle. A bullish candle opens, create the low of the candle, expands making the high of the candle and then closes.
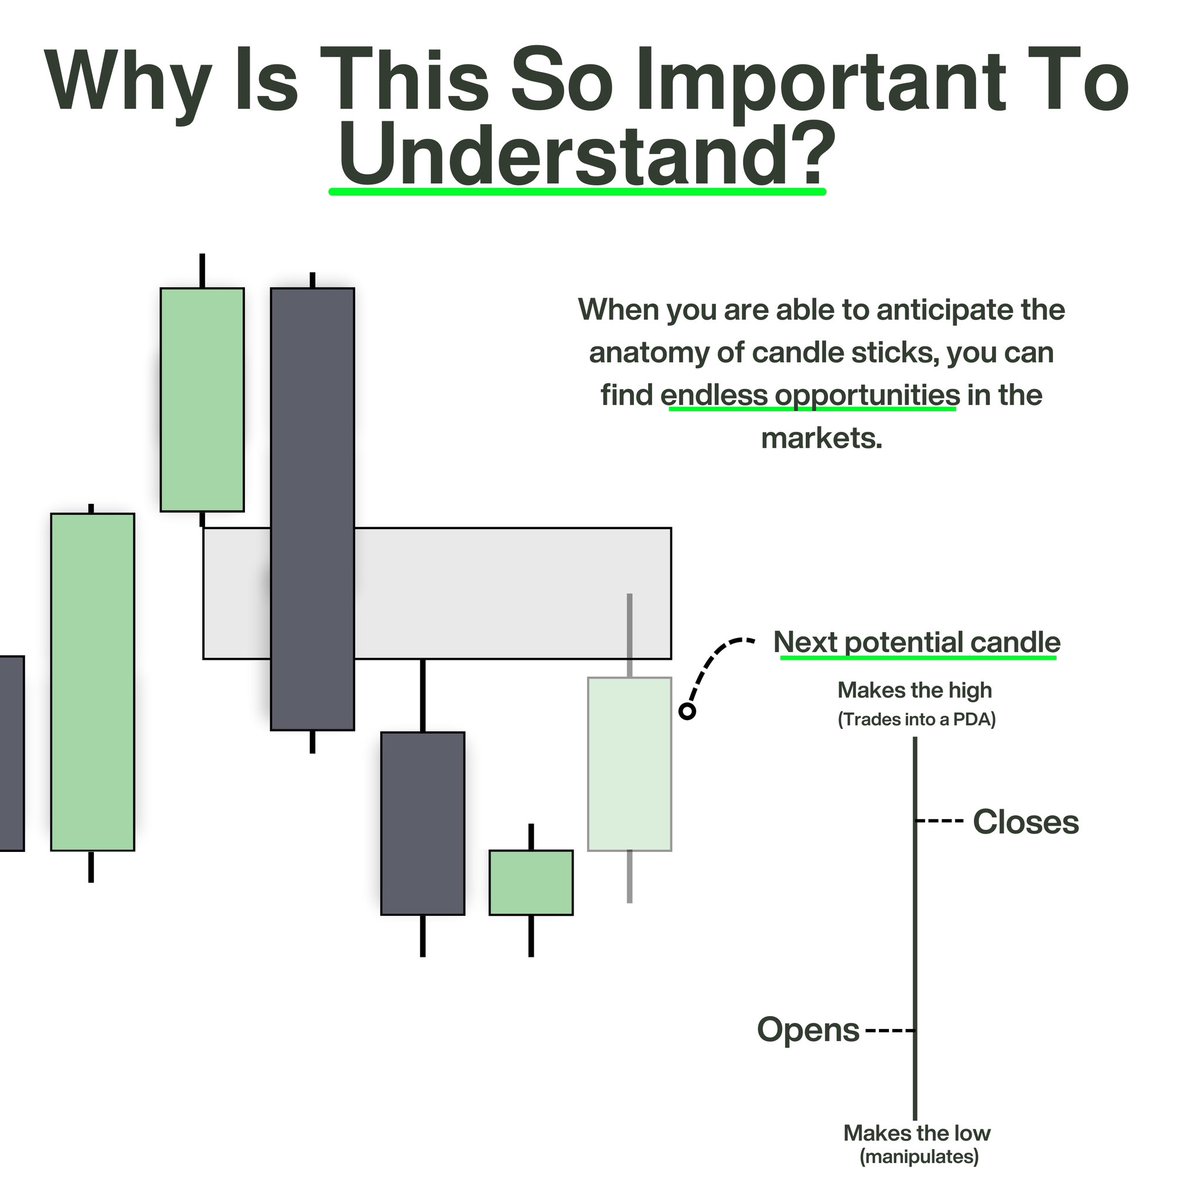
𝗪𝗵𝘆 𝗜𝘀 𝗧𝗵𝗶𝘀 𝗦𝗼 𝗜𝗺𝗽𝗼𝗿𝘁𝗮𝗻𝘁 𝗧𝗼 𝗨𝗻𝗱𝗲𝗿𝘀𝘁𝗮𝗻𝗱?
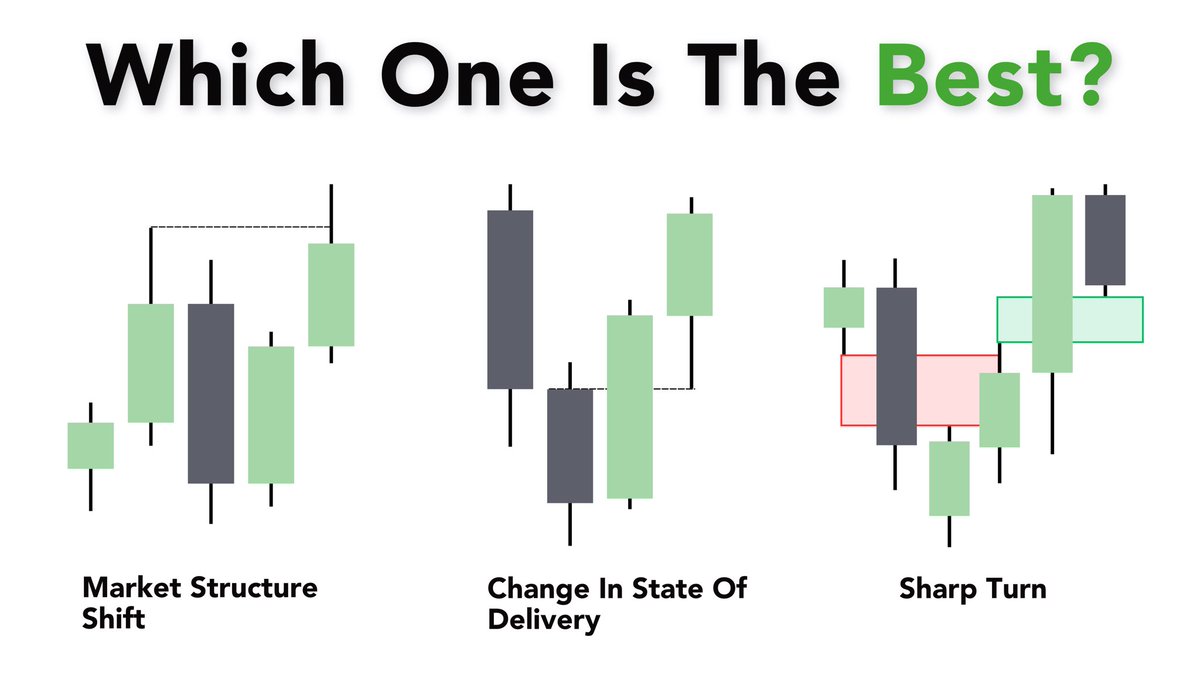
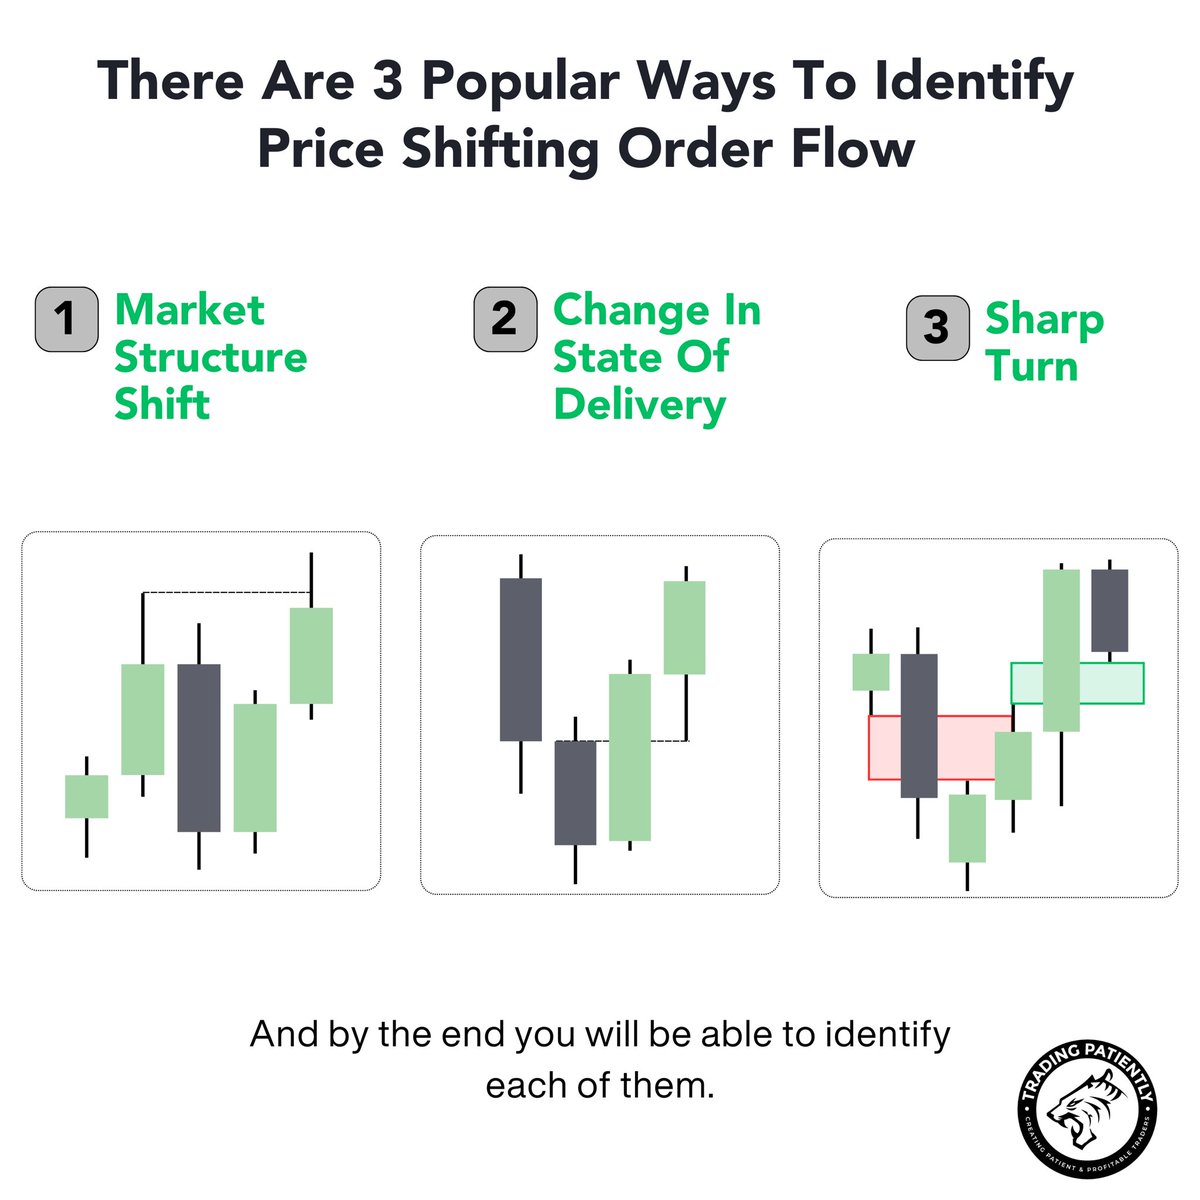
When you are able to anticipate the anatomy of candle sticks, you can find endless opportunities in the markets.
When you are able to anticipate the anatomy of candle sticks, you can find endless opportunities in the markets.
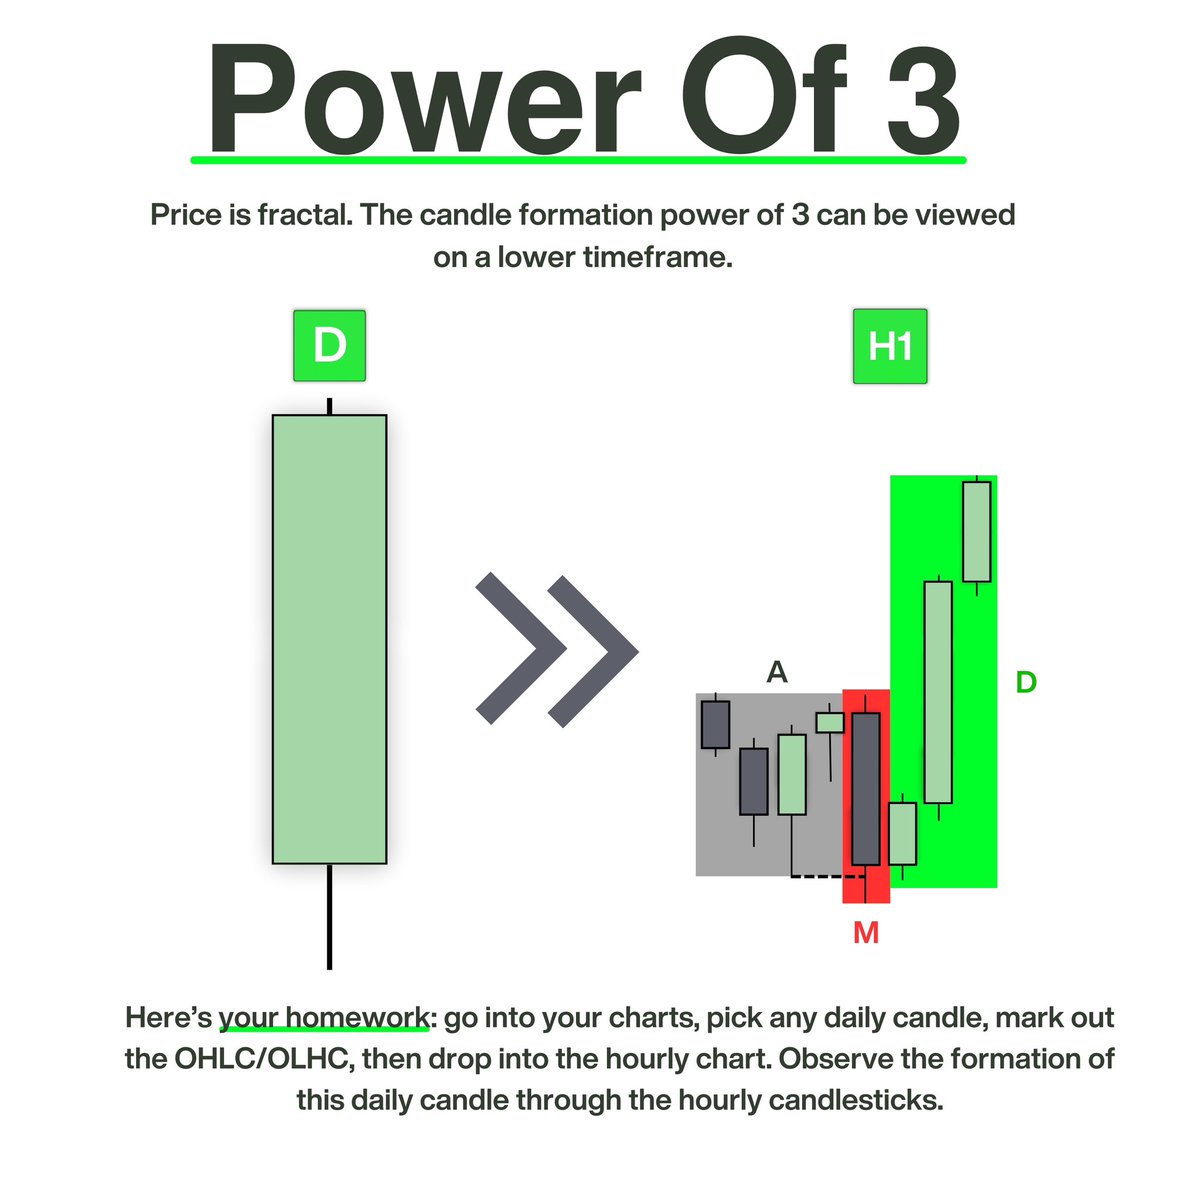
𝗣𝗼𝘄𝗲𝗿 𝗢𝗳 𝟯
Price is fractal. Once you see it you won’t unsee it.
Here’s your homework: go into your charts, pick any daily candle, mark out the OHLC/OLHC, then drop into the hourly chart. Observe the formation of this daily candle through the hourly candle sticks.
Price is fractal. Once you see it you won’t unsee it.
Here’s your homework: go into your charts, pick any daily candle, mark out the OHLC/OLHC, then drop into the hourly chart. Observe the formation of this daily candle through the hourly candle sticks.
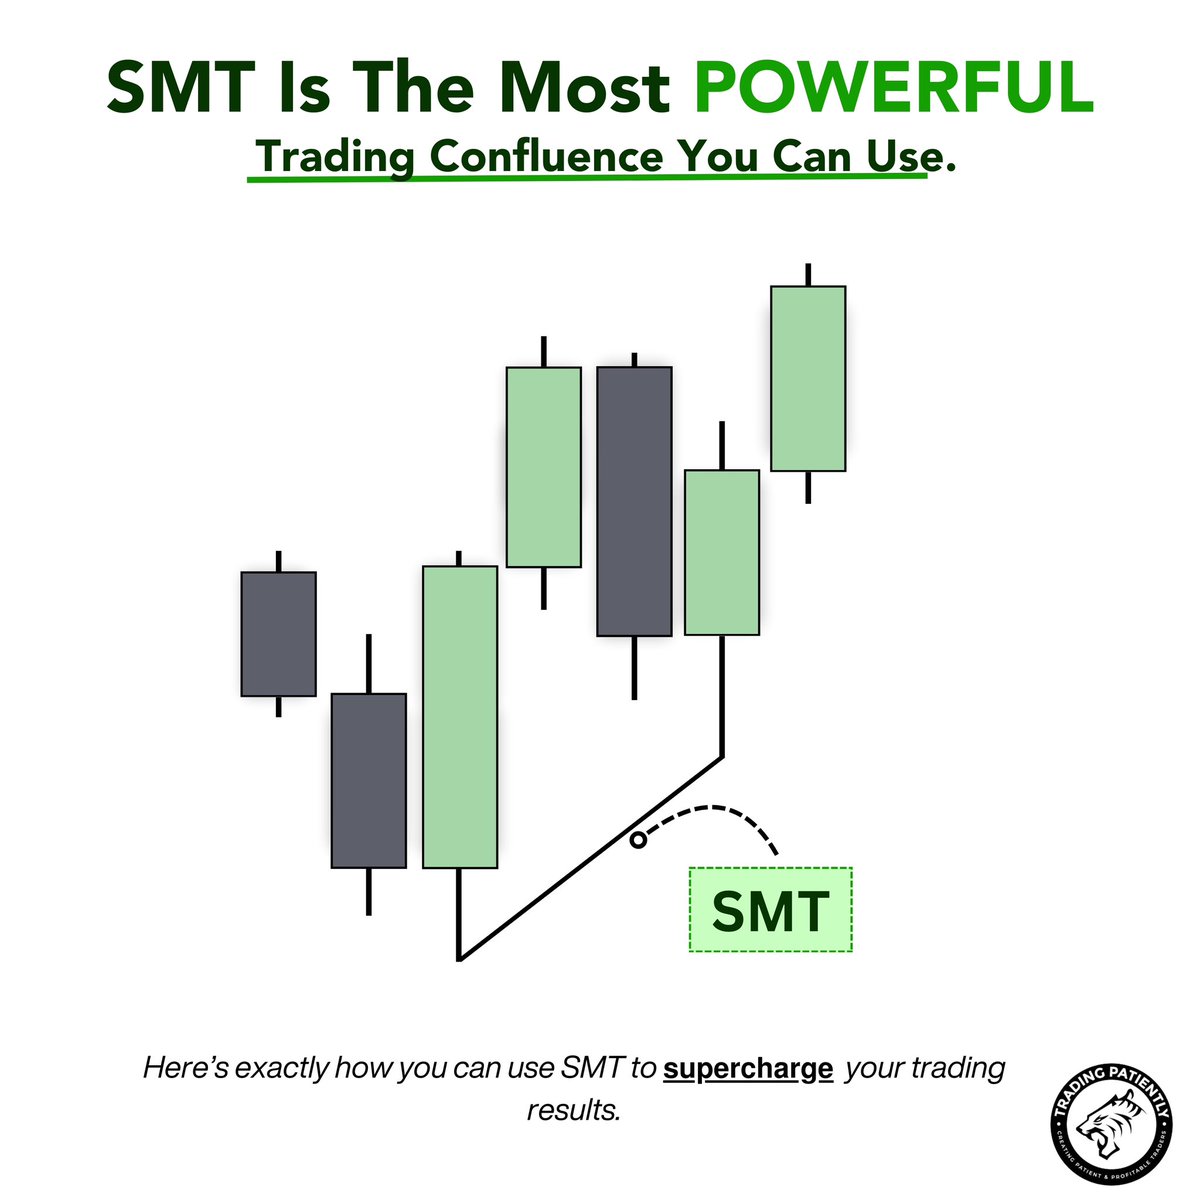
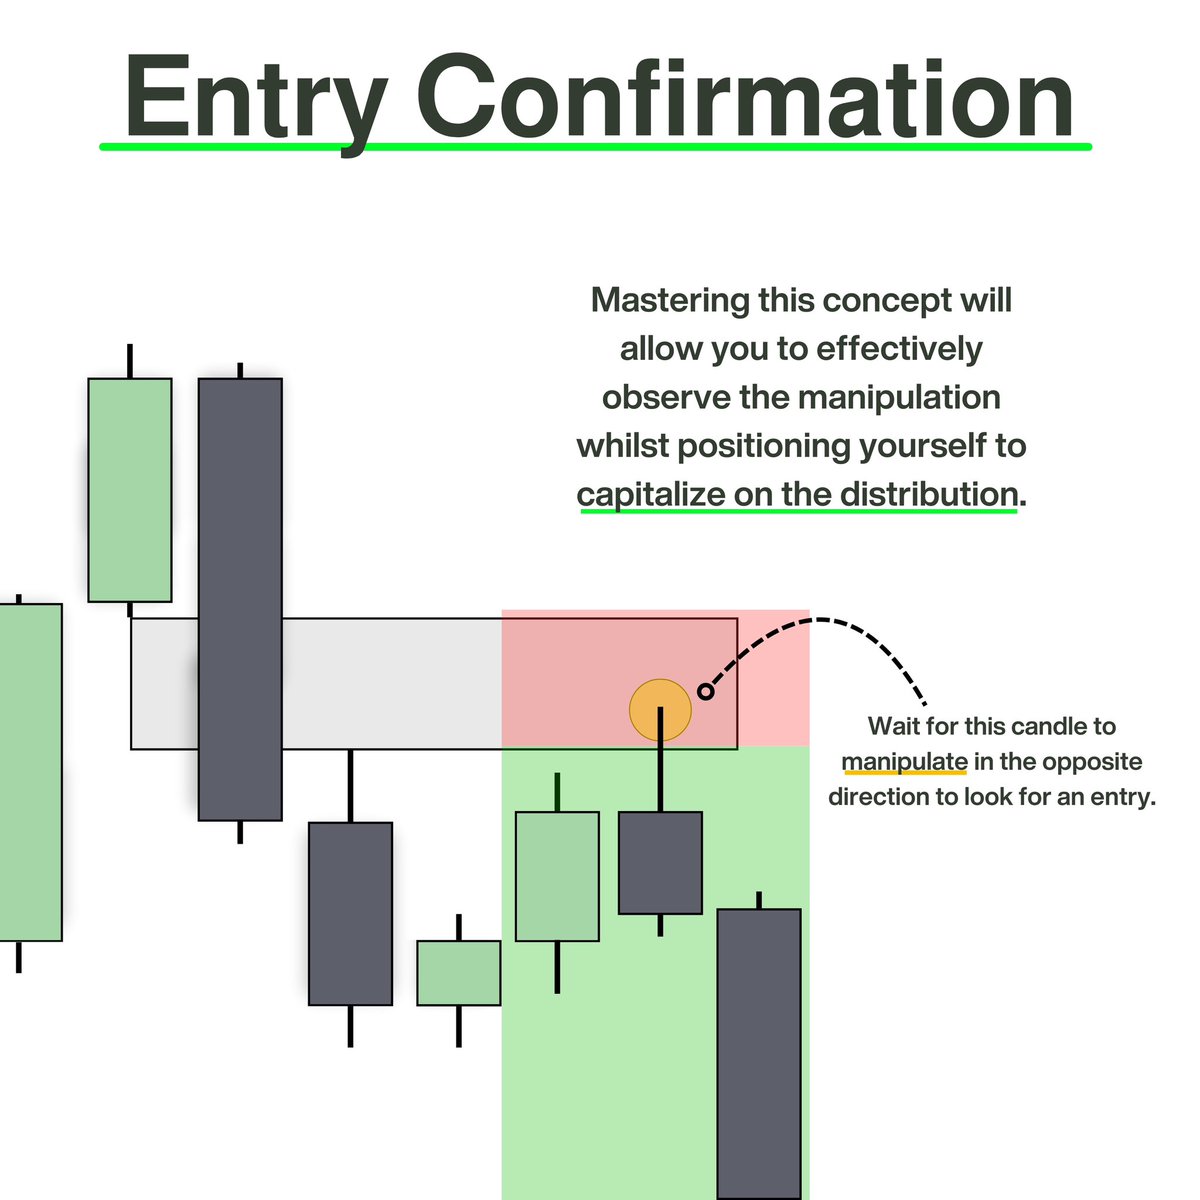
𝗘𝗻𝘁𝗿𝘆 𝗖𝗼𝗻𝗳𝗶𝗿𝗺𝗮𝘁𝗶𝗼𝗻
Mastering this concept will allow you to effectively observe the manipulation whilst positioning yourself to capitalize on the distribution.
Mastering this concept will allow you to effectively observe the manipulation whilst positioning yourself to capitalize on the distribution.
𝗧𝘂𝗿𝘁𝗹𝗲 𝗦𝗼𝘂𝗽
This is a liquidity grab that occurs during OHLC/OLHC. The candle manipulates lower, sweeping the swing low, before distributing in its intended direction.
This is a liquidity grab that occurs during OHLC/OLHC. The candle manipulates lower, sweeping the swing low, before distributing in its intended direction.

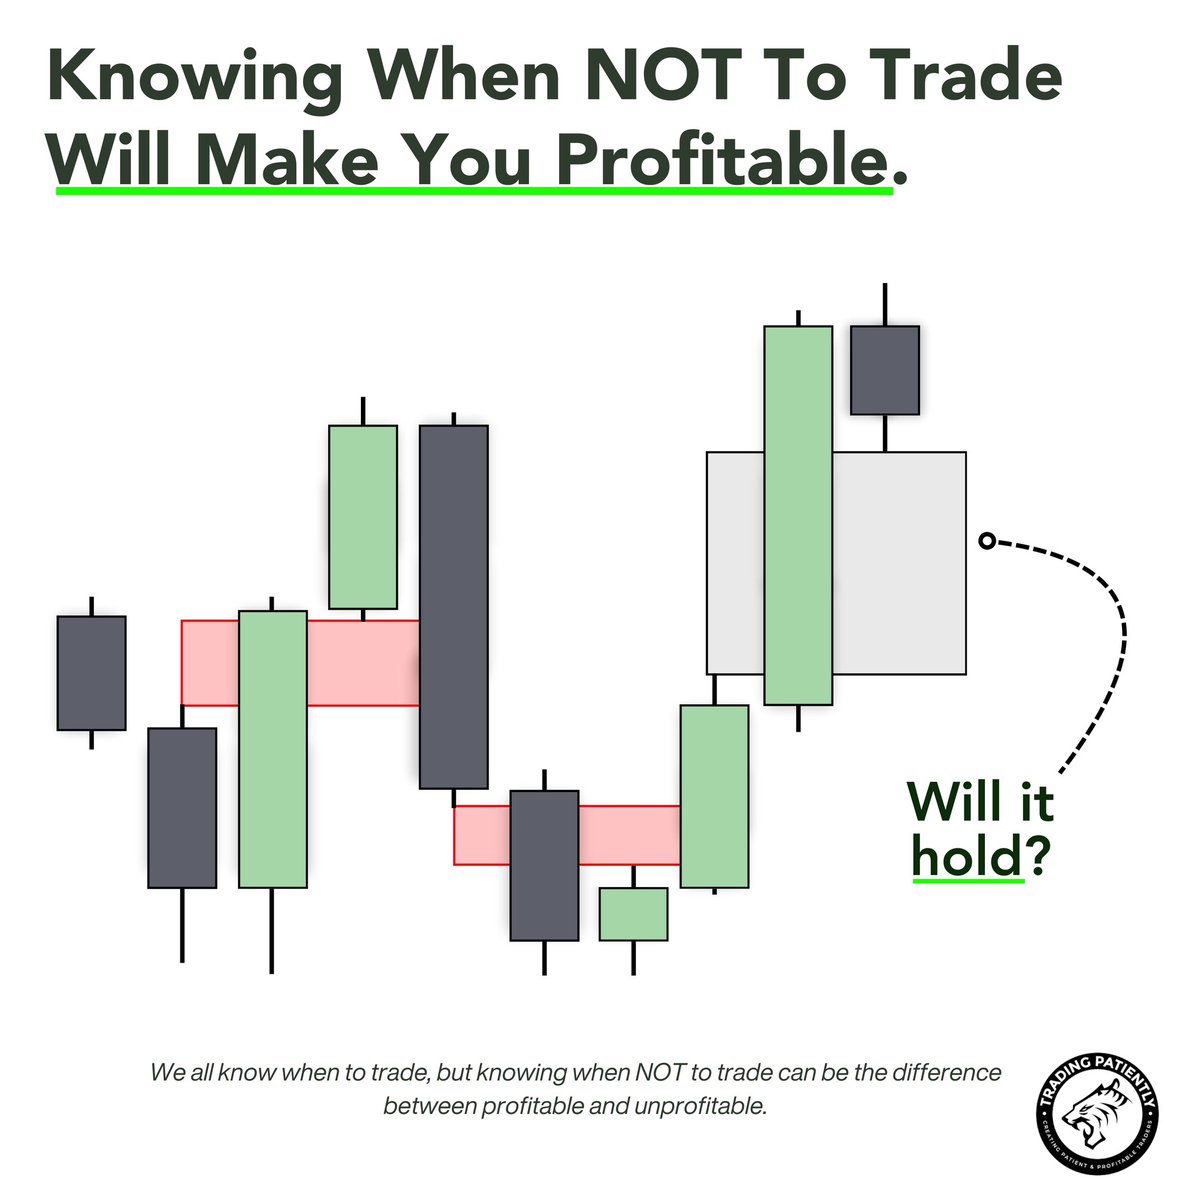
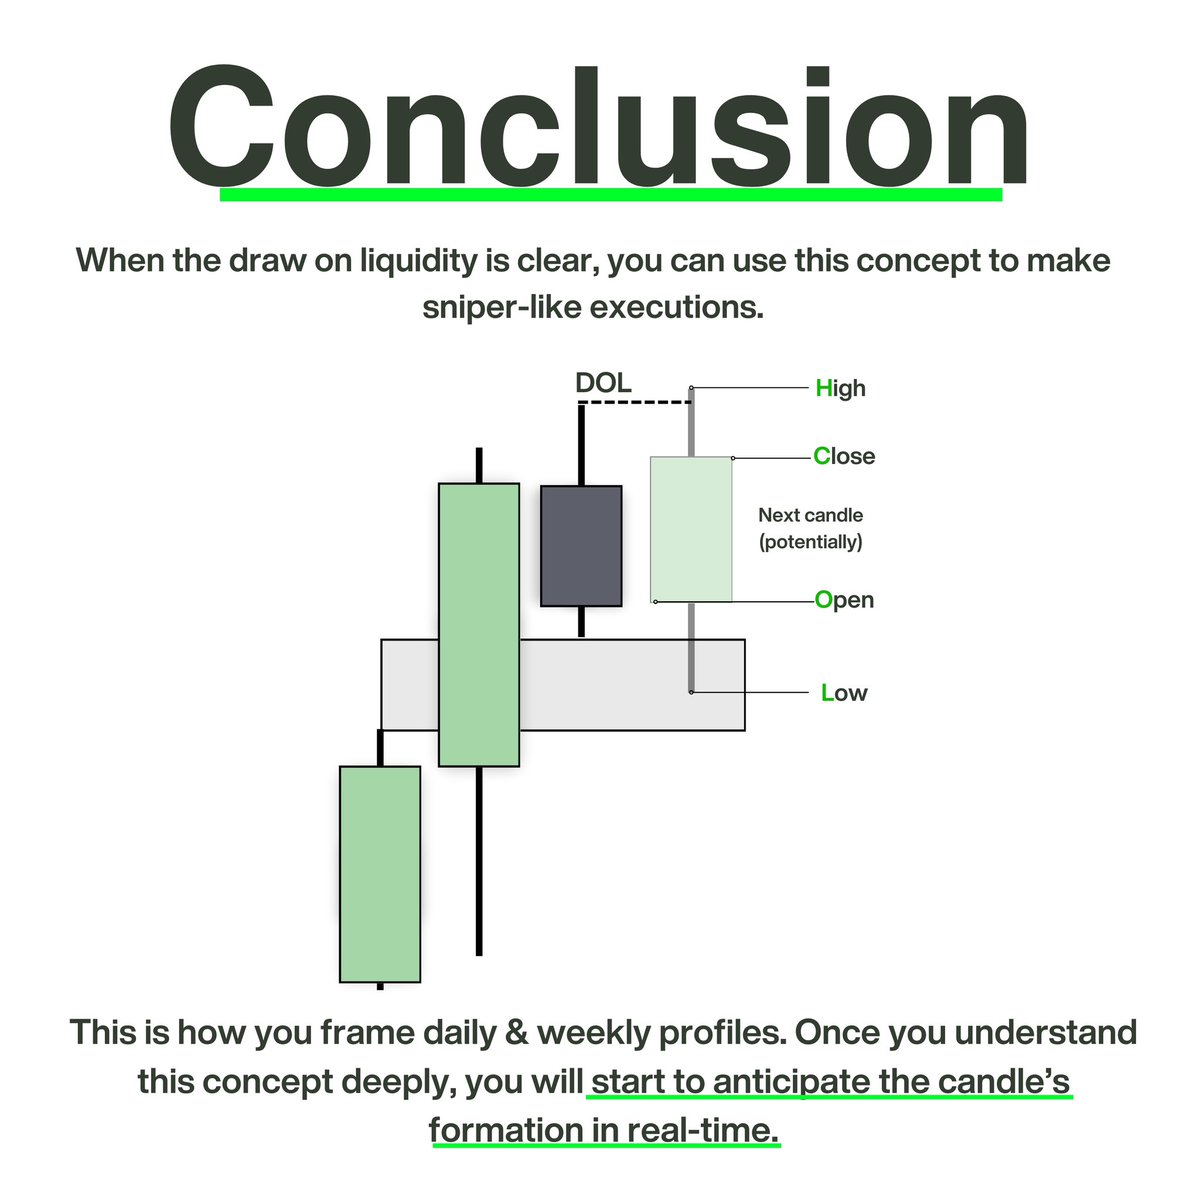
𝗖𝗼𝗻𝗰𝗹𝘂𝘀𝗶𝗼𝗻
When the draw on liquidity is clear, you can use this concept to make sniper-like executions.
This is how you frame daily & weekly profiles. Once you understand this concept deeply, you will start to anticipate the candle’s formation in real-time.
When the draw on liquidity is clear, you can use this concept to make sniper-like executions.
This is how you frame daily & weekly profiles. Once you understand this concept deeply, you will start to anticipate the candle’s formation in real-time.
Ready to elevate your trading? 🚀
Receive direct access to me & free educational resources here:
↓ ↓ ↓ ↓ ↓
tradingpatiently.com
Receive direct access to me & free educational resources here:
↓ ↓ ↓ ↓ ↓
tradingpatiently.com

• • •
Missing some Tweet in this thread? You can try to
force a refresh