Dr. Lyne Filiatrault Profile picture
Sep 10, 2024 8 tweets 3 min read Read on X
Today I listened to the presentation of this RECOVER Study published in JAMA:
Recording will be available in ~2 weeks:

A few slides stood out for me. jamanetwork.com/journals/jama/…
recovercovid.org/r3-seminar-ser…
Slide from recoverCOVID.org Characterizing Long COVID in Children and Adolescents: First Main Analysis of the RECOVER-Pediatrics Observational Cohort Study.
First off, we can debate the prevalence but one thing is clear even at the lower end, LC in children & adolescents is not a rare disease. Prevalence of Long COVID in children • Early reports suggest that 4 to 58% of infected children have persistent symptoms • More recent meta-analyses • High variability in terms of prevalence (2 to 70%) Pellegrino R. Eur J Pediatr. 2022 • Prevalence of Long COVID was 25.2% Lopez-Leon S et al. Sci Rep. 2022 • Prevalence of pediatric Long COVID at 90 days post infection to be 2% to 5%. Funk et al, JAMA Open Network, 2022 Even at the low end 2 to 10%: 1.4 million children in the United States • If 10% of 65 million with positive antibodies: >6 million A disease considered rare when it affects <...
As usual in medicine, kids are not small adults. Slide from recoverCOVID.org  Most of what we know about Long COVID is from adults When it comes to Long COVID in children, there are more questions than answers. • Early misconception: children and adolescents don't get COVID-19 Current misconception: children and adolescents don't get Long COVID - or if they do, their symptoms are the same as adults >>>Under-recognition Image is that of a baby followed by a child, a young adolescent with a backpack to an adult women.
Note the brain is affected. And no, it's not from the "lockdowns" or the stress of the pandemic. They had a control group for both the School-Age Children and the Adolescents. Slide from recoverCOVID.org Image shows the  most common symptoms of LC in children (6-11) vs  adolescents (12 to 17).  The image shows a child and an adolescents with in the middle the common symptoms to both. More common in children were symptoms of LC affecting feelings and behaviour, heart and lung and the skin, hair and nails. While for adolescents, more common symptoms were different feelings and behaviour and symptoms affecting ears, eyes, nose and throat.
Behind every number is a story of a child or adolescent and their family. Slide from recoverCOVID.org The Impact of Long COVID on Families "My daughter had COVID in December 2022, and months later she is really struggling. She has been out of school for 6 weeks with debilitating fatigue, pain, and brain fog, none of which show any sign of letting up... All in all, COVID has been a devastatingly difficult journey for my family, and it's not one I wish on anyone."
The patient and family advocate and RECOVER Representative, Megan Carmilani, Founder and President of @LongCovidFam was fabulous.
She clearly made the case for accommodations in schools and greater flexibility for teaching children with Long COVID, and other disabilities.
I always struggle with research that uncovers harms and yet, the next step is not taken.
A bit like logic: "If this then what?"
"This" is already looking bad, should we not take the next step beyond "Raising Awareness". recoverCOVID.org Next Steps in understanding Long COVID in children • Characterize Long COVID in young children (birth to 5 years) •Determine the underlying mechanism and pathophysiology behind symptoms and across ages • Identify targets for therapeutics/clinical trials in children Raise awareness that Long COVID in children is a public health crisis • Long COVID in children will have substantial impacts for decades to come

• • •

Missing some Tweet in this thread? You can try to force a refresh
 

Keep Current with Dr. Lyne Filiatrault

Dr. Lyne Filiatrault Profile picture

Stay in touch and get notified when new unrolls are available from this author!

Read all threads

This Thread may be Removed Anytime!

PDF

Twitter may remove this content at anytime! Save it as PDF for later use!

Try unrolling a thread yourself!

how to unroll video
  1. Follow @ThreadReaderApp to mention us!

  2. From a Twitter thread mention us with a keyword "unroll"
@threadreaderapp unroll

Practice here first or read more on our help page!

More from @DrFiliatrault

Apr 8
Looking back at hospital admissions with Viral Resp. Infections to understand: "sick all the time"
Weekly admissions to 78 🇨🇦hospitals in 10 provinces & 1 territory participating in VRI Nosocomial Infection Surveillance Program
All Ages up to 29-03-2025
health-infobase.canada.ca/cnisp/viral-re…Graph of weekly incidence of patients hospitalized with Viral Respiratory Infection per 1,000 patient admissions for All ages. Shows COVID-19 admissions in Red, RSV admissions in Blue and Influenza A admissions in Yellow. Influenza A admissions have peaked above last years admissions and are on the way down. Influenza B admissions, light Blue is rising but at a very low level still. Data is up to and including the week of 23-03-2025.
Looking at the same data for Adults only.
Spring-Summer-Fall #Covid
Influenza season was late with admissions peaking higher than last year. Graph of weekly incidence of patients hospitalized with Viral Respiratory Infection per 1,000 patient admissions for Adults 18 years and over. Shows COVID-19 admissions in Red, RSV admissions in Blue and Influenza A admissions in Yellow. Influenza A admissions have peaked above last years admissions and are on the way down. Influenza B admissions, light Blue is rising but at a very low level still. Data is up to and including the week of 23-03-2025.
Same data for pediatrics. Mind the change in scale on y axis. Shows you how much RSV drives admissions in children.
Remember @BCCDC refused to fund #RSV vax for high risk seniors.
@BCCDC refused to broadly roll out new long acting monoclonal Ab for at risk neonates & children Graph of weekly incidence of patients hospitalized with Viral Respiratory Infection per 1,000 patient admissions for less than 18 years old. Shows COVID-19 admissions in Red, RSV admissions in Blue and Influenza A admissions in Yellow. RSV admissions have peaked higher than last year. RSV admissions in pediatrics are at a much higher level than influenza and Covid admissions. Influenza A admissions have peaked above last years admissions and are on the way down. Influenza B admissions, light Blue is rising but at a very low level still. Data is up to and including the week of 23-03-2025.
Read 11 tweets
Mar 16
Attended #LongCovidAwarenessDay2025 at Vancouver Art Gallery.
Did not see Dr. Bonnie Henry nor other public health leaders
Did not see anyone from @CDCofBC
Did not see BC premier @Dave_Eby
Did not see BC Health Minister @Josie_Osborne nor any other political parties.
#bcpoli Slide title: International Long Covid Awareness Day 5 Years of Long Covid Cure Long Covid Now Saturday March 15th 2025 Raise Awareness with Us Toronto-Quebec City- Vancouver
Luckily public came to show support for 3.5 million Canadians with Long Covid. (June 2023 Stats Can)
3.5 million is not the true number. No one is counting. That's intentional, part of the "what you don't know, don't see, can't hurt you."
Except #LongCovid can & it will hurt you 2 hearts made of the pillowcases of people with Long Covid with their stories written on. Text between the two hearts reads, Let's make long Covid so visible it can't be ignored.
Dr. Henry @CDCofBC @Josie_Osborne @Dave_Eby and other #bcpoli this is what you would have seen, had you been there to support #LongCovidAwarenessDay2025 Photo of the steps outside the Vancouver Art Gallery covered in pillowcases and with a banner reading 3.5 Million Canadians Cure Long Covid. 2 people reading the writing on the pillowcases which represents a person with Long Covid's new reality.
Read 22 tweets
Dec 20, 2024
Not just in Alberta, also happening in BC.
RSV tests positivity rate in Canada sits at 9.5%
for the week ending Dec. 14, 2024
health-infobase.canada.ca/respiratory-vi…Geographic trends across Canada in percentage of tests positive for RSV for week ending December 14, 2024. BC and AB are neck and neck at 10%, Quebec leads at 12.6%. The average test positivity rate now for RSV in Canada is 9.5%
AB is lumped in "Prairies" with SK & MB.
Week 50 (2024-12-24) Prairies Percentage test positivity: 8% for SARS-CoV-2, 7.5% for Influenza, 10.6% for RSV
Canada: 10% for SARS-CoV-2, 4.4% for Influenza and 9.5% test positivity for RSV
See BC ⬇️
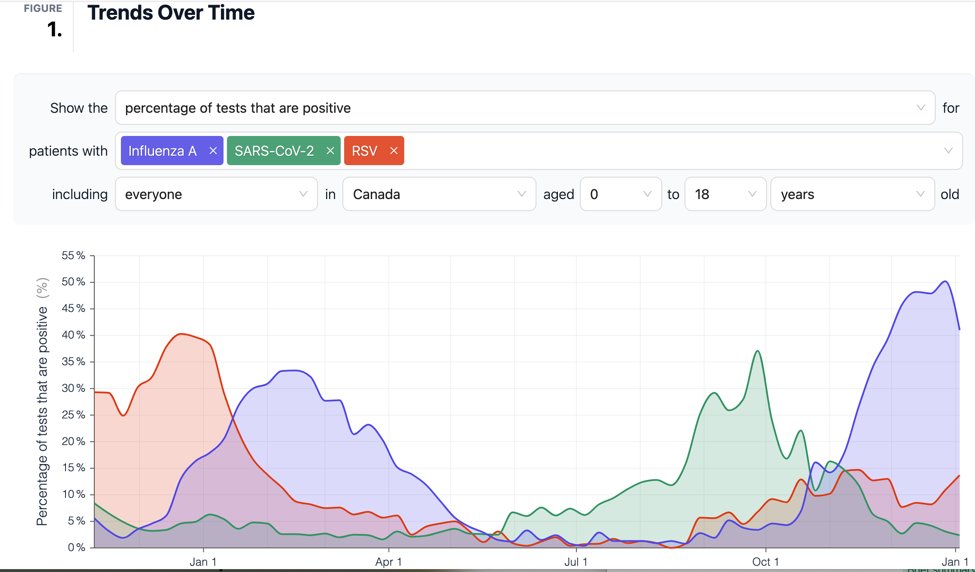
health-infobase.canada.ca/respiratory-vi…Percentage of tests positive for SARS-CoV-2, RSV and Influenza for Canada and provinces and territories ending on December 14, 2024. Graphs shown for Canada, BC and the Prairies.
Read 11 tweets
Sep 27, 2024
Seems like the BC CDC is resuming weekly reporting.
Several changes have been introduced to their various dashboards.
bccdc.ca/health-profess…
Virus in circulation in BC now in the adult population.
These do not represent number of cases.
Data up to Sept. 21, 2024
bccdc.shinyapps.io/respiratory_pa…
Number of positive samples by virus in BC: All ages. Clearly shows Covid is most prevalent and positive samples are rising.   Then comes  Entero/Rhinovirus, positive samples are also trending up and in 3rd place is influenza. Data is up to September 21, 2024.
Anyone who says SARS-CoV-2 is becoming seasonal should be shown this graph from August 27, 2023 to September 21, 2024.
@CDCofBC paused the weekly Covid-19 Situation Report stopped on May 2, because the respiratory season was apparently over. Really?
bccdc.shinyapps.io/respiratory_pa…
Number of positive samples for SARS-CoV-2 from August 27, 2023 to  September 21, 2024. Fairly steady state with a peak in September to October 2023. Lowest levels were for 3 weeks in April 2024.
Read 5 tweets
Mar 7, 2024
By refusing to accept that SARS-CoV-2 spreads through aerosols, all 🇨🇦public health officials put children & educators [and their families & communities] at risk of repeated COVID infections, and now measles in schools.
What's next, TB?
By doubling down on droplet spread of SARS2, 🇨🇦public health officials have prevented improvements to schools' indoor air quality, that would have also helped against measles.
Instead in 2024, in 🇨🇦, the public is told by public health to wash their hands. It's a disgrace! BC CDC poster on Hand Hygiene to protect against Coronavirus COVID-19. Photographed recently in washroom at dental office in BC.
People need to listen to the "real experts", people like Prof. Linsey Marr, an environmental engineer examining indoor & outdoor air quality & airborne pathogens that affect human health. Working at the intersection of atmospheric science, public health, & infectious disease. IBEC presentation slide: New Recommendations for Ventilation in Buildings Image of Linsey C. Marr University Distinguished Professor  Charles P. Lunsford Professor Civil and Environmental Engineering Virginia Tech February 2024
Read 13 tweets
Dec 12, 2023
Alerte: Mésinformation!
@LP_LaPresseici.radio-canada.ca/info/videos/1-…
Dr. KW : « la pandémie est définitivement finie »
Vrai ou Faux?
Faux! Voir le graphique ci-dessous.
Source: inspq.qc.ca/covid-19/donne…
Image
Dr. KW : « Covid, c’est devenu un virus respiratoire comme les autres »
Vrai ou Faux?
Faux: Ce n’est pas un virus respiratoire, c’est un virus vasculaire.
Source: heartandstroke.ca/articles/a-qui…
Image
Read 13 tweets

Did Thread Reader help you today?

Support us! We are indie developers!


This site is made by just two indie developers on a laptop doing marketing, support and development! Read more about the story.

Become a Premium Member ($3/month or $30/year) and get exclusive features!

Become Premium

Don't want to be a Premium member but still want to support us?

Make a small donation by buying us coffee ($5) or help with server cost ($10)

Donate via Paypal

Or Donate anonymously using crypto!

Ethereum

0xfe58350B80634f60Fa6Dc149a72b4DFbc17D341E copy

Bitcoin

3ATGMxNzCUFzxpMCHL5sWSt4DVtS8UqXpi copy

Thank you for your support!

Follow Us!

:(