What kind of childhood makes a top scientist? Is it enough to have all the right traits (brilliance, grit, etc) or do you need the right family too?
And why should we care? A 🧵 on our paper on the Nobel Laureates.
A teaser: the income distribution of the laureates' fathers.1/N
And why should we care? A 🧵 on our paper on the Nobel Laureates.
A teaser: the income distribution of the laureates' fathers.1/N

Why we should care: science is arguably the most important force for human progress, maybe by a lot. More discoveries, better lives for all of us.
If there’s a kid who could make a foundational discovery, we want to make sure they don’t spend their lives in the mines. 2/N
If there’s a kid who could make a foundational discovery, we want to make sure they don’t spend their lives in the mines. 2/N

So how is our society doing at finding and supporting the potential scientists who can improve this precarious existence?
Our idea was to look at the childhoods of the Nobel Laureates. Virtually all of them reached the pinnacle of discovery — where did they come from?
3/N
Our idea was to look at the childhoods of the Nobel Laureates. Virtually all of them reached the pinnacle of discovery — where did they come from?
3/N
This is work with @thesamasher, @eni_iljazi (PhD student at Wharton) and Catriona Farquharson (predoc at Princeton).
You can read the full paper here:
4/Npaulnovosad.com/pdf/nobel-priz…
You can read the full paper here:
4/Npaulnovosad.com/pdf/nobel-priz…
Here's the core idea: If talent is uniformly distributed and opportunity is equal, then Nobelists will come out of the woodwork, from random families & places.
If every laureate is born rich, or in the West, or has a teacher mom, it means a lot of our geniuses are being missed.
If every laureate is born rich, or in the West, or has a teacher mom, it means a lot of our geniuses are being missed.
We researched the childhood background of every laureate in the sciences. We excluded Peace and Literature, since those committees sometimes intentionally select people who were born poor — doesn’t happen in the sciences.
(We included econ, cue the not-a-real-Nobel truthers) 6/N
(We included econ, cue the not-a-real-Nobel truthers) 6/N
In economic history, the best measure of a kid’s childhood is often the father’s occupation. It predicts SES, and is often the only thing you can find.
Moms occupations are more sparse in the historical record, and many are housewives, which doesn’t tell you much about SES. 7/N
Moms occupations are more sparse in the historical record, and many are housewives, which doesn’t tell you much about SES. 7/N
For every laureate, we identified the predicted education and income rank of their fathers. (We found data on 715/739 laureates in the sciences).
Looks like we can reject that uniform distribution idea — about half come from the top 5%. 8/N

Looks like we can reject that uniform distribution idea — about half come from the top 5%. 8/N


They are not universally from elite families — take Daniel Tsui, the child of illiterate farmers from Henan China.
He somehow made it to Augustana College in Illinois, the University of Chicago, and Bell Labs, where he made Nobel-worthy discoveries in quantum physics. 9/N
He somehow made it to Augustana College in Illinois, the University of Chicago, and Bell Labs, where he made Nobel-worthy discoveries in quantum physics. 9/N

Or Har Gobind Khorana, the child of a village taxation clerk, the only literate family in a little village in Punjab.
He made it to Liverpool, Cambridge, and finally Wisconsin, where he did foundational work on how DNA is translated into proteins. 10/N
He made it to Liverpool, Cambridge, and finally Wisconsin, where he did foundational work on how DNA is translated into proteins. 10/N

The father occupation that is the most common for a Nobel Laureate: business owner! Some large businesses, but also a lot of small ones.
Doctors, professors, engineers are also common, and more disproportionate relative their population share. 11/N
Doctors, professors, engineers are also common, and more disproportionate relative their population share. 11/N

Only 3% of laureates grew up on farms — like this year’s Medicine winner, Victor Ambros (also from Hanover & Dartmouth, woot woot!).
Other notable laureates from farming families: David Card, Frederick Banting, Alexander Fleming. 12/N
Other notable laureates from farming families: David Card, Frederick Banting, Alexander Fleming. 12/N

Since we have 125 years of prize data, we can ask whether we have gotten any better at creating access for brilliant people from less elite backgrounds.
These graphs show the father income and education ranks over time. 13/N

These graphs show the father income and education ranks over time. 13/N


The average ed rank of a Nobel laureate father was 95 in 1901, and is 88 today.
For the optimists: we’re creating opportunity for twice as many people as we used to!
For the pessimists: it will be another 688 years before we get to the benchmark equal opportunity rank of 50!

For the optimists: we’re creating opportunity for twice as many people as we used to!
For the pessimists: it will be another 688 years before we get to the benchmark equal opportunity rank of 50!


Women face a lot of barriers in the sciences, especially in our sample cohorts (~1835–1975). Only 28/735 laureates are women.
Female laureates come from more elite backgrounds — suggesting family advantages made up for some of the barriers faced by women in the sciences. 15/N
Female laureates come from more elite backgrounds — suggesting family advantages made up for some of the barriers faced by women in the sciences. 15/N

Which world region has been the best at nurturing top scientists from ordinary families? We thought it might be Eastern Europe, with its Soviet mass education.
But in fact it is the land of opportunity 🇺🇸🇺🇸🇺🇸 16/N
But in fact it is the land of opportunity 🇺🇸🇺🇸🇺🇸 16/N

By every measure, Nobel laureates born in the United States come from less elite backgrounds than laureates born elsewhere.
17/N
17/N

We dug deeper into those U.S. born laureates, by linking their birth places to the Opportunity Atlas.
Not surprisingly, we get more laureates from non-elite families in places with more upward mobility. (We also get more laureates overall from these places) 18/N
Not surprisingly, we get more laureates from non-elite families in places with more upward mobility. (We also get more laureates overall from these places) 18/N

More surprisingly, we get more laureates in places with more *downward mobility*.
When there is lots of churn, and children from rich families are not guaranteed to be rich, we produce more top scientists. 19/N
When there is lots of churn, and children from rich families are not guaranteed to be rich, we produce more top scientists. 19/N

This is interesting! Why do we produce more successful scientists when rich kids seem to do worse — especially when scientists mostly come from rich families?
20/N
20/N
A couple of ideas:
1. People work harder when their outcomes aren’t guaranteed
2. We get better allocation of talent when there is a lot of economic churn
Causation isn’t correlation, so put this one into “food for thought”.
21/N
1. People work harder when their outcomes aren’t guaranteed
2. We get better allocation of talent when there is a lot of economic churn
Causation isn’t correlation, so put this one into “food for thought”.
21/N
But it's consistent with other theory and evidence that increasing access to opportunity makes a better society for everyone, not just the poor people getting more opportunities. 22/N
jstor.org/stable/2937945
jstor.org/stable/2937945

One last thing.
All our work so far is looking only at fathers’ occupations, NOT at birth countries.
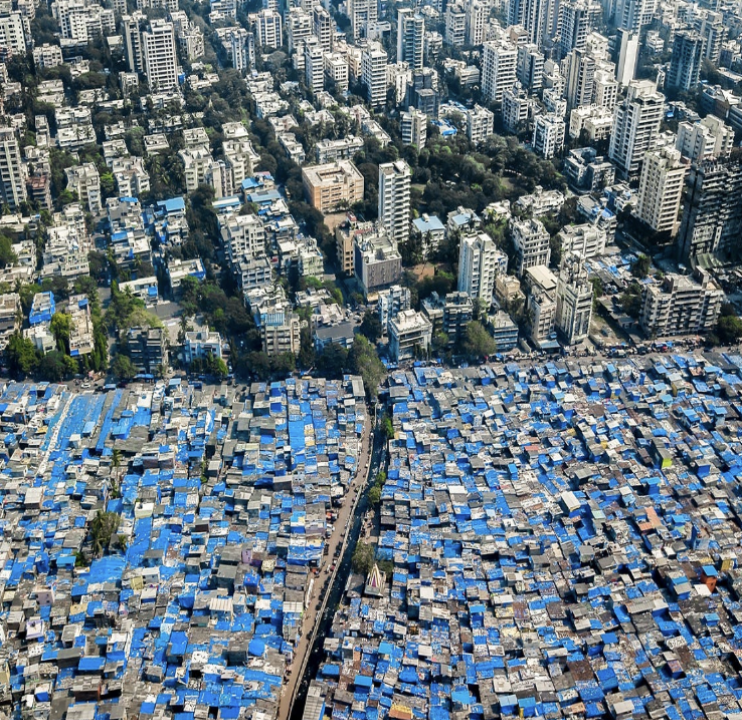
But the child of a tailor in India has far fewer life opportunities than the child of a tailor in the U.S., especially in earlier birth cohorts. 23/N
All our work so far is looking only at fathers’ occupations, NOT at birth countries.
But the child of a tailor in India has far fewer life opportunities than the child of a tailor in the U.S., especially in earlier birth cohorts. 23/N
We incorporate income differences across countries, using historical GDP data to rank laureates’ families in a synthetic global distribution.
The results are a lot less optimistic. 24/N
The results are a lot less optimistic. 24/N
In the global income distribution, the average Nobel laureate comes from a family at the 94th percentile — implying that 90% of global scientific talent is not achieving its potential.
And this measure has barely improved at all in 125 years. 25/N
And this measure has barely improved at all in 125 years. 25/N

Stephen Jay Gould’s concern is as important today as it was in 1980.
Brilliant people, with the potential to make world-changing scientific discoveries, are living and dying in poverty, without ever getting the chance to nurture their talents.
26/N
Brilliant people, with the potential to make world-changing scientific discoveries, are living and dying in poverty, without ever getting the chance to nurture their talents.
26/N

We are getting better at creating pathways for high potential people to succeed in the sciences. But we have a long to way to go.
Read the paper for more details:
N/N paulnovosad.com/pdf/nobel-priz…

Read the paper for more details:
N/N paulnovosad.com/pdf/nobel-priz…


We address genetics, bias in prize committees, contributions to society outside of the sciences, among others. I’ll post another thread on some of these in a bit.
28/27
28/27
• • •
Missing some Tweet in this thread? You can try to
force a refresh


