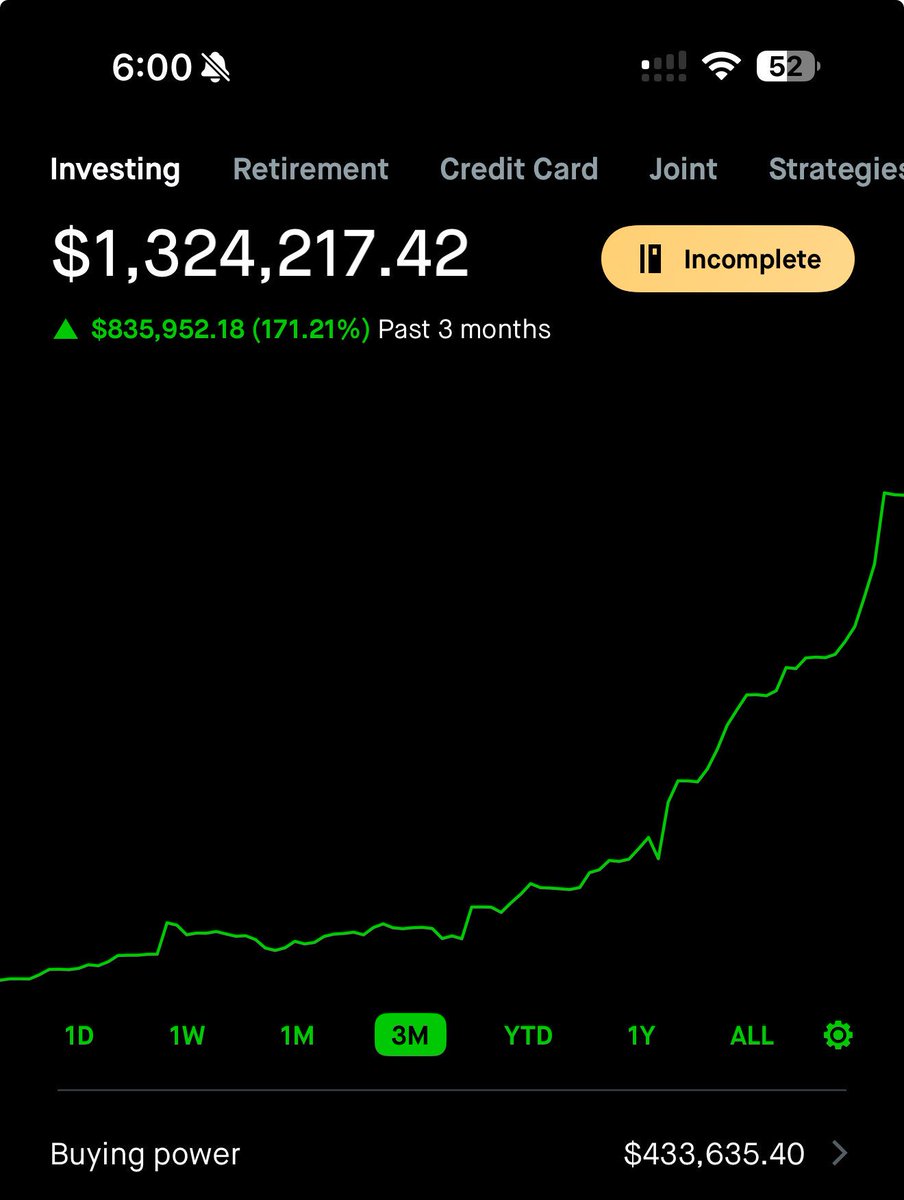
My first 2 years as a day trader, I lost -$10,000
Its not until I started swing trading that things really clicked for me
Fast forward 4 years
&
Now I make 5 figures every month
Below you can steal my exact swing trading strategy:🧵
Its not until I started swing trading that things really clicked for me
Fast forward 4 years
&
Now I make 5 figures every month
Below you can steal my exact swing trading strategy:🧵

To start off, we have to understand the point of this strategy..
We are trying to make trading super simple and keep things repeatable
We want to take advantage of strong market trends & use the leverage of options for a low risk high reward approach
We then want to de risk when markets are weaker, and no strong themes are present
We are trying to make trading super simple and keep things repeatable
We want to take advantage of strong market trends & use the leverage of options for a low risk high reward approach
We then want to de risk when markets are weaker, and no strong themes are present
1. Finding market strength and weakness
The easiest way to find out if the markets are trending is to:
Pull up a chart on
and add the 8, 21, 50 EMA's
EMA's can be used as a momentum gauge for when the markets are the hottest and stocks follow through the most.tradingview.com
The easiest way to find out if the markets are trending is to:
Pull up a chart on
and add the 8, 21, 50 EMA's
EMA's can be used as a momentum gauge for when the markets are the hottest and stocks follow through the most.tradingview.com

2. Framework
Now that we have the EMA's on the chart, we can make some rules for when we want to be active in the markets.
Use $SPY / $QQQ
1) Whenever $SPY / $QQQ are above the 8/21/50 EMA's, we want to be long with full size/conviction
2) Whenever $SPY / $QQQ are below the 8/21/50 EMA's, we want to use smaller size or completely avoid trading
This way we have a guide for when markets are going to be following through, and our strategy will be the most effective.
We can also use this on the individual names we are swing trading to narrow down our criteria.
3. Sizing
-Size 5% of account when markets are trending above moving averages
-Size 2.5% of account when market is in between moving averages
Size 1% of account or avoid trading when markets are below moving averages
The goal is to be aggressive when the markets are in a strong trend
-Size 5% of account when markets are trending above moving averages
-Size 2.5% of account when market is in between moving averages
Size 1% of account or avoid trading when markets are below moving averages
The goal is to be aggressive when the markets are in a strong trend
4. Scanning for leading stocks
Once we see that markets are staying above their moving averages...
We start to look for leading stocks ideally in strong themes
Easiest way to scan for leading stocks is to use: finviz.com/groups.ashx
Click on screener
We want to narrow it down our search to liquid stocks that are leading the market higher on volume
Here are the parameters I use in my scan:
Price: Over $5
Market cap: Over $2b+
Average volume: Over 500k
Relative volume: Over 1
Current volume: Over 1 million
And most importantly, above the 20,50,200 SMA to find leading names in the sector


Now we have some of the most liquid & strong names in the market
To make our scanning even easier, we can head to the performance tab and sort the volume by highest
To make our scanning even easier, we can head to the performance tab and sort the volume by highest
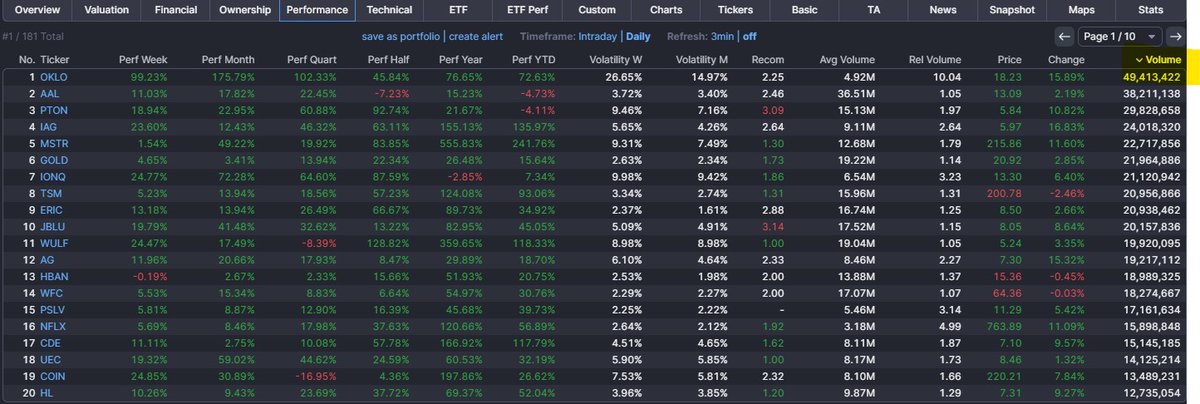
Head back over to charts and you should see a list of the strongest names that are breaking out.
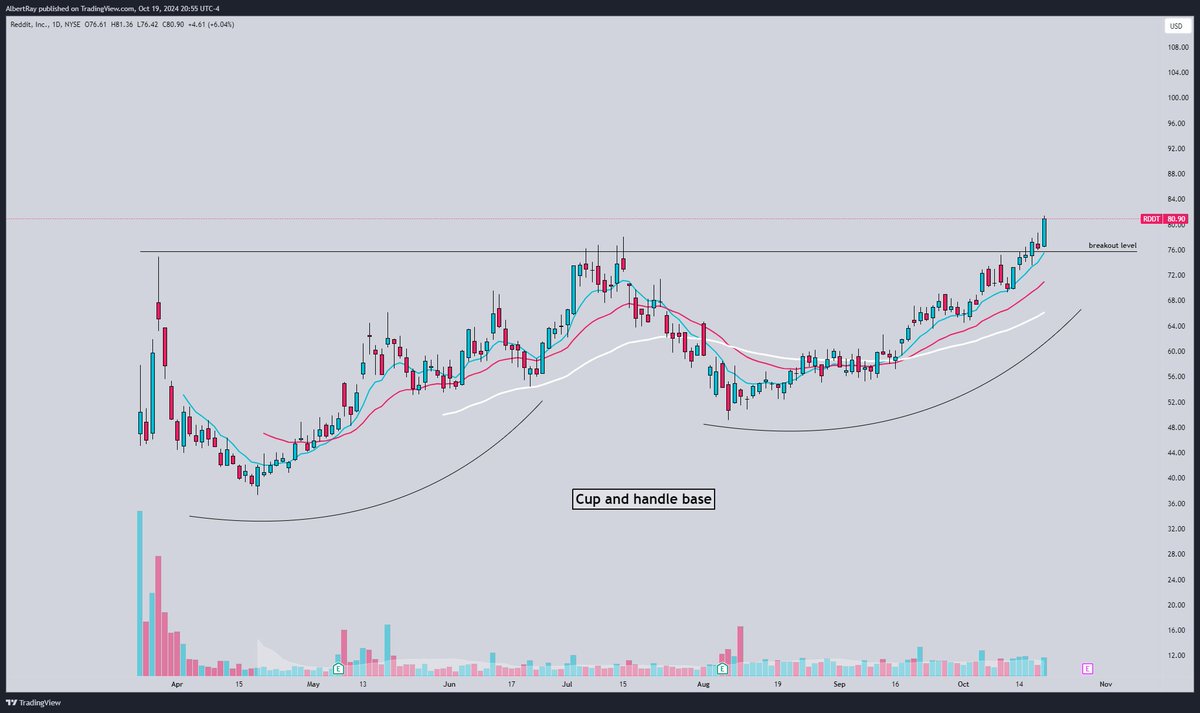
You are now looking for a chart that is setting up in a tight base with some sort of chart pattern forming
The goal is to find names that have not broken out yet, and are still setting up for a strong move out of their base
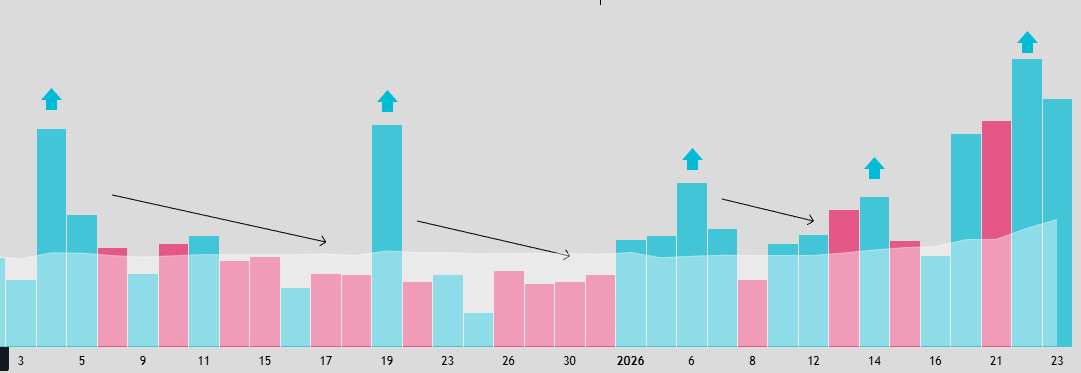
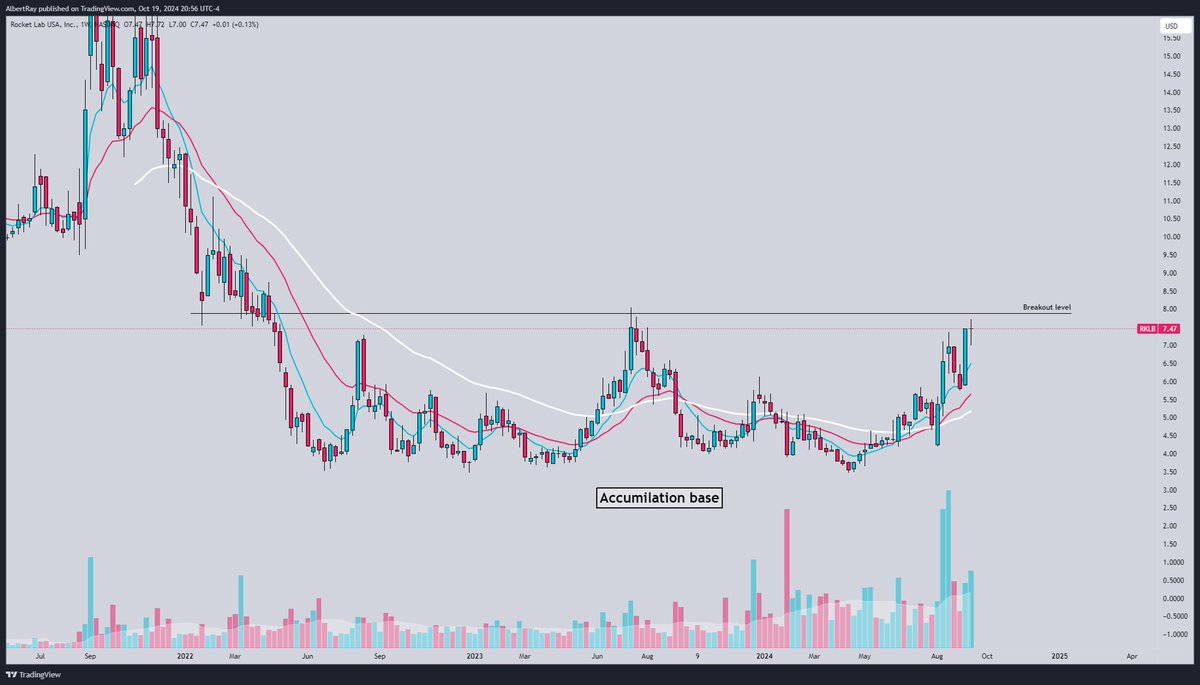
Below are some examples of bases I look for
Ideally you want to see accumulation volume patterns within the base
You are now looking for a chart that is setting up in a tight base with some sort of chart pattern forming
The goal is to find names that have not broken out yet, and are still setting up for a strong move out of their base
Below are some examples of bases I look for
Ideally you want to see accumulation volume patterns within the base


The name that caught my attention is:
$WULF
The stock is setting up in a big daily pennant base
Showing signs of accumulation volume in the base
& setting up for a big breakout through the pennant
$WULF
The stock is setting up in a big daily pennant base
Showing signs of accumulation volume in the base
& setting up for a big breakout through the pennant

6. Entry
We can now pull up $WULF on trading view
We need to choose a level to trigger our entry
What I look for, is a previous level of resistance that price has rejected multiple times
In this example, you can see the $5.36 level is a big spot for price
Price rejected $5.36 multiple times
If price breaks over that level, then we can assume a daily breakout is likely to occur
We want to confirm the breakout with lots of volume over the trigger level

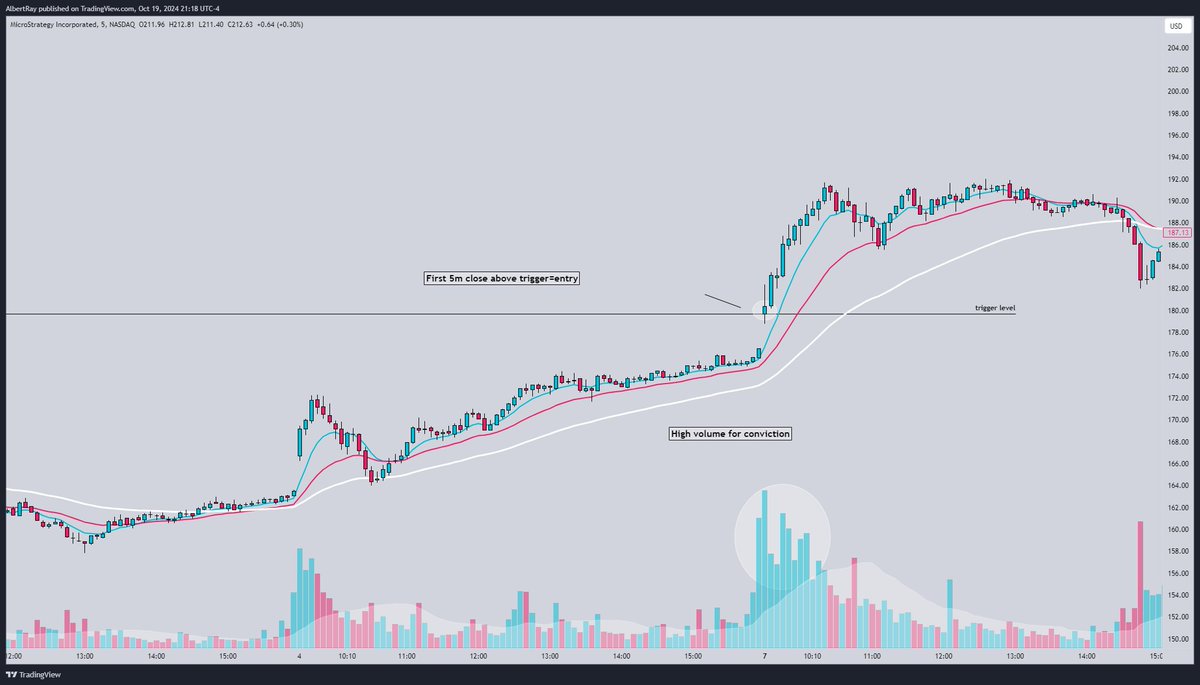
Entry is taken on a break above the highs of the base... For confirmation, we want to see high volume on a break out of the base.
For example $MSTR recent base breakout:
Leading stock in an emerging theme (Crypto)
Breaking out of a daily base with volume
Enter long at the break above the base.
For example $MSTR recent base breakout:
Leading stock in an emerging theme (Crypto)
Breaking out of a daily base with volume
Enter long at the break above the base.

We can use the 5m time frame to confirm our entry.
First 5m close above our level triggers long entry.
First 5m close above our level triggers long entry.
Stop loss is placed on the low of the daily breakout candle to make sure that we manage our risk in case of a failed breakout.

Alternatively for a higher win rate
Wait for price to comeback and retest the breakout level
(Only downside of this entry model is sometimes you will miss the breakout)
Wait for price to comeback and retest the breakout level
(Only downside of this entry model is sometimes you will miss the breakout)

7. Targets
Take profits at previous resistance levels
If price is making new all time highs, use Fibonacci levels to scale out.
My scale out strategy is 25% of the position at a time and moving up stop to break even after first trim.
If markets aren't following through, I trim 50% on the first target.
Take profits at previous resistance levels
If price is making new all time highs, use Fibonacci levels to scale out.
My scale out strategy is 25% of the position at a time and moving up stop to break even after first trim.
If markets aren't following through, I trim 50% on the first target.

The goal is to hold onto the trade until targets are hit or you are stopped out
This will help you make trading emotionless
Everything is preplanned and you are taking amazing risk to reward trades
Breakouts allow you to capture huge moves and using options contracts you can use the leverage they provide to risk small amounts of money for bigger hits
We want more risk when markets are strong and hot
&
We want smaller risk when conditions are choppier/less follow through.
We also want to find about 4-5 names of these names and create a watchlist/focus list to use to trigger our entries
Everything should be pre planned
The reason this strategy works so well is because we are trading the stocks that are leading the market higher and emerging out of strong sectors and themes.
We are also taking advantage of the strongest environments in the markets when stocks are breaking out and following through.
We are also taking advantage of the strongest environments in the markets when stocks are breaking out and following through.
Like any other strategy this is not a holy grail strategy but there's a reason why some of the best traders in the world swing strong names, and buy leading stocks in leading sectors.
I've personally used this strategy to trade names like:
$NVDA From $500-$1000
$SMCI $300-$1000
$MSTR $170-$220
$MU $106-$150
$CVNA $10-$100
Just this year and caught huge 25%+ breakouts
I've personally used this strategy to trade names like:
$NVDA From $500-$1000
$SMCI $300-$1000
$MSTR $170-$220
$MU $106-$150
$CVNA $10-$100
Just this year and caught huge 25%+ breakouts
I post these setups every night on my twitter with trigger levels, option contracts, and targets.
So you can follow along, and learn the strategy.
If you enjoyed and learned something from this thread LIKE+RT❤️for more trade plans and educational threads.
So you can follow along, and learn the strategy.
If you enjoyed and learned something from this thread LIKE+RT❤️for more trade plans and educational threads.
• • •
Missing some Tweet in this thread? You can try to
force a refresh