A few quick thoughts on NV early vote, since I'm sensing an irrational Dem freakout taking place there.
1) It is still quite early. The total turnout so far is just 25% of the final early vote in 2020, and 38% of the 2022 early vote. We're going to see a lot more votes cast there, and the numbers will move around during that time.
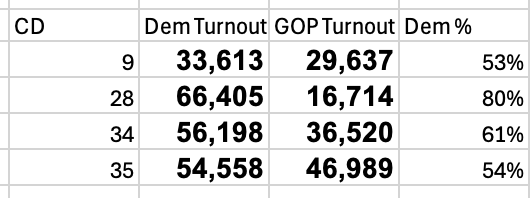
2) We may just be overreacting to a different sequencing of when the votes are cast. In 2020 at this point the Dem turnout % was 3% higher than the GOP turnout %, but by the time early voting ended, the GOP turnout was 5 pts higher. That's a big swing. Compare that to...
right now, where the Dem turnout lags the GOP by just 3.5%, a narrower turnout deficit than where things ended up in 2020.
From a demographic perspective, things look a bit better for Dems. Both AAPI and Black voters are accounting for a larger share of the early vote in NV than they did at this point in 2020.
All of this said, the GOP is undeniably accounting for a larger share of the early vote than they did in 2020 at this point. But that vote mode switching was expected post-pandemic and it doesn't appear at this point that the numbers we're seeing are a clear win for either side.
One more point on NV - we look at the early vote to determine if there are signs of intensity among either party. Are they turning out new voters? Given that Dems won in 2020, the GOP needs either more new voters or more crossover voters to win.
Well, in NV, the answer is no. Only 2.4% of early voting GOPs are first time voters. Compare that to 8.5% at this point in 2020.
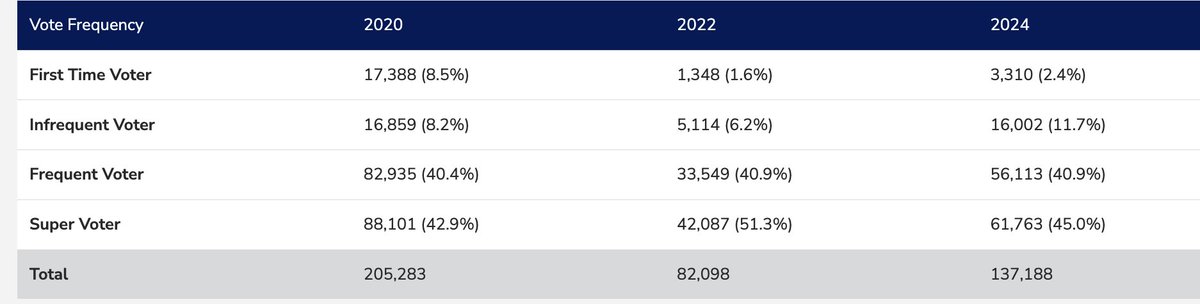
@imjdsharp Btw, I just looked this up for you. In NV, a whopping 2.4% of GOPs who have voted already are first time voters. Congratulations, that's... not a big number.
• • •
Missing some Tweet in this thread? You can try to
force a refresh
One important thing to remember as we continue to digest the election results, especially around swings with Hispanics: some of what we saw was due to turnout differentials, not just vote switching. We still don't have vote history for most states, but here is one minor example.
In Delaware, Hispanic voters were 4% of the turnout this year. In 2020, by party registration, the Hispanics who voted were +46.9 Dem, but in 2024 they were +36.7 Dem. The total turnout from Dem Hispanics was roughly equal to 2020, but 35% more GOP Hispanics voted this year.
Not surprisingly, this surge in GOP Hispanic turnout was most pronounced among younger voters. Under age 30 Hispanics moved by 17 pts to the GOP, while over age 75 moved only 3 pts.
I've been looking at the universe of voters in GA who cast a ballot in 2020, but didn't vote in 2024 and are still registered in the state. There are just over 1 million such voters. Not surprisingly, they are modeled as more likely Dems.
One of the biggest drop-off groups in Georgia was younger Black men. 132,036 Black men under the age of 35 voted in 2020 and are still registered there, 58,151 of them didn't vote in this election (44%). For comparison, the dropoff among young Black women was 30%.
I've also started looking at the question of what impact the bomb threats had on turnout. We need to look at this at a more granular level, but the targeted counties had drop-off percentages that were basically in line with the state average of 22%.
I spent a little time this morning looking over voter registration data over the course of the election in various states, looking for signs in retrospect of a Trump win. Looking at PA, something jumps out that I think is instructive as to the path forward.
Much of the conversation around the future of the D emparty/the need to fix the brand with "working class" voters centers around white voters. But something different emerges in the new voter reg data that speaks to the need for Dems to invest in organizing communities of color.
Look at the party registration comparisons in PA, first among voters of color, then among white voters.
Our team worked with the folks at Hart Research, in a project for PSG Consulting that produced some very interesting results. Both surveys looked at different angles of campaign advertising/media consumption. Here are a few highlights:
The Hart survey looked at swing voters in battleground states, who found the negative ads about Trump most memorable, followed by the positive Harris ads. Trump ads were less memorable (perhaps suggesting his broader media strategy, podcasts, etc, was much more effective?).
Reinforcing that point, swing voters were just much more likely to have seen a Harris ad. Perhaps this also helps explain why the swing to Trump was much smaller in the battlegrounds, relative to the rest of the country.
We won't have the full picture of turnout differentials for a while (states take weeks to months to publish Election Day individual turnout history) but looking at county data a bit of a pattern is emerging.
Outside of the battlegrounds, similar to 2022, Dem turnout seems to have cratered, and there were likely GOP persuasion gains, resulting in those bigger swings in states like NY, NJ, MA, FL, etc
Inside the battlegrounds, the turnout variations are much smaller, but generally turnout in Dem counties is running just slightly behind 2020, while GOP turnout is running just ahead. Couple that with slight persuasion gains, and you have the small shifts that won it for Trump.
Facing several somewhat overwhelming questions and realities this morning. First, why the data that gave me optimism that Harris could win was just wrong, or at least my interpretation of it was.
It will take some time for all of the data necessary to answer these questions is available. But there are many bitter truths to acknowledge this morning.
Of course, analytics aside, the most bitter truth is that America chose a convicted felon who ran a campaign focused on fear and division, bullying and attacking the most marginalized among us.