ADR%: Examining Trend-Following vs. Range-Expansive Move Behavior
I received an overwhelming response and numerous DMs (apologies if my replies are delayed, as I’m working to respond to each message constructively) across platforms, including LinkedIn and IG, about my recent post on the top 100 performing stocks (YTD basis), which included a breakdown of some simple key data. I also expanded the data for everyone's deep dive by sharing the full list of the top 100 % gainers from each year since 2018 without filter.
I wish to use this post to clarify in case anyone misinterprets how to apply the ADR% filter in their screening criteria.
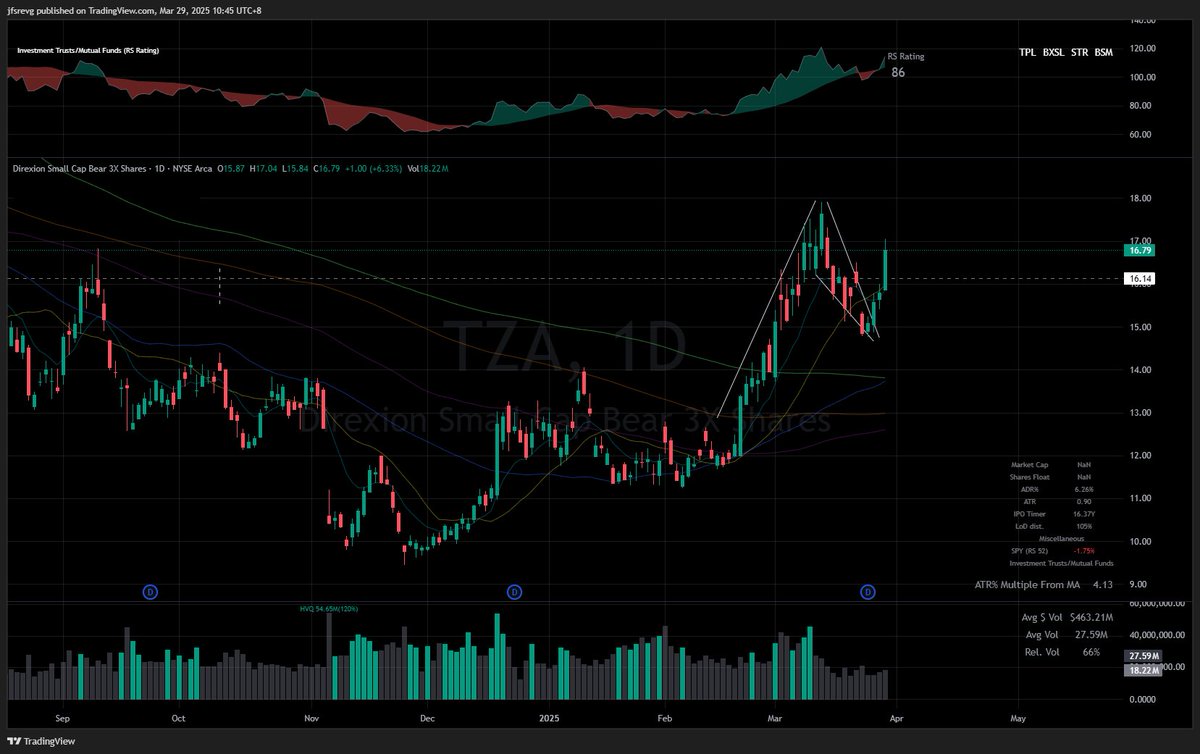
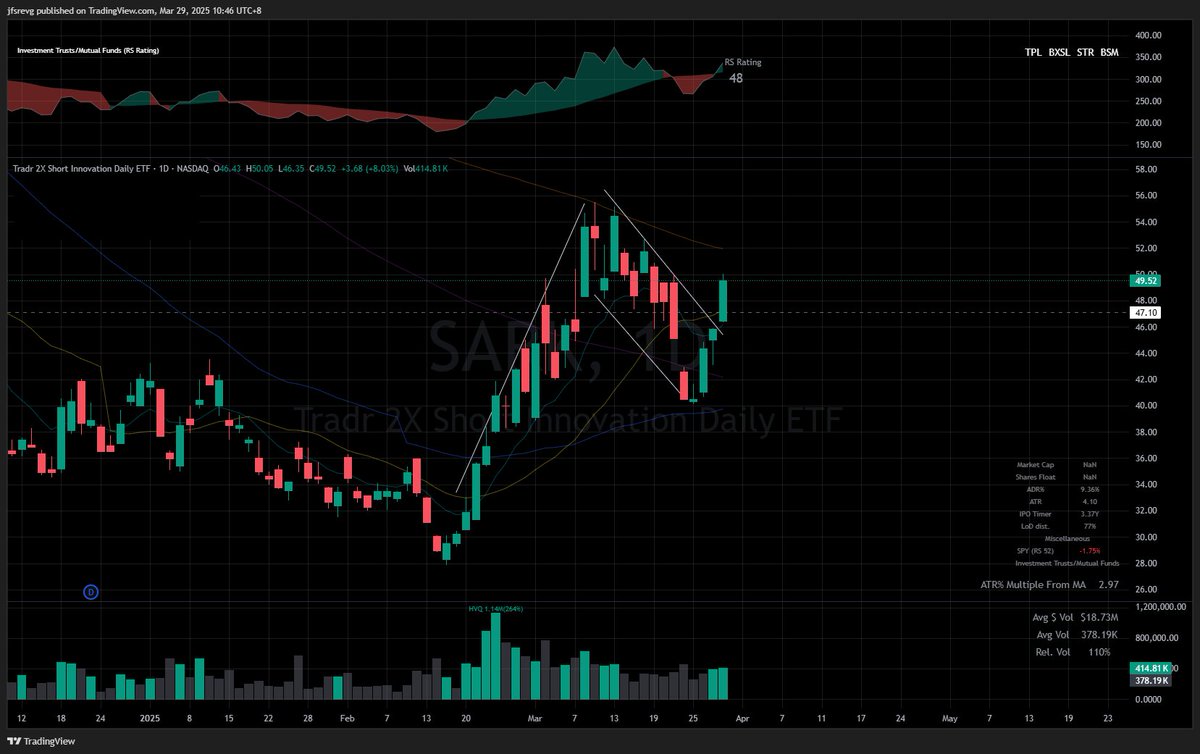
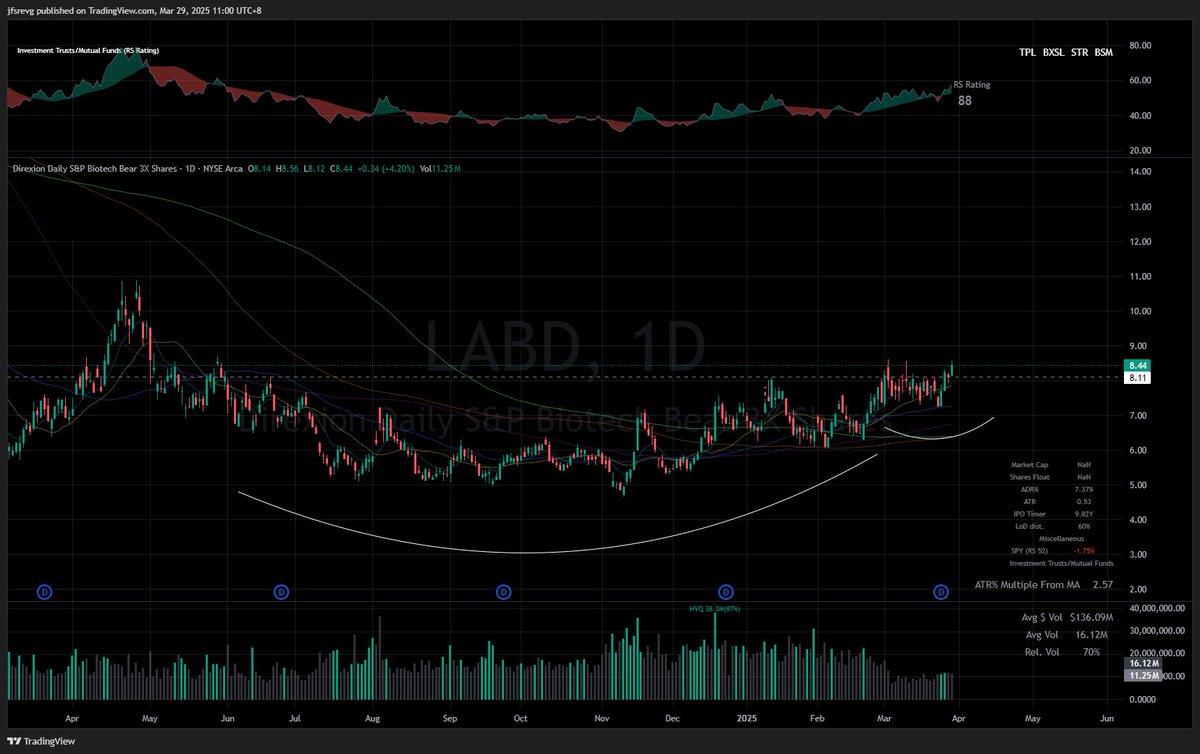
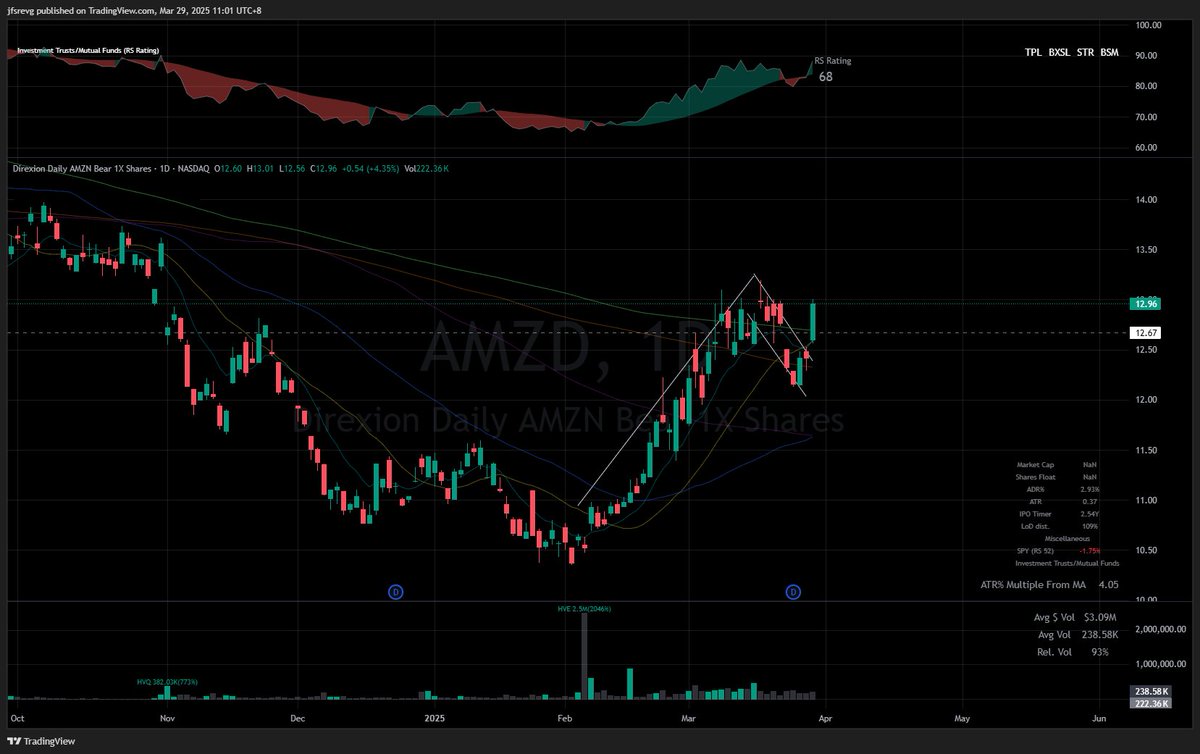
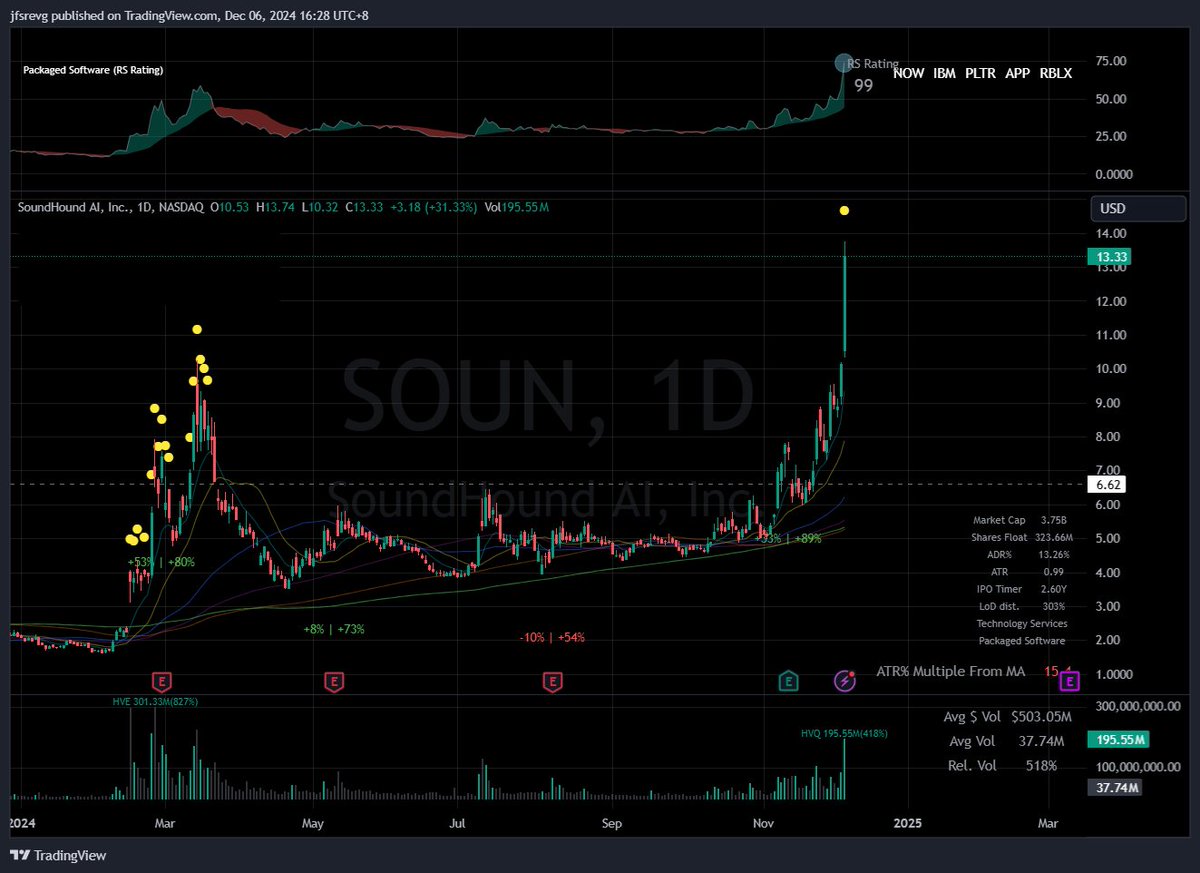
Here’s an overlay of the historical ADR% indicator highlighting two types of +70% upward moves within the same quarter. I’ve selected four stocks with varying prices, share structures, sector/group, floats, and trading volumes.
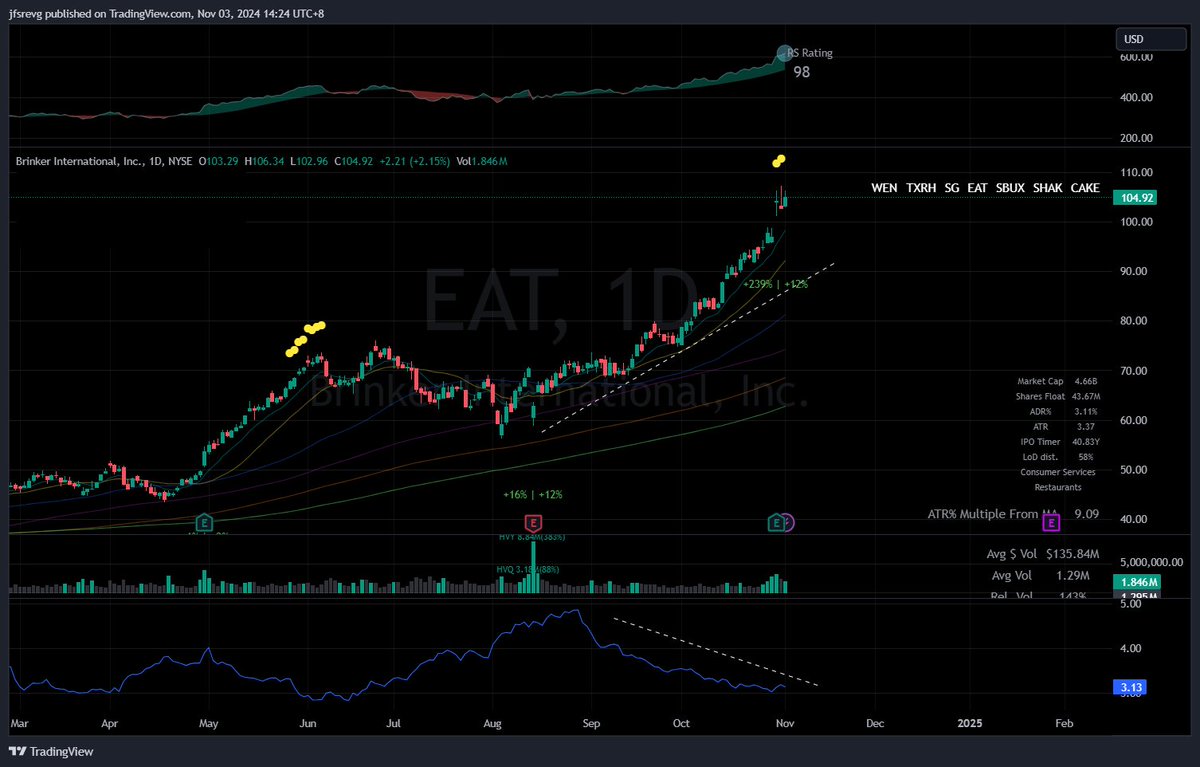
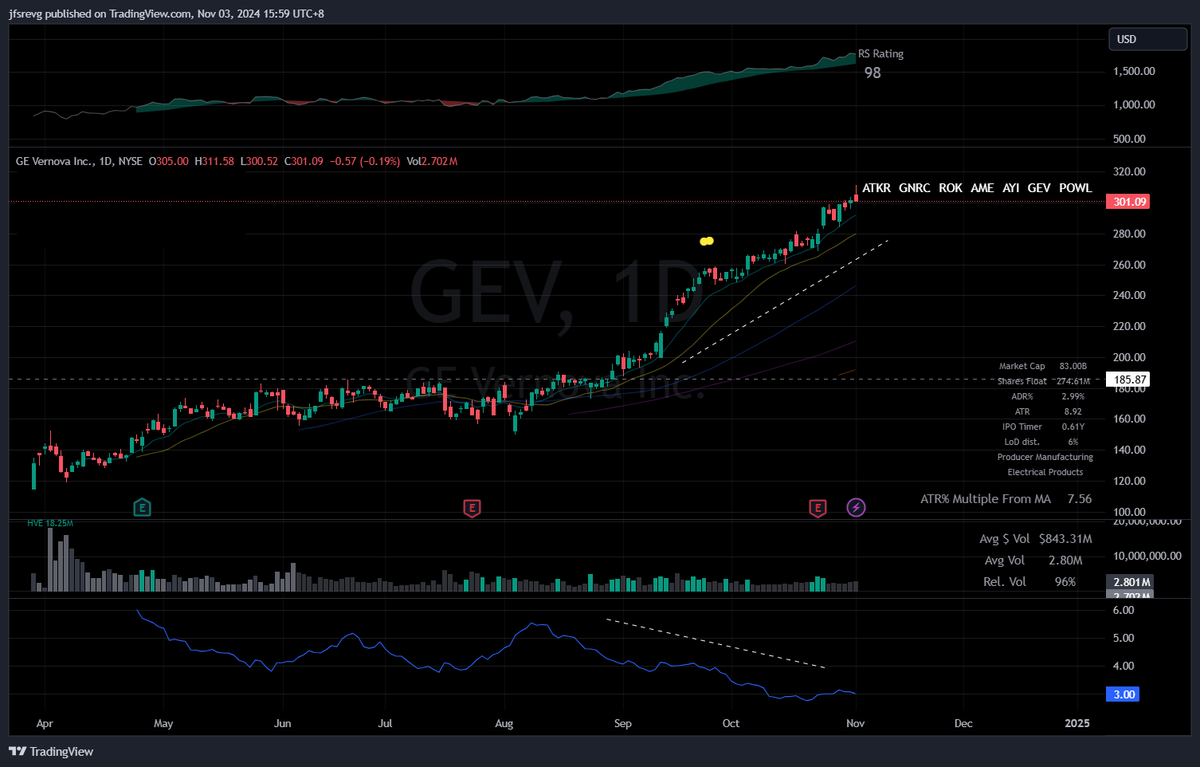
$EAT $GEV shows a trend-following, yet volatility-compressive move (ADR% compression) during its +70% run, similar to $CAVA and $APP, which also demonstrated volatility compression.
$EAT - Restaurants
- Market Cap: $4.4B
- Share Float: 43M
- Average $ Volume (50D): $135M
- Average Share Volume (50D): 1.3M
- ADR%: 3.1%
- Time to +70%: 45 trading days
$GEV - Electronics Products
- Market Cap: $83B
- Share Float: 274M
- Average $ Volume (50D): $843M
- Average Share Volume (50D): 2.8M
- ADR%: 2.99%
- Time to +70%: 56 trading days
$OKLO and $WULF exhibit a broad, range-expansive price movement, with high ADR% volatility throughout their upward trajectory. Very much like short term momentum burst advocated by @PradeepBonde
$OKLO - Sector: Industrial Machinery
- Market Cap: $2.6B
- Share Float: 69M
- Average $ Volume (50D): $276M
- Average Share Volume (50D): 12M
- ADR%: 18%
- Time to +70%: 4 trading days
$WULF - Sector: Data Processing Services
- Market Cap: $2.3B
- Share Float: 274M
- Average $ Volume (50D): $138M
- Average Share Volume (50D): 22M
- ADR%: 10%
- Time to +70%: 8-10 trading days
This comparison could provide valuable insights into the type of trading you may want to prioritize, allowing you to optimize your screener to align better with your trading style. Additionally different execution parameters and rule, exit or profit-taking strategies may be necessary to adapt to the distinct price movement patterns shown here.
• • •
Missing some Tweet in this thread? You can try to
force a refresh
Focus List and latest Portfolio Update (Educational Thread part 3) - This is exactly how quick Focus List changes, you need to be active on your pre-market preparation when volatility picks up.
Focus List Stock (Liquid, Non-RVOL)
$UNHG (stopped out yesterday, but worthy to re-attempt if re-ORH friday's high)
$MSFD (This is $MSFT short btw, just in case)
Refer to additional post below for latest 1-Month RS Breakdown of Strongest Leading Segments, Sectors, Industry Groups and Liquid 24 Stocks (Min $1B Vol, >ADR 3%)
My Focus List (Educational Thread) - AMA (I’ll leave the reply section open for everyone to ask why any of the listed ticker is on my focus list, and you’re also welcome to share your ticker and ask why I do not like it.)
Some tickers are duplicated; it’s really a matter of which one offers better liquidity, tighter spread at the trigger time. eg. $ETHA vs $ETHU , eg. $SCHV vs $IVE (large cap value has taken over as the strongest segment right for the past 3 weeks). Some tickers are leveraged based, but the idea has to begin from the actual underlying product. eg. $TEMT (2x) but I based on $TEM price action, ATR% extension, and VARS (Volatility Adjusted RS). I also highly recommend having my ATR% from the 50-MA extension displayed on your chart when reviewing them either on @tradingview or @Deepvue
I believe I have covered the whole spectrum of the market in my last two hours of work. I use a top down approach from measuring VARS within the major indexes, segments, both EW and CW industry groups, and commodities and tradable Asian index futures (China is leading)
This is simply my read of the market through the lens of asymmetric risk-to-reward opportunities, and it carries no weight against what the market ultimately decides to do. What I notice is volatility is picking up in the market, and I personally thrive in volatile environment, similar to how I call and made my profits right at the market bottom on April 7th this year.
When market volatility picks up, the focus list may shift abruptly from day to day — either because I didn’t chase the breakout, or because the setup broke down sharply. You need to be active with Focus List sieving this few days as long as market held Thursday low.
Stay sharp, and agile to market development.
This is the current 1-Month RS of the market indexes, and 9 various segments from the index.
This is the current 1-Month RS (sorted) of the Industry Groups at both EW and CW level
I actually come across the exact same concept in @stamatoudism 2024 trader conference sharing
executing trade at a much tiger risk has a parabolical effect with R returns, and the drop in win rate% is not linear to the tightness of your entry execution. I thought of deep diving this based on actual data of my own last 500 trades but i need to literally map out R data on tighter entries 1 by 1, because there will be winners turned losers in tighter entries now. I am keen to explore on this topic if there's more ideas to generate around @BrianLeeTrades @stamatoudism @TMLitalia
@LoneStockTrader @BrianLeeTrades @stamatoudism what im exploring is how prolonged the drawdown will be now with the reduced win rate % before recovering with an expansive winning trade. tighter entries may also end up with multiple re-entries within the initial 1 trade execution
@LoneStockTrader @BrianLeeTrades @stamatoudism and there may be fund constrain to the following trades executed in the actual data since tighter risk entry is equivalent to higher capital locked in
can be an avoidance to losing trades, but also may offset some big winning opportunities
Market Overview: Analyzing the Last 30 Days through Index Breakdown, Relative Strength Segments, Sectors, Industry Groups, and Liquid Mega Caps
1. Segment
All segments across small, mid, large, and mega caps in value, core, and growth remain negative in 1-month % performance, but growth $IJK, $IJT, $IVW are outperforming their value and core counterparts within each market cap category.
1-month % comparison to index, $IVW is -5.47% vs $QQQ & $QQQE -6.33% and -6.84% respectively.
2. Sector RS % Sorted, Equal Weight vs Cap Weight
I strongly recommend reviewing the technical charts of $XLP, $XLU, $RSPS, and $RSPU amid this month-long selloff
Consumer Staples $XLP & $RSPS are the only sectors to eke out gains among the 11 sectors in both equal-weighted and cap-weighted formats. At RS % level, Utilities, Consumer Staples, Industrials, and Real Estate is outperforming the market index at both $SPY, $RSP and $QQQE level.
3. Top 15 Industry Group (1-Month RS% Sorted), Equal Weight vs Cap Weight
If you're a swing trader, it really shouldn't be a day you stay in cash—you need to know when to hunt. I was up until 3:30 AM local time (GMT+8) , the first time in months.
Go through all the 10 setups here, it's the same thing repeating. RS takes precedence to have a place in your watchlist, then you track for setup to upgrade them into focus list. Train yourself to look at long side setup also via inverse related products, to keep maintaining the same process repetitively with opportunity to participate in both market direction, and to save borrowing cost from direct short sell execution.
This way, you’ll be training to master the same kick 1,000 times, rather than constantly switching strategies or joining different mentoring programs that offer no edge in the market. You must push yourself to approach this endeavor like a professional athlete. Consistency, focus, discipline, delayed gratification, and grit.
$KC - A Breakdown of My Trade on $KC's +180% Move in a Month (Scans, Watchlist Management, Entry Day Insights, and Systematic Risk Management for Holding)
Rather than replying to individual DMs about my $KC position (ironically, my earlier post was about $FBTC), I decided it’s better to share this as part of the free educational content for everyone to benefit from.
Here are a few key points about the share structure of $KC before the breakout, so you can adjust your screening parameters if needed. This is the type of stock profile that typically shows up in the 'Top 100 Performance% Stocks' annually. It's also why I tend to focus on small to mid-cap stocks most of the time.
1. 1st move back above 200-MA after 1 year, +80% with RS during the 2 weeks.
$KC will initially show up on your '1-Month Strongest Move' screener. I move the entire list (which includes $KC) to my watchlist, awaiting a higher low swing to confirm a character change.
2. Higher Low may be in place at this point with price contraction within a symmetrical triangle. I abolutely pay more attention to stocks when price contract along with ALL moving averages contracts together. (10, 20, 50, 100, 150, 200 DMA)
$KC remains in watchlist, but will begin to keep appearing in my 'Screener within Watchlist' based on technical price compression.
3. Entry day on 5/11; here are some qualification
i) it broke out of a 2 week technical triangle pattern and consolidated range
ii) it broke out with high RVOL (RVOL was 40% in 10mins of open)
iii) LoD was only 40% (i skip trade beyond 60%. I want high possibility of position ending the day with unrealized profit, not near entry price)
Entry day is T. 3 stop set based on 33% stop level from entry to LoD. I do not consolidate and adjust my stops to breakeven (avg price) until T+3 days
T+3 = 33% size down (immediate partial profit taking or shaving risk down on trade that did not follow through but still hovering above avg entry as I have tight stops (since I only do execution when price action presents entry to LoD below 60%). All stops are consolidated to breakeven level on 1 full singular size.
Read more here on my detailed approach to risk management within a singular trade: x.com/jfsrevg/status…
4. Day 4 onwards is all mental stop on 10-MA. I do not mess with the trade if it doesn't close below 10-MA.
5. This trade did not close below 10-MA at all even at 13 x ATR% from 50-MA currently (highest ever). No reason to sell everything, but you have every reason to sell some pieces into strength at extension beyond 10 x ATR% beyond 50-MA.
To be fair, nobody will know the outcome on the day their trade execution; but what I strongly advise is to adhere to the principle of law of large number and you need to have this few things right;
i) make sure your screener gets u the setup before they MOVE, not after (i do not believe in high volume scan, you have already missed the most optimal entry day and the risk/reward is skewed after it. Try volume based high RVOL 'at time' scan instead during live market at minimum. High volume scan works best only as post continuation base setup, and the perfect entry spot often is a few weeks after that result appear)
ii) have a entry rule that stack the odds of position ending the day with unrealized profit. LoD 60% rule, high RVOL etc are my 'secret'
iii) ensure you have non-discretionary profit taking/stop loss rule. you cannot second guess the market, and u need to keep your emotion in check. you won't be able to hold a big runner if you like to second guess 'top' and 'bottom' in the market. the trades that can move needle in your annual performance % are trades that you never expect to do what they are doing. they make moves against basic human instinct.
iv) you need to know when to go 'heavy' vs 'light' in terms of trade frequency and activity. $KC trade was taken right on the day market bounce off it's rising 50-MA, before subsequent market gap up to reclaim 10 & 20-MA. Market index chart eg. $SPY $RSP $QQQ are great to cushion you when to layer your risk or release the pedal. I will never take on risk when $SPY is 4 x ATR% from 50-MA when it historically pullback from 5 x ATR% from 50-MA. I am pretty certain $KC sort of move will never happen in any stock at this juncture of the market. You need to stack every single possible odds to let the trade work in your favor, and the current market extension now is a headwind more than a tailwind.
v) repetition & refine; do this 100 times, go through your trade data and refine. do it another 100 times again, go through your trade data and refine. in a year, you will be able to refine up to 4 times at least. you only can get better if you refine your trading based on your trade journal. you can't escape this part of the work, please.
I hope this is helpful, it's just some basic principle, math and plenty of repetition in trading for me.
If you find this type of content valuable, do retweet ♾ so I know what sort of things to share in this space during my free time.
@stonkypits this will be helpful for you
$SOUN , same type of share structure. I taken too many new positions on 21/11 to trade this. such a bad miss.