John Sides Profile picture
Nov 6 2 tweets 2 min read Read on X
My initial take on Trump's win:


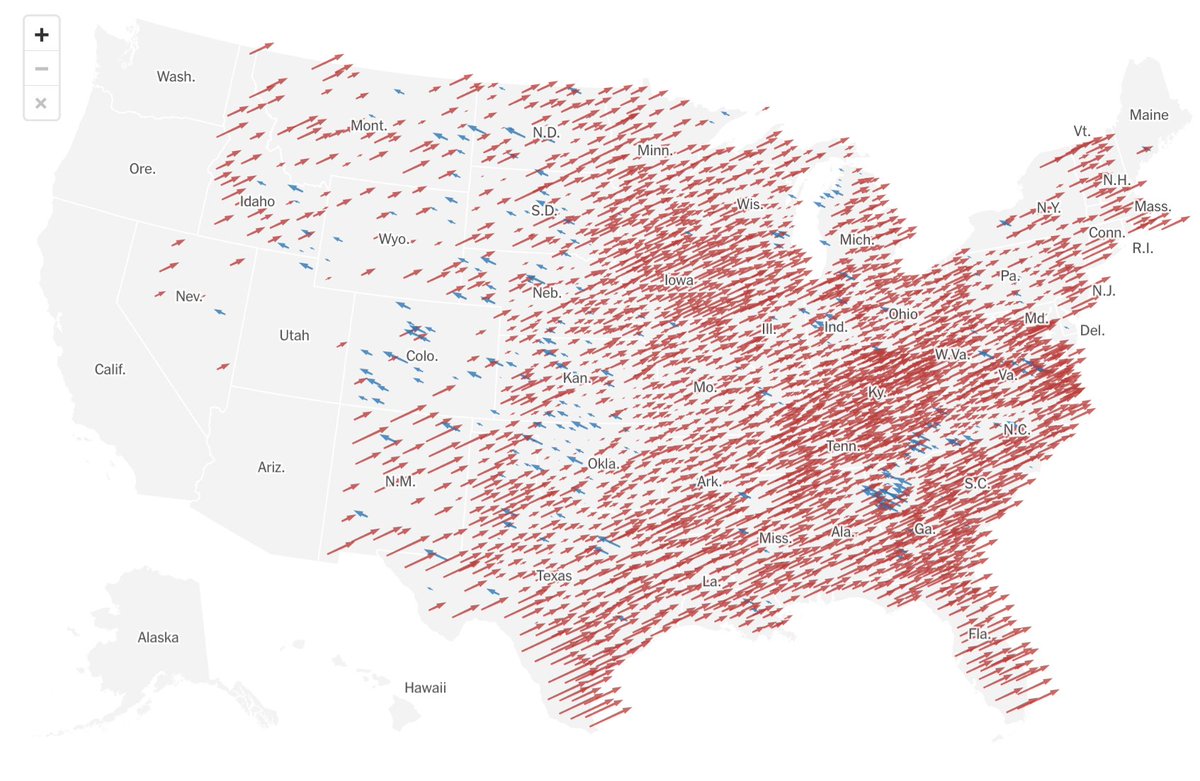
His gains were widespread, so explanations should start with the broadest factors -- not with bespoke stories about states, cities, counties, and groups.

The simplest explanation: party of unpopular incumbent loses.

1/2 goodauthority.org/news/where-to-…Image
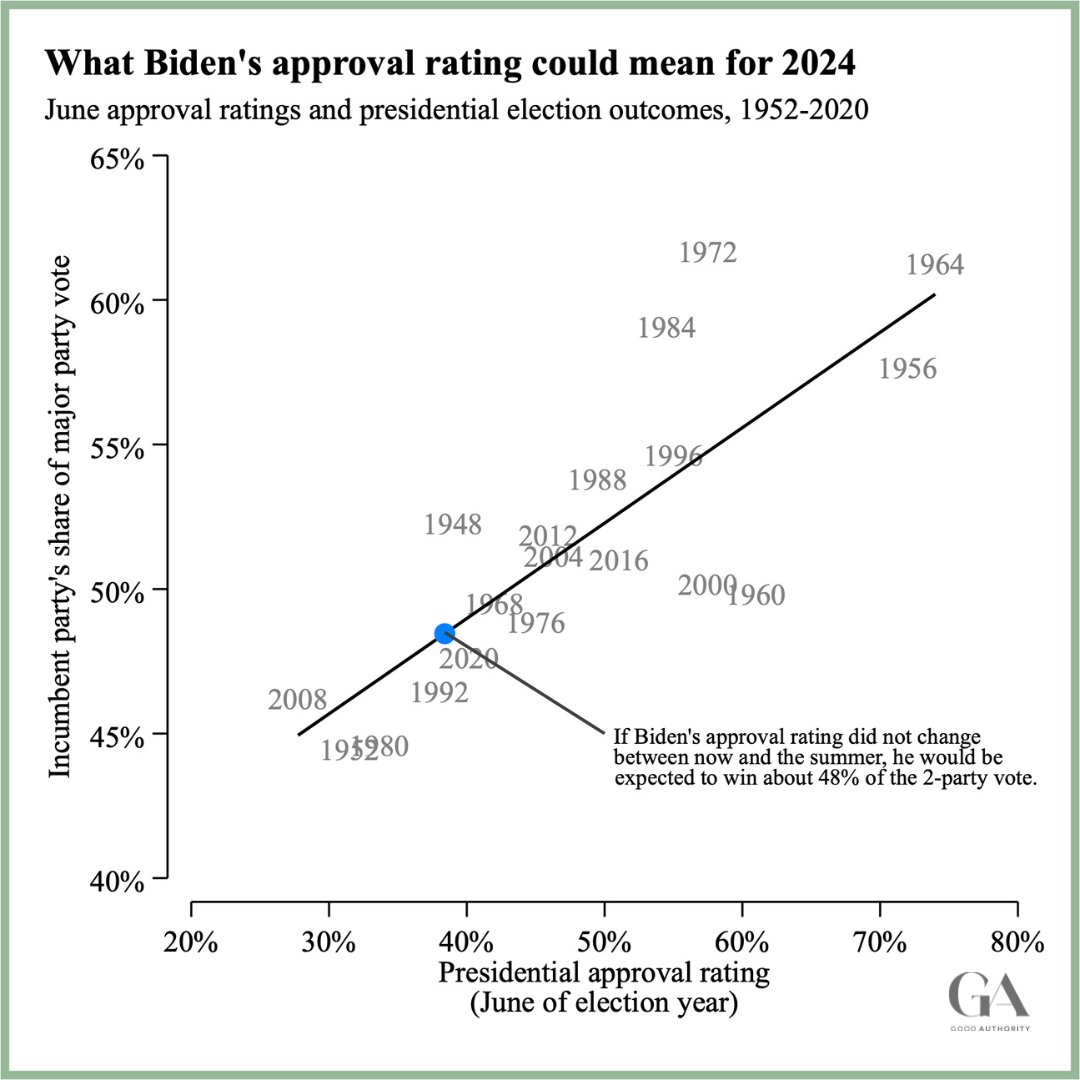
This is a graph of presidential approval and the vote that I posted back in March ().

Biden's approval rating was consistent with a 3-point win for Trump. That's roughly where we're headed. goodauthority.org/news/how-much-…Image

• • •

Missing some Tweet in this thread? You can try to force a refresh
 

Keep Current with John Sides

John Sides Profile picture

Stay in touch and get notified when new unrolls are available from this author!

Read all threads

This Thread may be Removed Anytime!

PDF

Twitter may remove this content at anytime! Save it as PDF for later use!

Try unrolling a thread yourself!

how to unroll video
  1. Follow @ThreadReaderApp to mention us!

  2. From a Twitter thread mention us with a keyword "unroll"
@threadreaderapp unroll

Practice here first or read more on our help page!

More from @johnmsides

Nov 7
Like clockwork, commentators interpret elections as ideological mandates. Trump wins, so voters hate progressives and want conservatism.

Here's why that's wrong.

1) It doesn't help explain why parties *of all ideologies* lost vote share post-COVID. Image
Image
2) It exaggerates how much voters vote based on policy. So much polisci shows how difficult that is, and how in fact it's often the reverse: voters choose polices based on whatever their preferred candidate is advocating.

press.uchicago.edu/ucp/books/book…
cambridge.org/core/journals/…
3) The big LOL comes when the new party takes power and goes in the direction that voters allegedly "wanted." And then voters...go in the opposite direction! This is the thermostatic model of public opinion.

jstor.org/stable/2111666
Read 4 tweets
Oct 11
Graphs like this from the FT makes you think that only white Democrats are on the left or have moved left on immigration or racial issues.

That is simply not true. Image
Image
The comparison of race+politics groups (white Ds or white progressives) to only racial groups (Hispanic, Black) is the issue here.

In reality, white Ds have moved left on racial issues but are not as racially liberal as Black Ds. Black Ds have moved left too! Image
Or from an August 2024 survey, here's the percent who want to increase immigration:

White D: 27%
Hispanic D: 25%
Black D: 15%

White Ds not to the left of Hispanic Ds.

(Btw the plurality of each group wants to keep immigration at same level.)
Read 5 tweets
Apr 9
Not much "racial realignment" in these new Pew numbers. Image
And the youngest voters are not any more Republican despite weak support for Biden in the early trial heats. Image
And young men are a very pro-Democratic group overall. Not really a large gender gap there vs. older cohorts. Image
Read 4 tweets
Mar 11
The story is more complex than these graphs suggest. Let's take Black partisanship and do 3 things:

1) Crucially, separate ANES and CES surveys

2) Calculate the % Democratic within and without independents who lean Democratic

3) No smoothing. Let's see the raw data.
Here's the graph. First, the "gold standard" ANES shows no secular decline in black partisanship. All of the decline is in the CES.

Moreover, the % Democratic is routinely higher in the ANES than the CES, especially if you include leaners. Image
Now, the CES has 3 more years of data (2021-23) than the ANES, which stops in 2020. It's possible that the next ANES (2024) will show a decline in Democratic partisanship among Black Americans.
Read 6 tweets
Oct 21, 2022
In advance of election night, I think it's useful to calibrate expectations to the fundamentals, not to polls or vibes.

So, a good calibration:

House: Dems lose ~40-45 seats
Senate: Dems lose 1-3 seats

Anything significantly less = Dem over-performance. Here's why.
A standard model for House elections is Gary Jacobson's: presidential approval, income trends, and # seats controlled by the president's party.

Forecast: Democrats lose 45 seats.

dropbox.com/s/95s7hip8bzg5…
A similar model by Lewis-Beck and Tien: -44 D seats in House and -5 in Senate.

If they factor in expert ratings by @nathanlgonzales, they estimate -37 D House and -3 D Senate.

centerforpolitics.org/crystalball/ar…
Read 8 tweets
Mar 31, 2022
Here's what I think would move the popularism debate along. We need some specific testable claims, because I see different versions of the idea circulating.

1) The popularity of the president's public positions is associated with their approval rating and reelection.
2) The popularity of positions associated with a political party (fairly or not) affect the popularity of all of a party's officeholders.

(e.g., this is the claim implicit in the idea that "defunding the police" cost Democrats in 2020)
3) The popularity of the positions associated with a president (or his party?) affect how many seats that president's party loses in a midterm election.

And does this apply to the out-party too? Do the GOP's unpopular positions matter right now?
Read 7 tweets

Did Thread Reader help you today?

Support us! We are indie developers!


This site is made by just two indie developers on a laptop doing marketing, support and development! Read more about the story.

Become a Premium Member ($3/month or $30/year) and get exclusive features!

Become Premium

Don't want to be a Premium member but still want to support us?

Make a small donation by buying us coffee ($5) or help with server cost ($10)

Donate via Paypal

Or Donate anonymously using crypto!

Ethereum

0xfe58350B80634f60Fa6Dc149a72b4DFbc17D341E copy

Bitcoin

3ATGMxNzCUFzxpMCHL5sWSt4DVtS8UqXpi copy

Thank you for your support!

Follow Us!

:(