🚨China's export bans on Gallium & Germanium 🚨
Why it matters: Gallium is central to countless downstream industries: semiconductors, aerospace, telecommunications, & more. This image shows how interconnected it is.
Public data, method & our paper in thread 🧵
Why it matters: Gallium is central to countless downstream industries: semiconductors, aerospace, telecommunications, & more. This image shows how interconnected it is.
Public data, method & our paper in thread 🧵
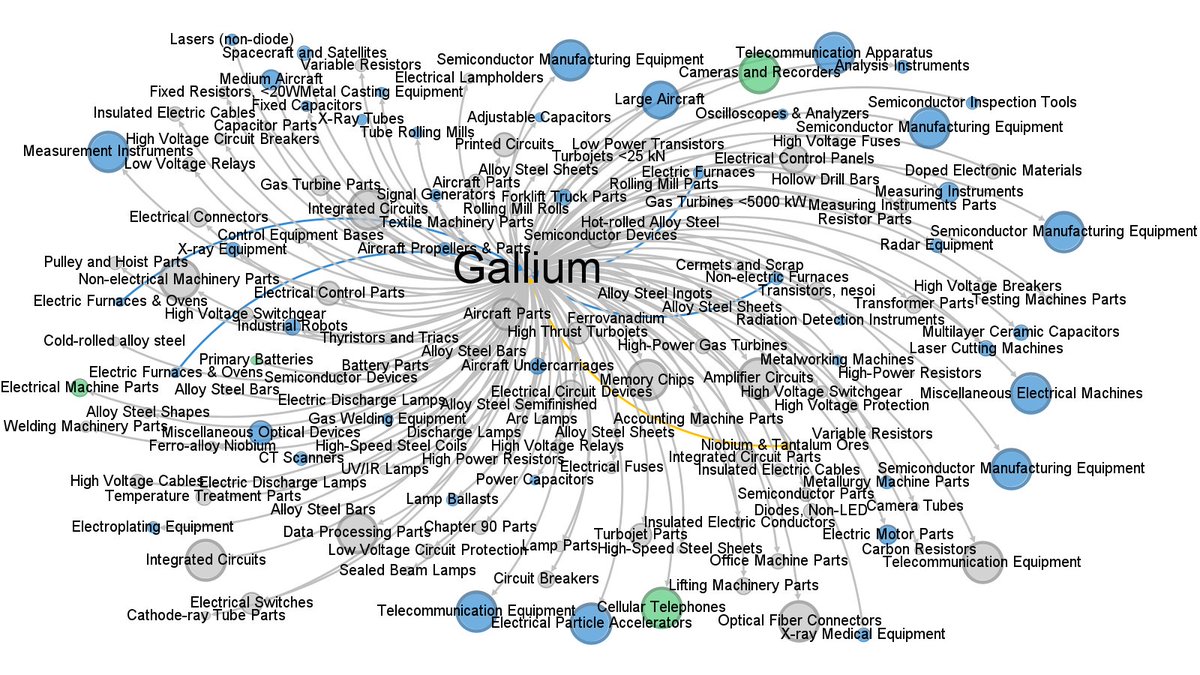
Each node is a product. Size of node based on how "important" or "central" product is in international trade. Blue nodes are capital goods, silver are intermediates and green are final consumption good.
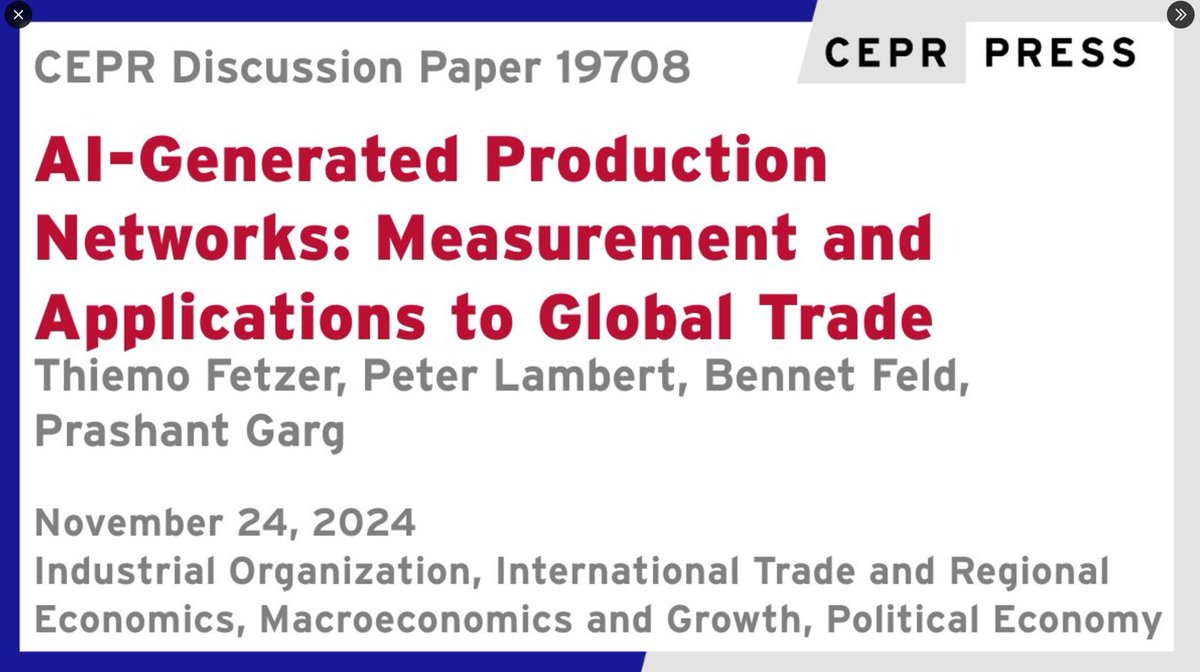
In our paper, AI-Generated Production Networks (2024), joint with with @fetzert, @pj_lambert and @bennetlf, we used AI to build AIPNET, a detailed map of global production networks.
It shows how critical materials like Gallium & Germanium underpin industries worldwide—and the disruptions export bans can cause.
It shows how critical materials like Gallium & Germanium underpin industries worldwide—and the disruptions export bans can cause.
Why AIPNET? Global trade relies on complex relationships between >5,000 products. Mapping these with traditional methods is slow. We built AIPNET using AI, which connects products like Gallium to their downstream uses. Here's what we found 👇
Trend 1: Global trade is shifting toward upstream & intermediary goods—like Gallium—are becoming central. Countries are focusing on inputs critical to supply chain resilience. Gallium isn't alone. AIPNET shows rising importance of:
1. Digital integrated circuits 🖥️
2. Lithium compounds 📷products.Capital
1. Digital integrated circuits 🖥️
2. Lithium compounds 📷products.Capital
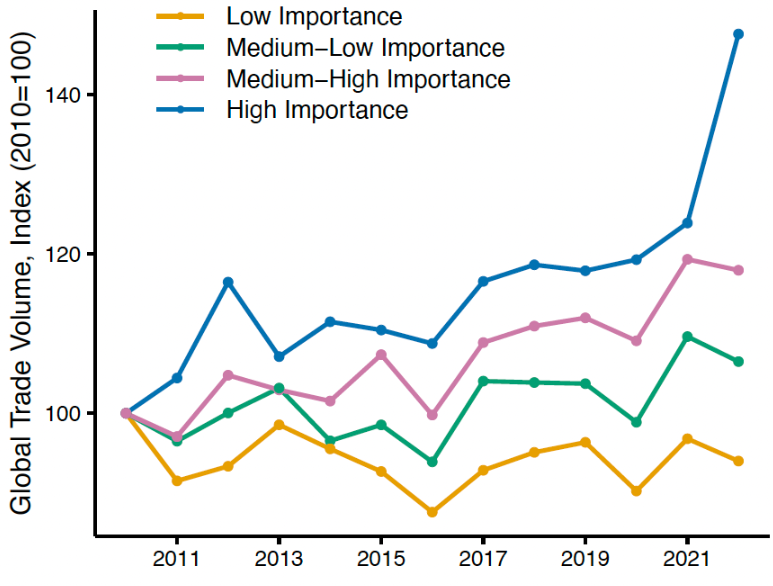
Trend 2: Diverging strategies of U.S. vs. China in global trade. China: Importing more upstream products like Gallium to build advanced domestic industries. US: Importing more downstream goods, relying on global supply chains.
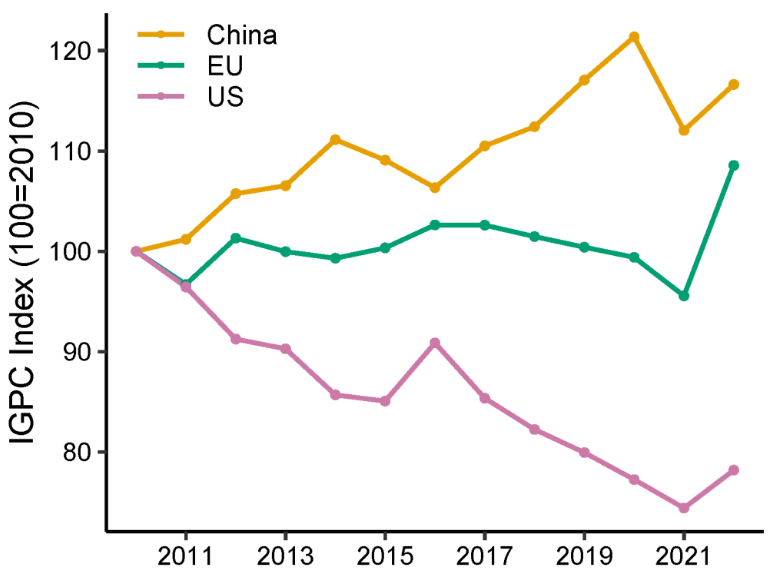
Why This Matters China's dominance in Gallium (98% of global production) is a prime example of its leverage. Export bans on Gallium/Germanium disrupt entire supply chains, with ripple effects across semiconductors, defence, & tech.
https://x.com/Mojo_flyin/status/1863870129588826317
China's recent export ban on gallium and germanium to the U.S. underscores the fragility of global supply chains. For instance, U.S. Geological Survey estimates that a complete ban could reduce U.S. GDP by $3.4 billion (…)doi.org/10.3133/ofr202…
For context, this move is a direct response to U.S. export controls on semiconductor technology to China. Such escalating tit-for-tat measures highlight the urgent need for nations to reassess their supply chain dependencies.
Our paper finds that global supply shocks on internationally traded goods have become more prevalent since 2016, particularly affecting consumer goods and processed intermediates. Here's a map of these supply shocks.
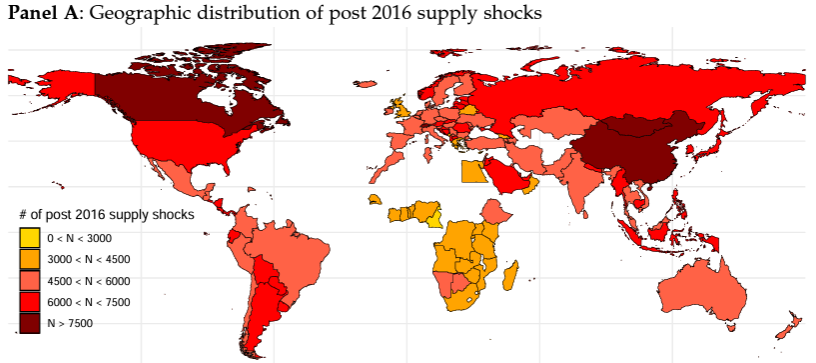
Explore the data, methods and paper at aipnet.io
• • •
Missing some Tweet in this thread? You can try to
force a refresh