Swing Trading 101🧵
Nearly 5000 stocks are publicly traded, this would help you zero down to the best names that are likely to go north.
And no, you don't need to know what company does or actively track news to make a killing.
Price + Volume = All you need
✅
Long read ahead...telegram.me/StockyMind
Nearly 5000 stocks are publicly traded, this would help you zero down to the best names that are likely to go north.
And no, you don't need to know what company does or actively track news to make a killing.
Price + Volume = All you need
✅
Long read ahead...telegram.me/StockyMind

1. Stocks having underlying buying force, that doesn’t rule out the possibility of breakout of a beaten down name.
It simply force represents the upper hand of buyers in the stock. In cases where stock is in a base and has no recent buying force, look out for pocket pivot days.
It simply force represents the upper hand of buyers in the stock. In cases where stock is in a base and has no recent buying force, look out for pocket pivot days.
Pocket Pivot is a day with a higher volume than any down volume days in the prior 10 days.
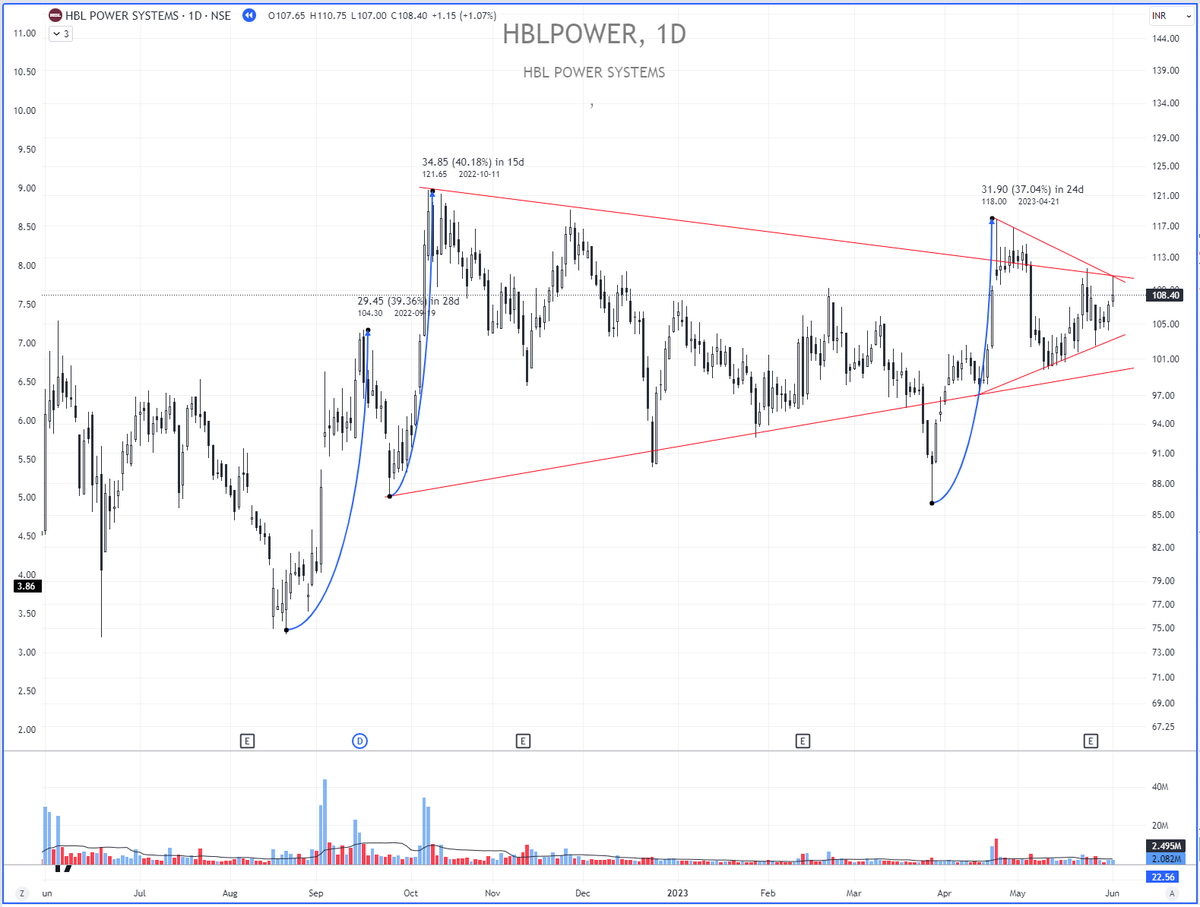
Stock undergoes price & time correction for months after a massive move, it gets out of hibernation by moving explosively in a matter of few trading sessions on higher-than-usual volumes.
Stock undergoes price & time correction for months after a massive move, it gets out of hibernation by moving explosively in a matter of few trading sessions on higher-than-usual volumes.


2. Tight action, contraction in price and volume signifies dried up/bleak buying/selling activity taking the stock nowhere, resulting in tightening price action. Inside Bar is also a tightening action.
Moreover, it's important to look for a contraction in volumes as well, conforming to the absence of significant trading activity in the stock.
Tight action around the previous highs (resistance level) will require less buying force to break through further
Moreover, it's important to look for a contraction in volumes as well, conforming to the absence of significant trading activity in the stock.
Tight action around the previous highs (resistance level) will require less buying force to break through further


3. Extension from the moving averages, every tight zone doesn’t necessarily imply/ensure the presence of setup.
Moving averages help in gauging the ripeness of a setup, it's merely a guiding tool, buying and selling decisions aren’t based on them.
Moving averages help in gauging the ripeness of a setup, it's merely a guiding tool, buying and selling decisions aren’t based on them.
Any extension to the upside/downside often results into mean reversion as the trend is tired, so it is likely to go sideways till the moving averages catch up or pull back to them.
Ideally moving averages should be sloping higher, if trading on the long side.
Ideally moving averages should be sloping higher, if trading on the long side.


4. Flagging/Basing out, after making a run stock flags out/ forms a base/ consolidates, before the new sets of buyers jump in.
There are many variations of a base and consolidation quality. The best ones consolidate near the highs/ in the top 1/3rd area.
There are many variations of a base and consolidation quality. The best ones consolidate near the highs/ in the top 1/3rd area.


5. While flagging out/ forming the base, the stock usually attempts to break out and fail or stumble down from the base and comes back into the base, these can be considered as shakeout.
Such action increases the odds of a successful breakout as it has shaken out the weaker hands out of the stock and even a slight buying force can take the stock higher, resulting in a breakout.
Be wary of big red days with higher than usual volume
Such action increases the odds of a successful breakout as it has shaken out the weaker hands out of the stock and even a slight buying force can take the stock higher, resulting in a breakout.
Be wary of big red days with higher than usual volume


6. Higher Lows Sound bases have a higher low formation, implying the stock is being bought proactively/buyers step in whenever it pushes down/ pulls back.
Undercuts & reclaim. A variation of shakeout, when stock cuts below the moving averages & reclaims it back.
Undercuts & reclaim. A variation of shakeout, when stock cuts below the moving averages & reclaims it back.


7. The Larger the base the better, new market leaders emerge from massive bases, and prior to breakout it’ll be building higher lows,
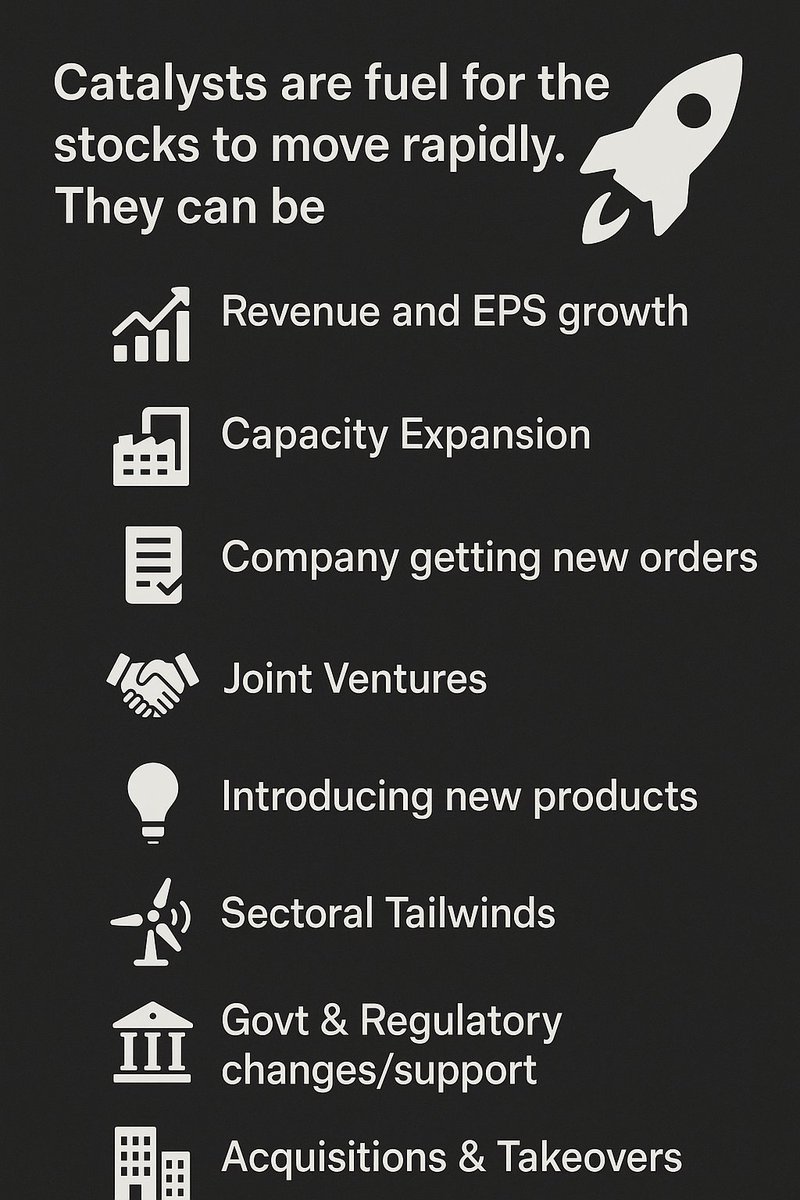
1 or 2 failed breakout attempts, wide +ve days on high volume, weekly contraction, fundamental triggers (jump in sales, EPS or good forecast)
1 or 2 failed breakout attempts, wide +ve days on high volume, weekly contraction, fundamental triggers (jump in sales, EPS or good forecast)


8. Other Nuances.. Look for high ADR names, those are the stocks that tend to move faster.
For encashing longer swing moves, focus on Young Stocks (not more than 3 bases old) Base is a pause in price movement for some amount of time.
One way to determine if a stock is young, count the number of times the stock has bounced off 10/20 MA or check the magnitude of the move.
The same concept can be applied on different time frames for either direction.


That's a wrap-up 🧵
Like 🩷 Retweet 🔁
Live updates ➡️ telegram.me/StockyMind
Follow @stonkssguy 🤝 @StockyMind 🤝 @DSS_Rajput007
x.com/DSS_Rajput007/…
Like 🩷 Retweet 🔁
Live updates ➡️ telegram.me/StockyMind
Follow @stonkssguy 🤝 @StockyMind 🤝 @DSS_Rajput007
x.com/DSS_Rajput007/…
• • •
Missing some Tweet in this thread? You can try to
force a refresh