Chasing a big breakout that you missed is the fastest way to go broke as a trader.
But there's one setup to rely on to get in big winners (even past their pivot points):
Inside Days.
Here's everything you need to master this setup (and start trading it ASAP):
But there's one setup to rely on to get in big winners (even past their pivot points):
Inside Days.
Here's everything you need to master this setup (and start trading it ASAP):
By the end of this post, you'll have mastered:
→ What an inside day setup is
→ Why it's so reliable on names already showing momentum
→ Different ways to enter/exit the inside day setup
→ 3 examples to study & deep dive
→ 1 easy scans to run
Let's get going.
→ What an inside day setup is
→ Why it's so reliable on names already showing momentum
→ Different ways to enter/exit the inside day setup
→ 3 examples to study & deep dive
→ 1 easy scans to run
Let's get going.
What is an inside day setup?
An inside day occurs when today's price is fully within the high & low of yesterday's bar, hinting at short term consolidation before price continues in the current direction.
It's also best when the inside bar comes on low volume.
An inside day occurs when today's price is fully within the high & low of yesterday's bar, hinting at short term consolidation before price continues in the current direction.
It's also best when the inside bar comes on low volume.
Why are inside days so reliable?
Inside days take advantage of the fact that there is already momentum in a name, and all you're doing is waiting for a slight pause to find your way into the stock.
This slight pause allows for proper risk:reward dynamics to show up...
Inside days take advantage of the fact that there is already momentum in a name, and all you're doing is waiting for a slight pause to find your way into the stock.
This slight pause allows for proper risk:reward dynamics to show up...
Allowing you to...
1) get positioned in an established winner, and
2) manage your risk along the way.
Let's keep going...
1) get positioned in an established winner, and
2) manage your risk along the way.
Let's keep going...
Here are the simple entry/exit rules for the inside day setup:
Entries:
→ The high of the previous day
→ The high of the inside day
Exits:
→ The low of the previous day
→ The low of the inside day
You should be shooting for a stop loss within ~5% of entry.
Entries:
→ The high of the previous day
→ The high of the inside day
Exits:
→ The low of the previous day
→ The low of the inside day
You should be shooting for a stop loss within ~5% of entry.
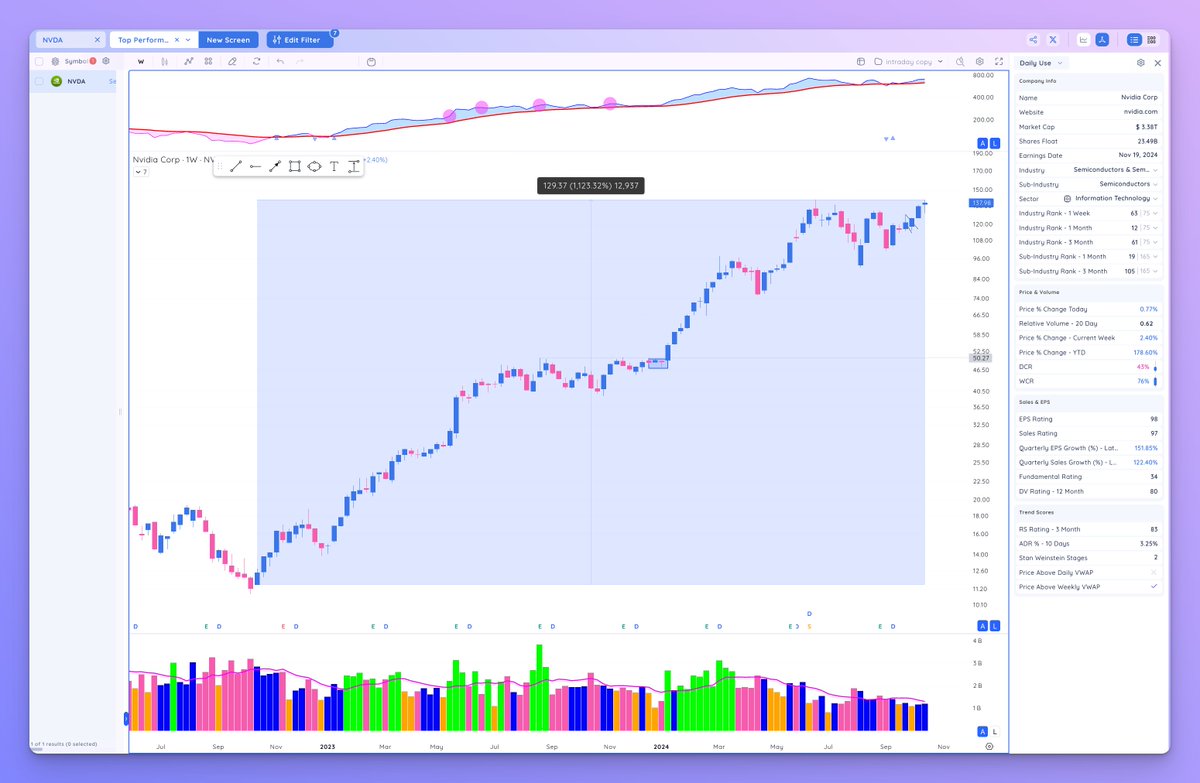
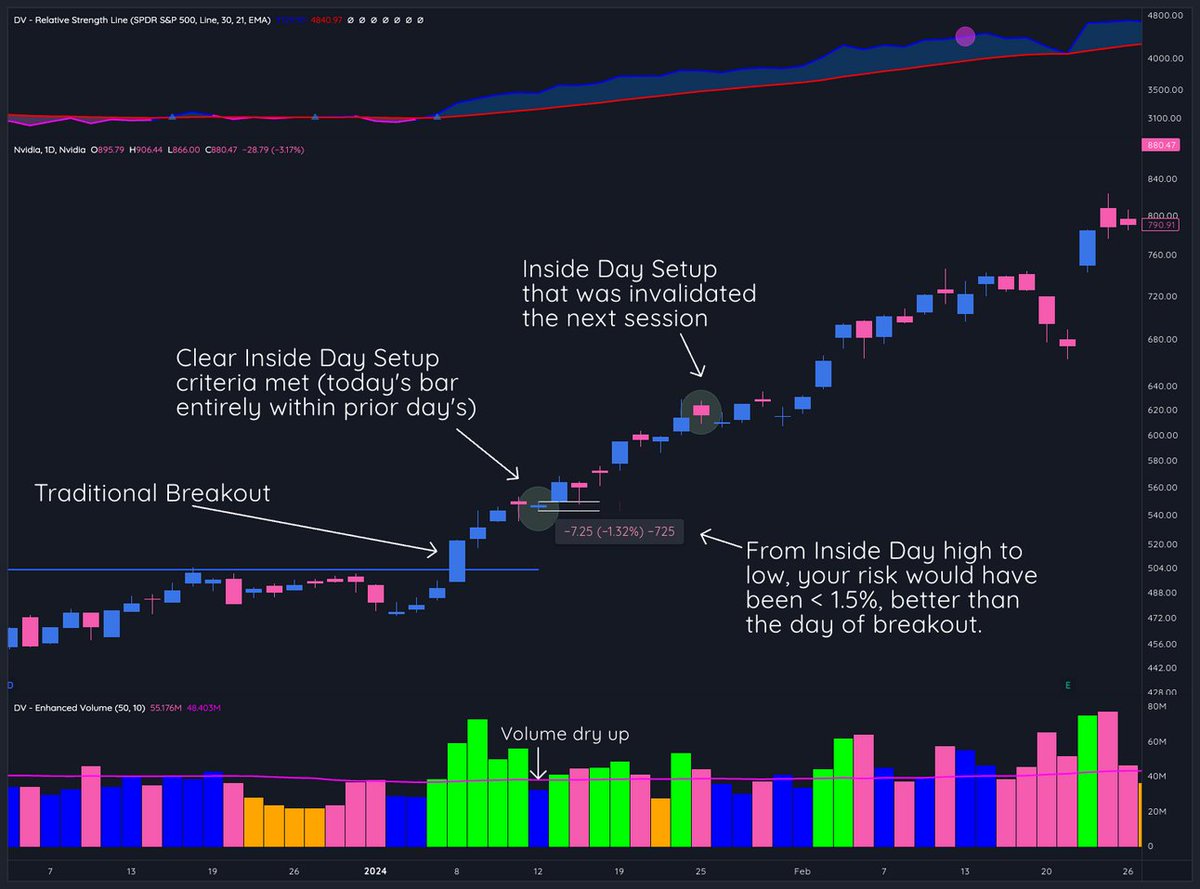
Let's check out 3 simple examples from this year's market, starting with $NVDA:
NVDA broke out of a multi-month base in early January and didn't look back.
If you missed the traditional breakout entry, you had to wait 4 days until the Inside Day setup presented itself.
Some quick stats:
Inside Day Setup occurs on January 12, 2024 (4 days after breakout)
Following Day Entry: Through $550
Stop Loss: Under $543
Total Risk: ~1.4%
The stock has since split, but go back and check out the intraday price action from Jan. 12 & the days following!
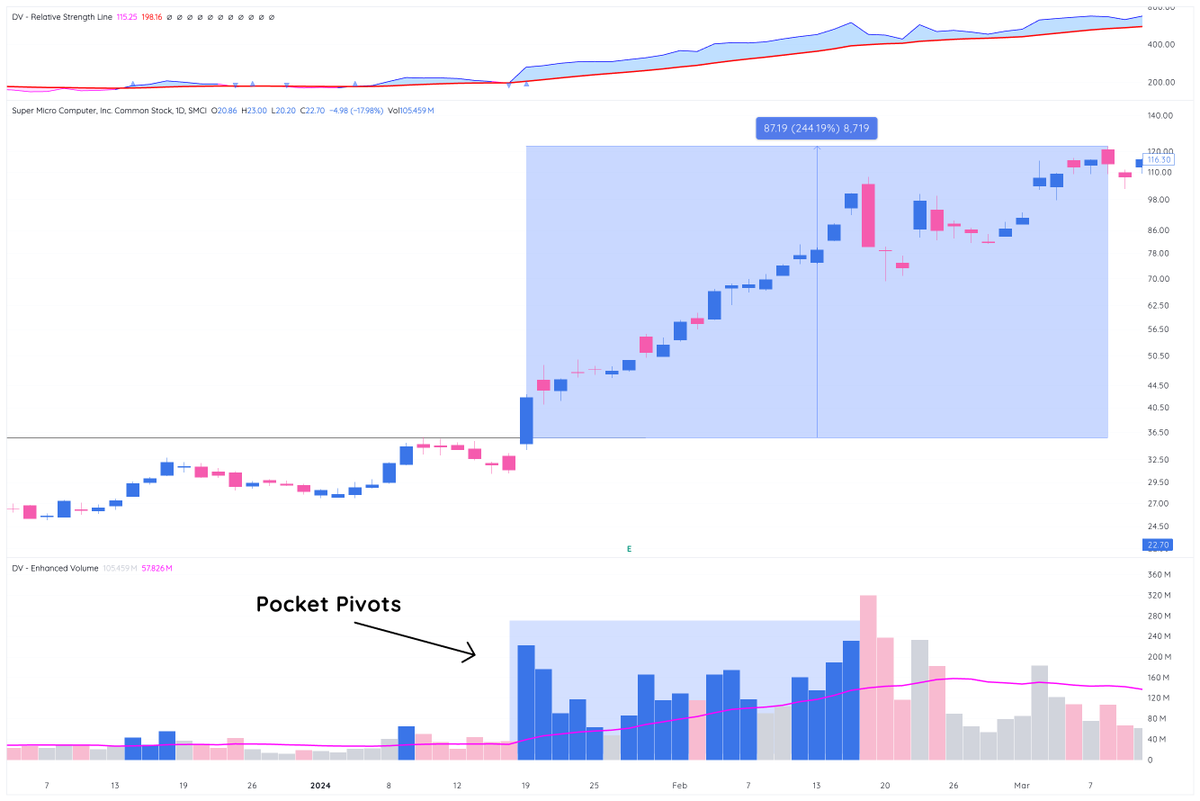
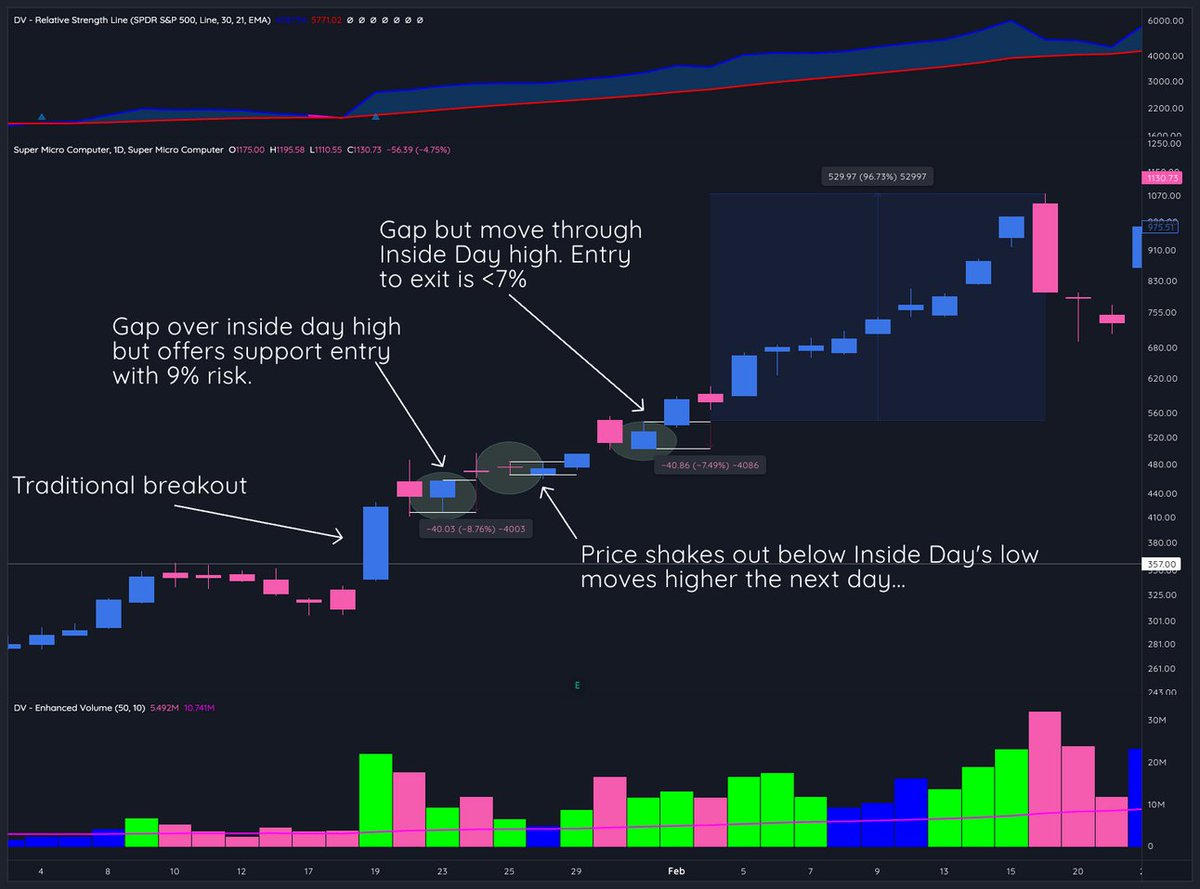
Our next example: $SMCI from the same timeframe, early 2024
Breakout: February 16th, 2024
Inside Days: 3x within the two weeks post breakout
First Inside Day: 2 days post-breakout
Second Inside Day: 5 days post-breakout
Third Inside Day: 8 days post-breakout
Breakout: February 16th, 2024
Inside Days: 3x within the two weeks post breakout
First Inside Day: 2 days post-breakout
Second Inside Day: 5 days post-breakout
Third Inside Day: 8 days post-breakout
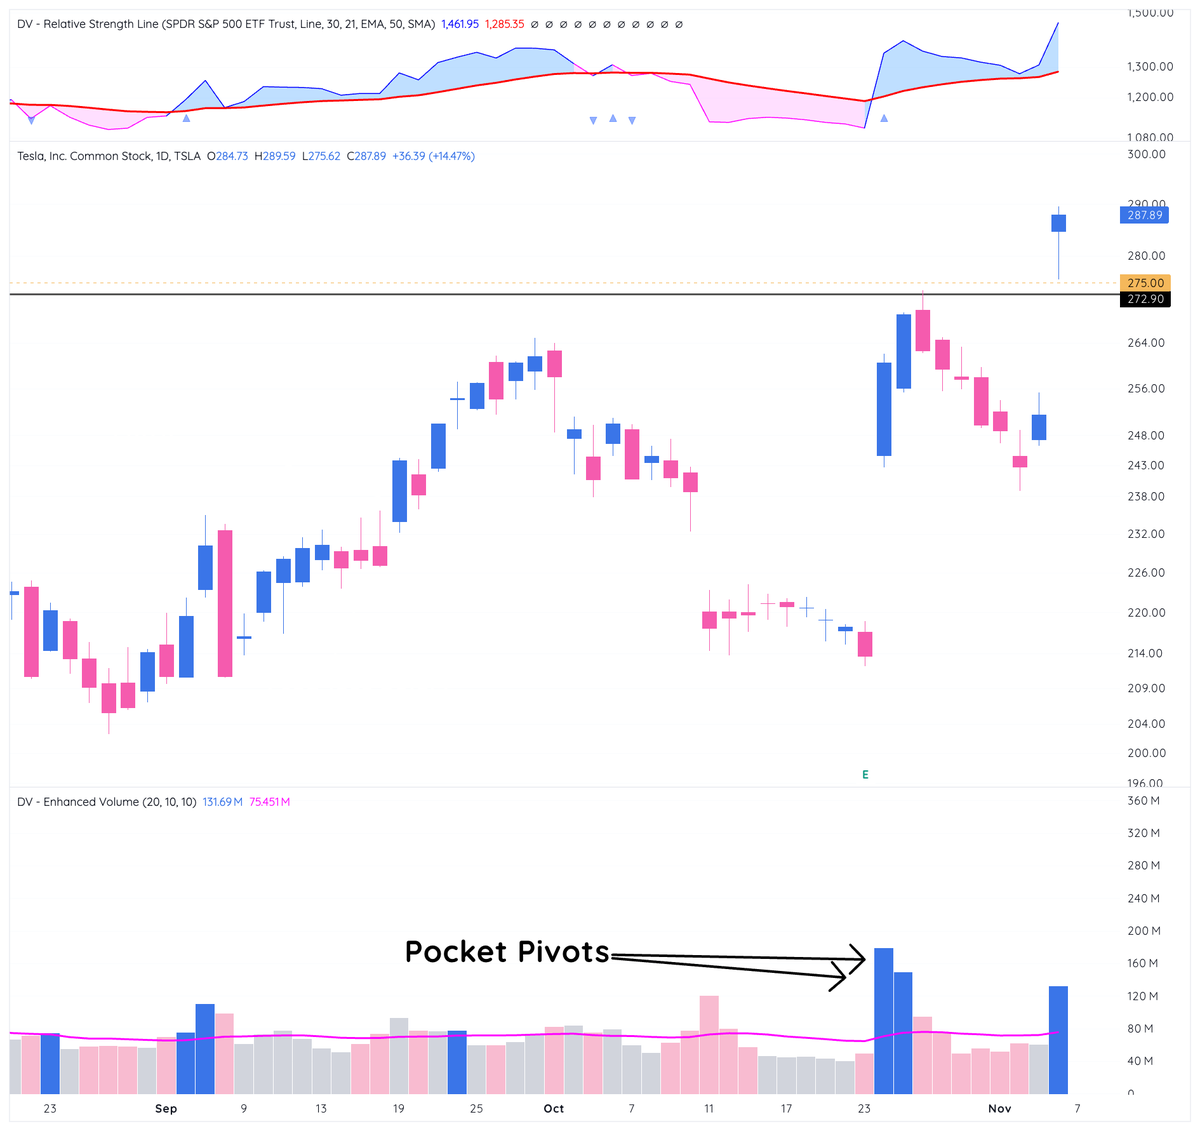
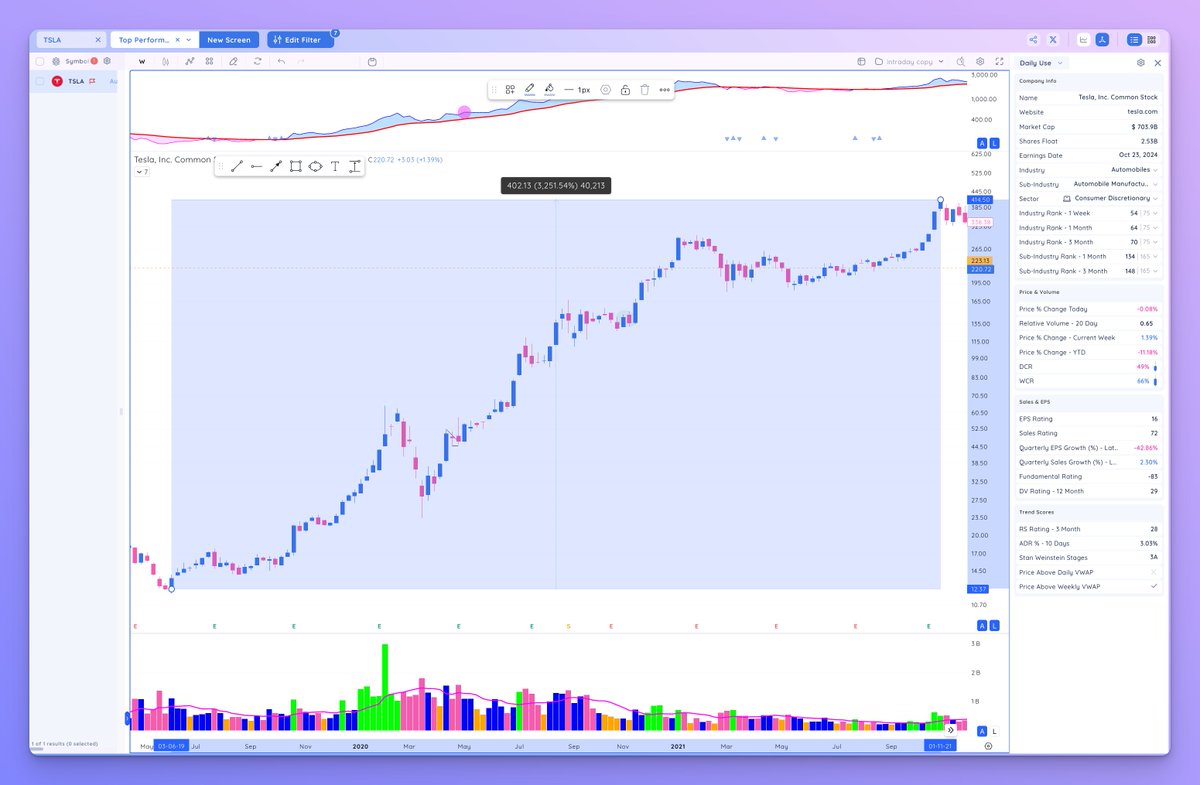
Our third example: $CLSK
With this example, you can see that price hadn't necessarily broken out of a beautiful, multi-month base as it did with $NVDA or $SMCI.
This goes to show that you can implement this setup on less than traditional patterns.
With this example, you can see that price hadn't necessarily broken out of a beautiful, multi-month base as it did with $NVDA or $SMCI.
This goes to show that you can implement this setup on less than traditional patterns.
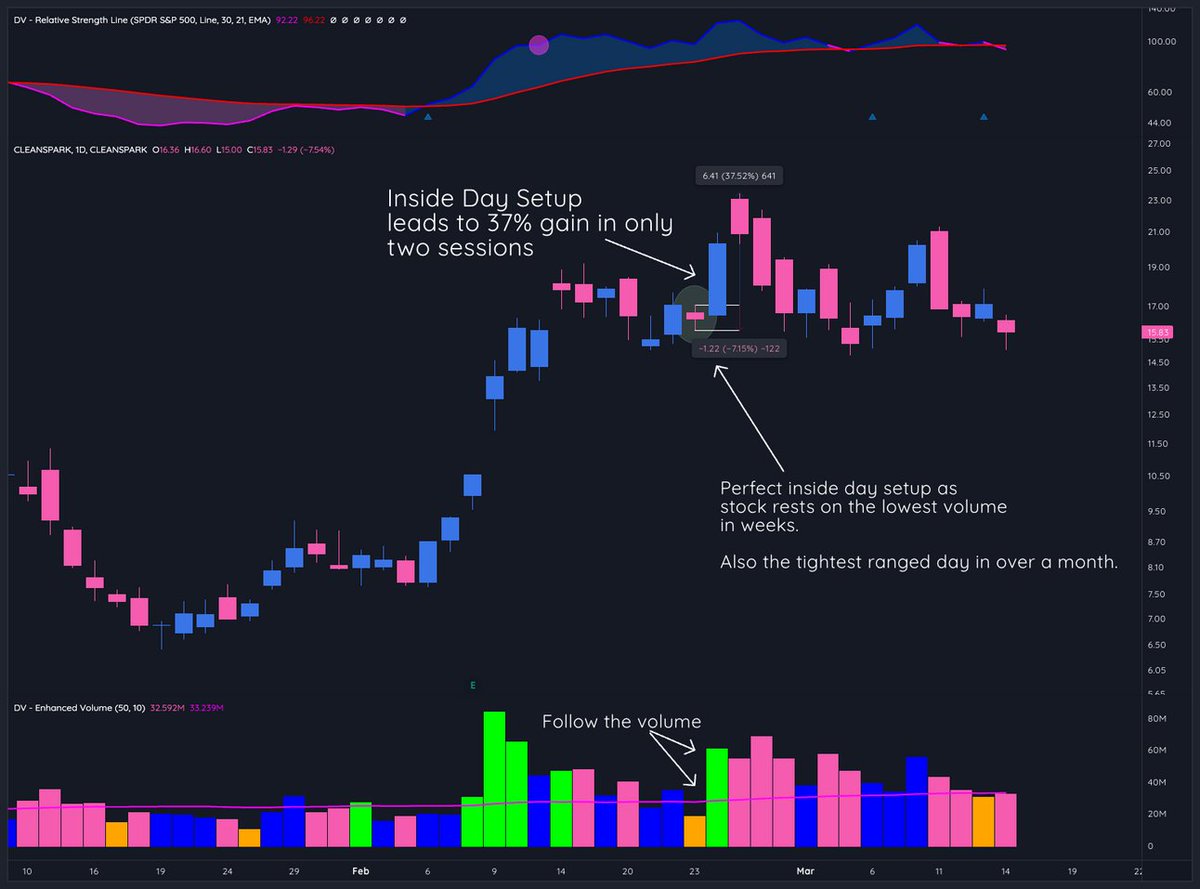
It also goes to show that sometimes the Inside Day setup doesn't turn into a move that lasts weeks to months!
You have to know the character of the stock you're trading, the price action to the left on the chart, and the overall market environment.
You have to know the character of the stock you're trading, the price action to the left on the chart, and the overall market environment.
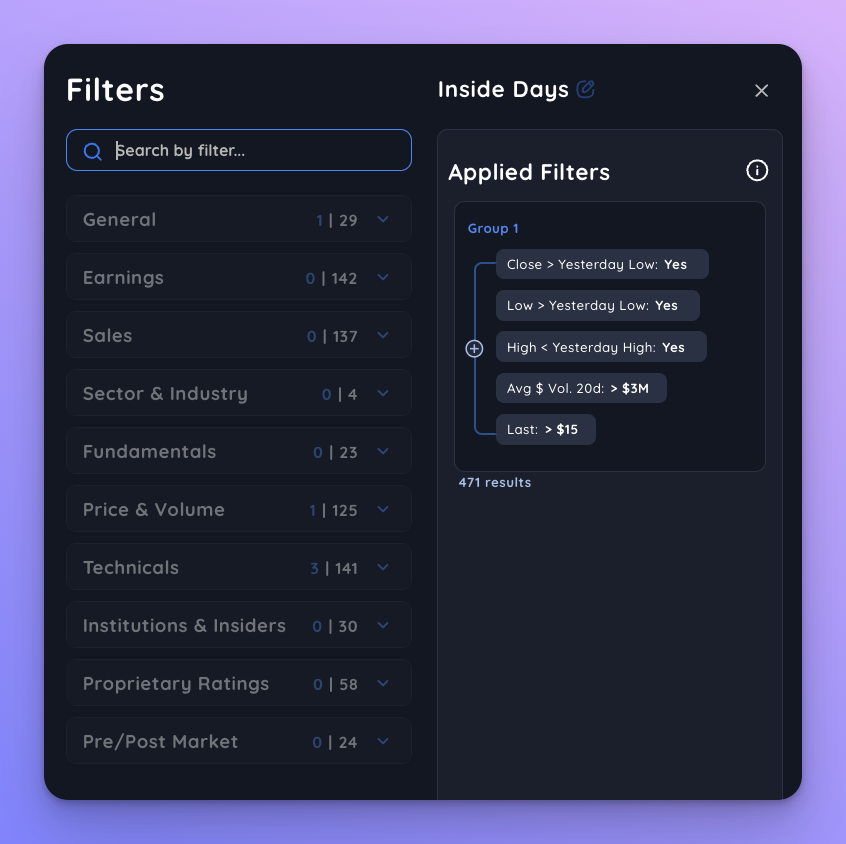
Now that we've covered some examples, let's take a look at how you can regularly find and trade this setup using @Deepvue
Same criteria we outlined above, plus a liquidity filter of avg. $3M Dollar Volume over the past 20 days.
471 results to study this weekend.
Same criteria we outlined above, plus a liquidity filter of avg. $3M Dollar Volume over the past 20 days.
471 results to study this weekend.
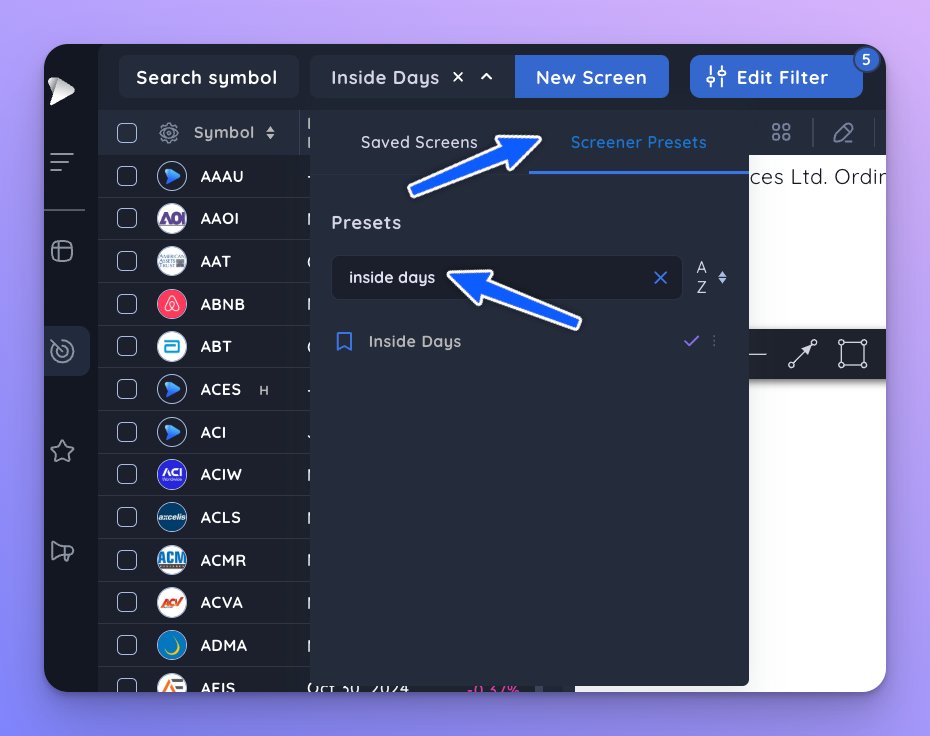
@Deepvue If you're a Deepvue member, you can easily run this scan by going to Screener, Presets, and then searching "inside day".
The scan will show up and you can run through the results easily.
The scan will show up and you can run through the results easily.
@Deepvue So to review, the Inside Day setup occurs when today's price is within yesterday's high/low.
You can enter/exit using the inside day highs/lows OR the previous day's high/low.
Study up and get ready to trade one of the most reliable patterns in the market. 🙏
You can enter/exit using the inside day highs/lows OR the previous day's high/low.
Study up and get ready to trade one of the most reliable patterns in the market. 🙏
@Deepvue Boom! There you go.
One simple setup to study this weekend so that you're ready to capture late stage momentum next week.
If you learned anything from today's post...
1) Follow us @TraderLion_ for more on a weekly basis.
2) Share the tweet below with another trader ↓
One simple setup to study this weekend so that you're ready to capture late stage momentum next week.
If you learned anything from today's post...
1) Follow us @TraderLion_ for more on a weekly basis.
2) Share the tweet below with another trader ↓
https://twitter.com/1485052376/status/1865382390752854290
• • •
Missing some Tweet in this thread? You can try to
force a refresh