Ziad 😷 Fazel 🇺🇦 Profile picture
Dec 22 5 tweets 4 min read Read on X
Alberta is projected to have its worst influenza vaccine coverage since 2010-2011.

9 weeks into this year's flu shot campaign, we're at 19%. Last year, we were at 23%.

This whole season's coverage projects to 22%.
• last yr 25%
• 2011/12 was 23%

alberta.ca/stats/dashboar…Line graph of cumulative weekly immunizations showing at week 50 of this year's campaign (9 weeks in) 929,380 shots administered so far, which is only 90% of last year's 1,037,278 at the same time.
Line graph of cumulative weekly immunizations showing at week 50 of this year's campaign (9 weeks in) the coverage for all ages is 18.9%
Line graph of cumulative weekly immunizations showing at week 50 of last year's campaign (9 weeks in) 1,037,278 shots administered so far
Line graph of cumulative weekly immunizations showing at week 50 of last year's campaign (9 weeks in) the coverage for all ages was 22.7%.
Seniors 65+, at week 50, 9 weeks into the campaign:
• This year, only 49.2% coverage.
• Last year, 59.4% coverage.

LaGrange's arrogant, deceptive decision to cut off community medical clinics obviously figures largely in this drop.

cbc.ca/news/canada/ca…2024 vaccine coverage for certain ages at week 50, showing only 49.2% for age 65+
2023 vaccine coverage for certain ages at week 50, showing 59.4% for age 65+
Both last year and this year, peak weekly flu shots administered was in week 42:
• This yr, only 243,207
• Last yr, 330,264

Many of us are now off from school or work for the Xmas holidays. Good time to get vaccinated. It should help you for January return to school or work. Column graph of weekly flu shots administered, showing in week 42: • This yr, only 243,207
Column graph of weekly flu shots administered, showing in week 42: • Last yr, 330,264
Table of Influenza vaccine doses administered and coverage by season and provider, showing: • 2010-2011 was 20% • 2011-2012 was 23% • 2023-2024 (last year) was 25% • 2024-2025 to data at week 50 only 19%
In October, I warned that Lagrange was "benchmarking to the worst".

Kenney, and every AB Health minister since Shandro does that, which results in a downward spiral to a new worst.

Now we're under 90% of last year.

@TimmCTV @shoffmanAB @drDavidKeegan

threadreaderapp.com/thread/1849659…
@threadreaderapp unroll please

• • •

Missing some Tweet in this thread? You can try to force a refresh
 

Keep Current with Ziad 😷 Fazel 🇺🇦

Ziad 😷 Fazel 🇺🇦 Profile picture

Stay in touch and get notified when new unrolls are available from this author!

Read all threads

This Thread may be Removed Anytime!

PDF

Twitter may remove this content at anytime! Save it as PDF for later use!

Try unrolling a thread yourself!

how to unroll video
  1. Follow @ThreadReaderApp to mention us!

  2. From a Twitter thread mention us with a keyword "unroll"
@threadreaderapp unroll

Practice here first or read more on our help page!

More from @ZiadFazel

Dec 23
In Alberta, babies under 1 year old are getting clobbered by Respiratory Syncytial Virus (RSV), and it is overloading our children's hospitals:
• Hospitalized at 36x the rate of average Albertan
• Hospital & ICU at 3x rate of COVID in babies under 1

alberta.ca/stats/dashboar…Line graph and table of Total hospital admissions, ICU admissions, and deaths among laboratory-confirmed RSV cases in Alberta by age group, 2024-2025
Line Graph and Table of Total hospital admissions, ICU admissions, and deaths among laboratory-confirmed COVID-19 cases in Alberta by age group, 2024-2025
Typical LaGrange-style quote in reporting by @JenLeeCBC:

"In a statement emailed to CBC News, a spokesperson said the hospital is seeing an increase in respiratory admissions, which "aligns with seasonal trends.""

Likely untrue, despite the vagueness.

cbc.ca/news/canada/ca…
Expecting mothers should speak with their family physician or obstretician (like @FionaMattatall) about getting vaccinated during their pregnancy to protect their newborns. (I'm not a doc)

RSV shots are $1000 each, but perhaps other immunizations.

cbc.ca/news/canada/ca…
Read 5 tweets
Dec 18
3-min video posted 31 Oct 2024 by Liricom & Plenary shows what they expect provincial taxpayers to build + operate for them between airport & "Grand Central Station".

For free.
/h @project_calgary

@DruhFarrell @TheBreakdownAB @CWalcottYYC @jasmine_mian

Before I get into pros and cons, let me just help you figure out their bizarre colours:
🟧 for Calgary Airport Downtown Express track that is at grade or in the 80th Ave tunnel
🟦 Teal (close enough) for stations
🟨 for track that is elevated from Bow River near zoo to Crowchild
Why does it need to be elevated from south shore of Bow River near Zoo, to Downtown West End before Crowchild?

Because CPKC wouldn't let them stay parallel at grade though downtown. Needed to be elevated to not interfere with freight loading/unloading at grade.

"Seamless". Image
Read 6 tweets
Dec 16
When UCP claims their elevated track & station #GreenlineYYC design through Beltline into Downtown is better than tunnels, but🚩won't release a single rendering, others will.

😱

Visit @yycbeltline web page, where each image is labelled. You barely recognize the streets after.
@yycbeltline Beltline Neighbourhoods Association tries to recreate Dreeshen's claim that only one "non-driving lane" on 10 Av would be affected (after multi-year construction probably closes the whole street) by rendering only a single column for the track and two columns for station.
@yycbeltline They use structural designs from Sunalta, which is 15 m above ground, but have to render two columns straddling reduced 10 Ave to support Beltline station.

Sunalta station is supported by an enclosed building, with interior stairs, escalators & elevator.

gecarchitecture.com/projects/sunal…
Read 10 tweets
Dec 13
Confirmation GoA's plan for Green Line into downtown is terrible:
• no press conf
• nowhere in press release do they state where it crosses the rail tracks, or meets 7 Ave
• only 1 high level map - no renderings or closeup on downtown
• no AECOM quote

alberta.ca/release.cfm?xI…Screenshot of bottom of press release where you would normally see multimedia or backgrounder. Instead, "Related Information" only has  "map of proposed downtown elevated route".
1-page PDF with 2 maps on it - previous route and GoA proposal - that are so small and high level you cannot see the "map of proposed downtown elevated route" as touted in the press release link.
@TheBreakdownAB @GregGinYYC @DuaneBratt @CWalcottYYC @jasmine_mian @JyotiGondek @cspotweet @AdamMacVicar @LiveWireCalgary @GreenLineYYC Rick Bell's "exclusive" claims the crossing into downtown is at 2nd Street SW, but I refuse to link to that propaganda. @LiveWireCalgary has always provided excellent, deep journalism on #GreenLine and they confirms the crossing AND the cheap blindside.

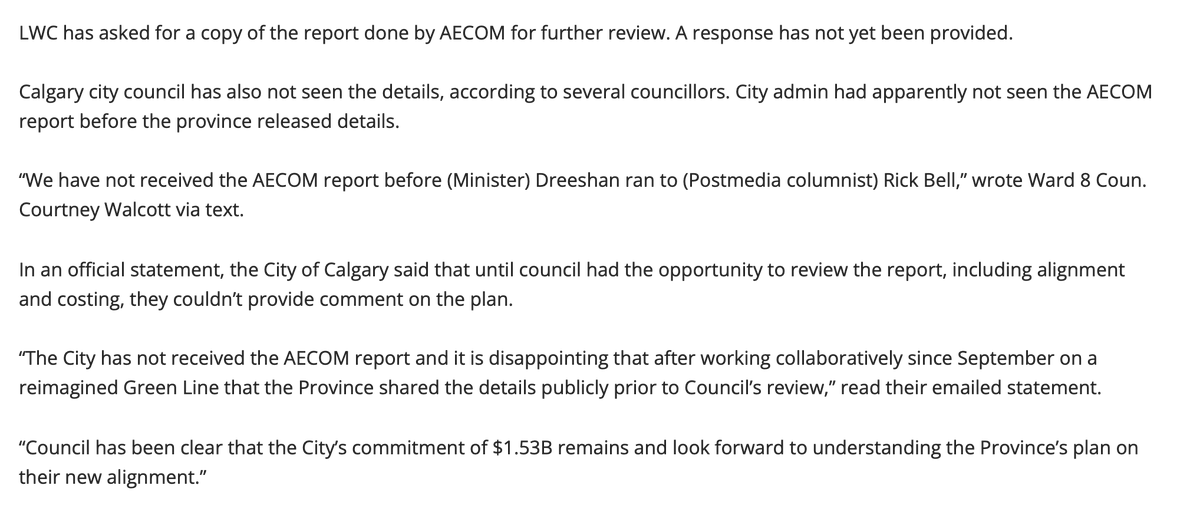
livewirecalgary.com/2024/12/13/pro… LWC has asked for a copy of the report done by AECOM for further review. A response has not yet been provided.  Calgary city council has also not seen the details, according to several councillors. City admin had apparently not seen the AECOM report before the province released details.  “We have not received the AECOM report before (Minister) Dreeshan ran to (Postmedia columnist) Rick Bell,” wrote Ward 8 Coun. Courtney Walcott via text.  In an official statement, the City of Calgary said that until council had the opportunity to review the report, including alignment and costing, they coul...
@TheBreakdownAB @GregGinYYC @DuaneBratt @CWalcottYYC @jasmine_mian @JyotiGondek @cspotweet @AdamMacVicar @LiveWireCalgary @GreenLineYYC Some quick work with Apple Maps 3D views shows crossing into downtown at 2 St SW requires:
• elevation over a circular ramp and vehicle bridge across the tracks to parkade
• crossing two Plus 15 pedways
• a third Plus 15 medway just north of 7 Ave

calgary.ca/content/dam/ww… 3D map view of crossing into downtown and proposed station at 7 Av and 2 St SW
3D satellite view of crossing into downtown and proposed station at 7 Av and 2 St SW
Calgary Plus 15 map where I have circled the crossing into downtown as well as the proposed station location from https://www.calgary.ca/content/dam/www/transportation/roads/documents/road-maintenance/plus-15-skywalk-network-map.pdf?noredirect=1
Read 11 tweets
Dec 6
With PFC film members leaving Xitter, in last week's PFC, I promised to look into a shared calendar to potentially replace this Community.

Fiona (or anyone else we decide) can create a Google Calendar just for PFC, and share it with specific people.

🧵

support.google.com/calendar/answe…"Share a calendar with specific people" section from link.
My concern about privacy, like everyone's email address shared with everyone else in the group, have been resolved with the oddly-named "See all event details" access permission, which doesn't even show the guest list.

But there are still other privacy concerns I want to check. "Control access to your calendar & individual events" table from link.
Obviously, the owner of the shared calendar would have to know the email addresses of the PFC members who want to subscribe to it.

I don't know if any one of the subscribers can see who the other subscribers are, or their email addresses.
Read 6 tweets
Nov 23
Curious anomalies in Alberta stats on Health Canada's Medical Device Incidents & Serious Adverse Drug Reactions dashboard.

Superficially unremarkable, but you know I drill down. 🧵

@Jantafrench @MBellefontaine @markusoff @PattiSonntag @picardonhealth

health-infobase.canada.ca/hospital-adver…Map of Canada showing reports by jurisdiction, with Alberta 3,968 not looking too far out of line at 14% of Canada's 28,301 people.
Map of Canada showing rate of reports per 100K people, by jurisdiction, with Alberta 81.17 slightly worse than Canada's 81.17.
See the ALT text in my map screenshots above.

Alberta slightly higher than Cdn average in ALL reports per 100K, but still in the pack.

But when you separate Serious Adverse Drug Reaction (Serious ADR) from Medical Device Incident (MDI), the stats get weird. Summary table of rate per 100K of all reports by province or territory, separated into ADR and MDI reports, Showing Canadian average of 69, with Alberta slightly higher at 81.
Alberta reports 3,269 out of Canada's 7,190 Medical Device Incidents. A whopping 45% from ~ 12% of the population.

Per 100K people, Alberta is by far highest in Canada at 67, nearly 4x the national rate.

These stats are since 16 Dec 2019, so are heavily affected by pandemic. Image
Read 10 tweets

Did Thread Reader help you today?

Support us! We are indie developers!


This site is made by just two indie developers on a laptop doing marketing, support and development! Read more about the story.

Become a Premium Member ($3/month or $30/year) and get exclusive features!

Become Premium

Don't want to be a Premium member but still want to support us?

Make a small donation by buying us coffee ($5) or help with server cost ($10)

Donate via Paypal

Or Donate anonymously using crypto!

Ethereum

0xfe58350B80634f60Fa6Dc149a72b4DFbc17D341E copy

Bitcoin

3ATGMxNzCUFzxpMCHL5sWSt4DVtS8UqXpi copy

Thank you for your support!

Follow Us!

:(