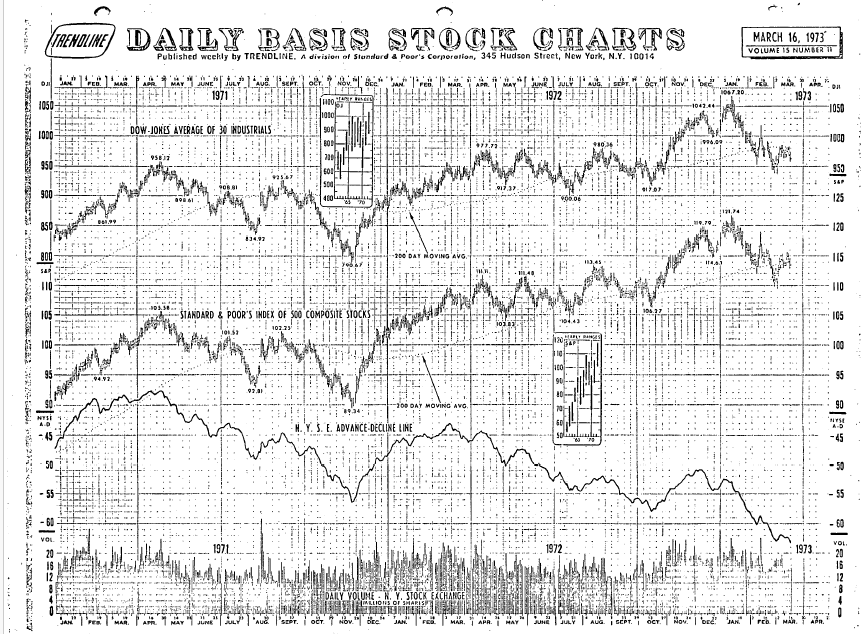
1/10 I’m becoming more and more concerned by how the market resembles 1972, when the Nifty 50 one-decision growth stocks, heavily-weighted in the averages, went up but almost nothing else did. Because that one didn’t end well at all.
2/ Why focus on the Nifty 50 and not the dot com bubble in 2000? Because the Nifty 50 had earnings -- past, present and future. Most dot com stocks didn’t. 

3/ This is how “the market” looked in early 1973. Note the new all-time high in the averages and the massive non-confirmation by the advance-decline line. 

5/ This is how I saw it at the time: deemermarketmemos.com/archive/1970s/…
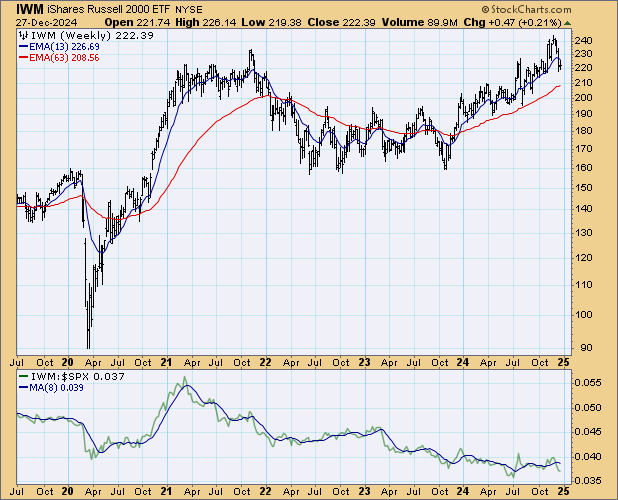
6/ That 1972 episode is why I’m more and more concerned by the continued non-participation of the Russell 2000. 

7/ It seems to me there are just two alternatives: 1) The R2K finally joins the party or 2) It keeps on ignoring the “strength” in the S&P 500. If the latter is the case, I don’t see how the story can end well. The R2K chart may thus be the most important chart of all to watch here.

8/ But if the bad alternative wins out, just when and how does the story end? Regrettably, that’s something we’ll know only in the fullness of time; trends like these can persist for a long time if they want to.
9/ Also, there’s one huge difference between now and 1972: Speculative activity was virtually non-existent then (after boiling during the go-go years, 1968-69) but is running wild now. (See the most active lists/meme-coins). That’s not a positive, but when and where it becomes a negative is something else we’ll know only in the fullness of time.
END/ The bottom line: The most bullish thing that could happen here: The Russell 2000 rallies to a decisive new high and takes that ominous 1972 analogy out of play. (And whether the R2K strength comes at the expense of the MAG 7 matters not to me.)
• • •
Missing some Tweet in this thread? You can try to
force a refresh


