
MBH98 features its famous hockey stick graph in two figures. By mistake, an older version of the reconstruction was actually used for one of the figures.
I like a good puzzle so decided to do some reverse engineering on the "old" MBH98 reconstruction. 🧵
I like a good puzzle so decided to do some reverse engineering on the "old" MBH98 reconstruction. 🧵
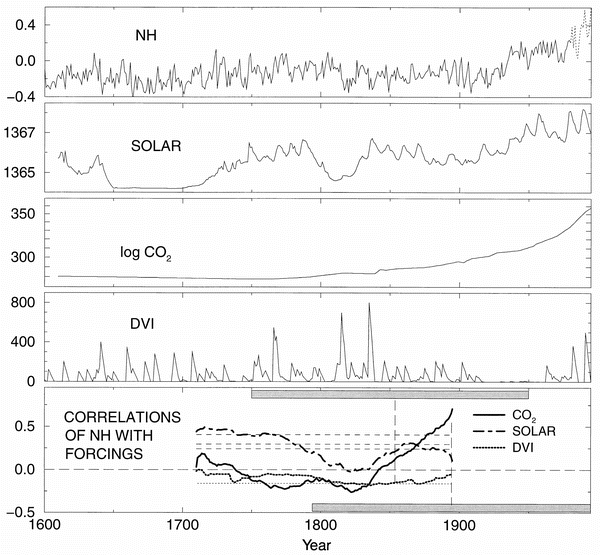
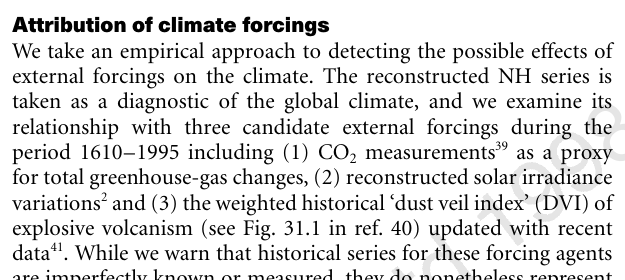
MBH98 uses the old reconstruction for signal detection. Since the forcing data begins in the early 1600s, only the post-1600 portion of the reconstruction is shown in the paper.
The goal of this thread is to reproduce that part of the reconstruction and then extend it.
The goal of this thread is to reproduce that part of the reconstruction and then extend it.
The post-1760 portion also appears in an earlier paper by Mann and Bradley (MB98). This paper will be useful.

Figure 1 of MB98 shows a map of 62 proxies from 58 locations.
Let's start by identifying these proxies. We can make use of the fact that in periods with constant sample depth, the temperature reconstruction is a linear combination of the underlying proxy records.
Let's start by identifying these proxies. We can make use of the fact that in periods with constant sample depth, the temperature reconstruction is a linear combination of the underlying proxy records.

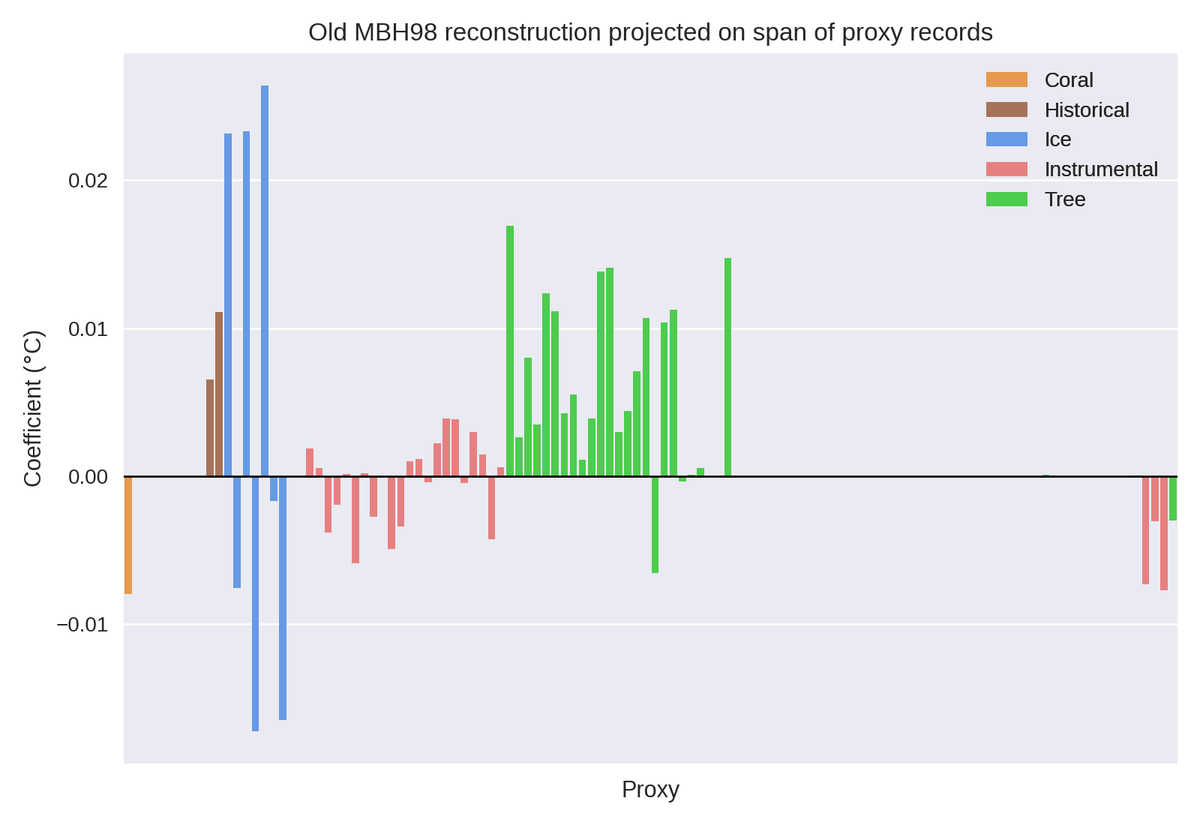
All MBH98 proxies have data back to 1820, so let's project that part of the old reconstruction on the final set of 112 proxies. To get a perfect fit, we must also include a few "dirty laundry" series.
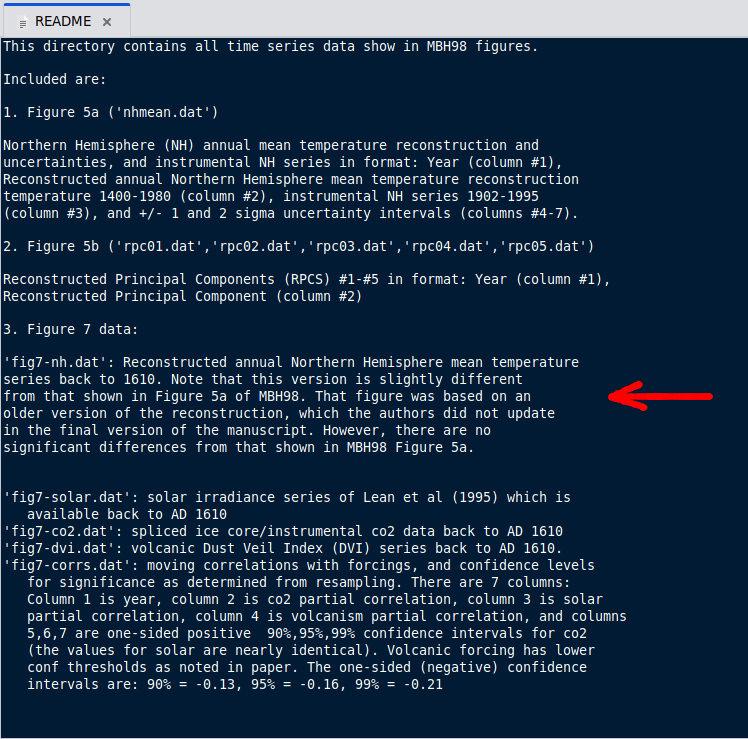
The proxy data is available on @ncdave4life's website: sealevel.info/FOIA/2009/FOIA…
The proxy data is available on @ncdave4life's website: sealevel.info/FOIA/2009/FOIA…

The coefficients indicate that 59 proxy records were used. They are a subset of the 62 proxies marked on the map. The three unused proxies are coral records from the Galapagos Islands, the Great Barrier Reef and Espiritu Santo.
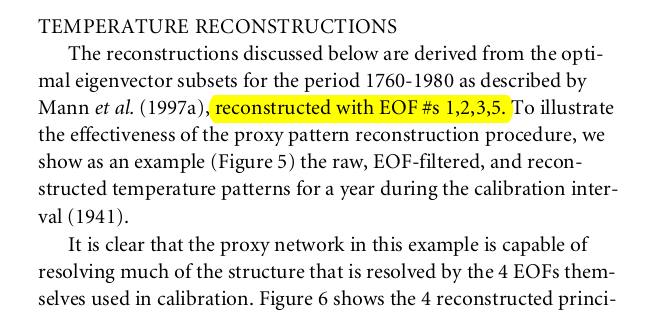
So we know which proxies were used. MB98 also specifies which temperature principal components were used to calibrate the proxies. But the MBH98 algorithm doesn't produce the old reconstruction from this input. At least not with default settings...

The fact that 62 proxies are shown in MB98 but only 59 have nonzero coefficients suggests that the proxies were weighted (i.e. scaled after standardization), with zero weight assigned to the three unused coral records.

Weighting of proxies was a non-default setting in the MBH98 computer program and wasn't used for the final reconstruction.
As an aside, for their emulation of MBH98, Wahl and Ammann didn't use weights either and called it a "significant methodological simplification." 🤨
As an aside, for their emulation of MBH98, Wahl and Ammann didn't use weights either and called it a "significant methodological simplification." 🤨
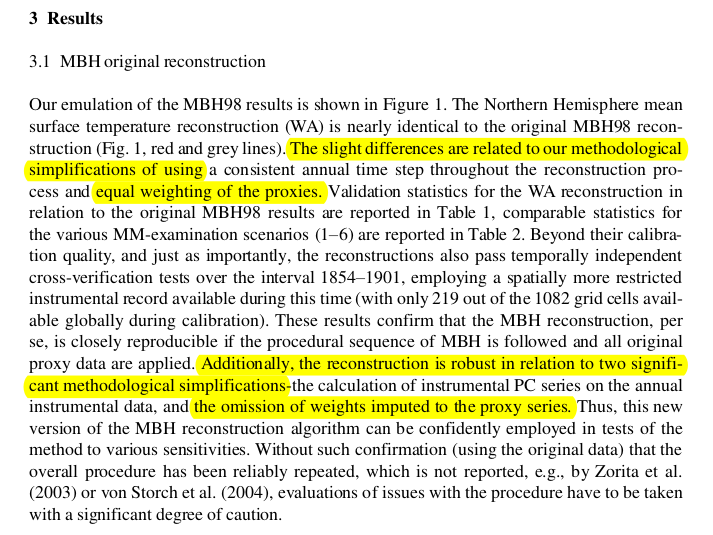
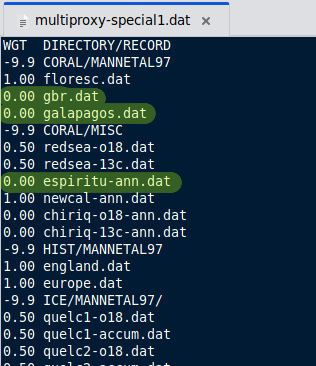
Curiously, a file in the mbh98-osborn archive assigns zero weight to the three unused coral records, but the reconstruction isn't reproducible using these weights. We'll need to reverse engineer the correct values.

A standard nonlinear least-squares solver (Levenberg-Marquardt algorithm) finds the approximate weights in a few iterations. 👍
With the proxy weights successfully extracted, the emulation is exact back to 1760.
MB98 doesn't specify which temperature PCs were used further back, so we'll reverse engineer this as well. More linear algebra...
MB98 doesn't specify which temperature PCs were used further back, so we'll reverse engineer this as well. More linear algebra...

The reconstruction is a linear combination of the proxies, but also of the columns of PW²P₀ᵀU₀, where P is the proxy matrix, P₀ is the calibration-period submatrix of P, W is the weight matrix and U₀ is a matrix of temperature PCs.
See @ClimateAudit: climateaudit.org/2008/04/05/squ…
See @ClimateAudit: climateaudit.org/2008/04/05/squ…
By projecting the reconstruction on the column space of PW²P₀ᵀU₀ over periods with constant sample depth, we see which temperature PCs were used.


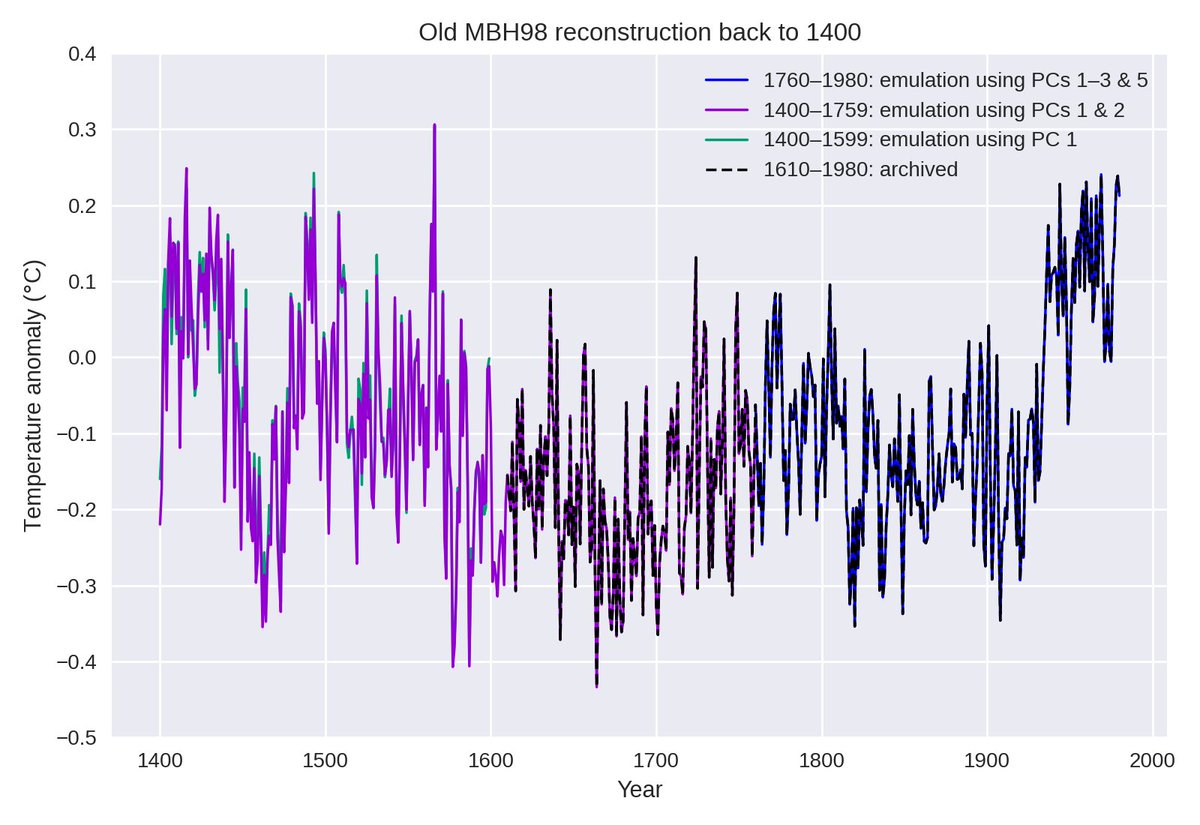
Temperature PCs 1, 2, 3 and 5 were used back to 1760, as stated in MB98 and as we have seen. For the period 1610–1759, only the first two PCs were used. With these PC selections, the emulation is exact back to 1610, which is when the archived data begins.

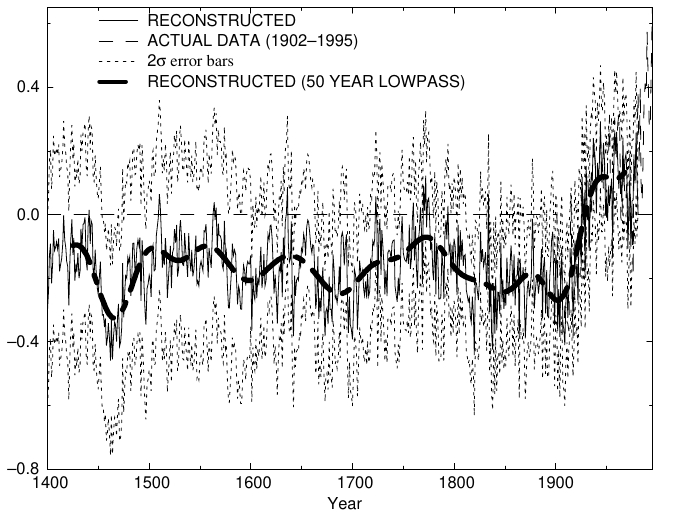
Comparing with Figure 7 of MBH98, the emulation looks accurate back to 1600 as well.

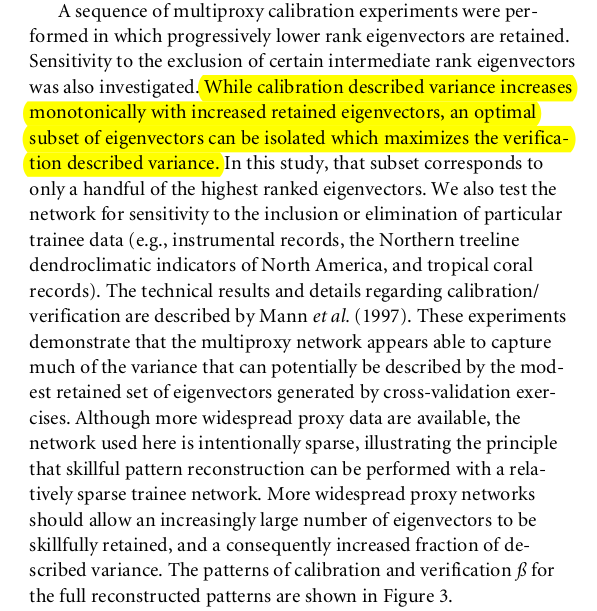
MB98 states that the reconstruction is highly skilful back to 1450. Judging by the proxy map, 1400 might be the actual start year.


To extend the emulation, we again need to know which temperature PCs to reconstruct. According to the algorithm description, the number of retained PCs decreases back in time, so let's keep one or two PCs for the period before 1600.
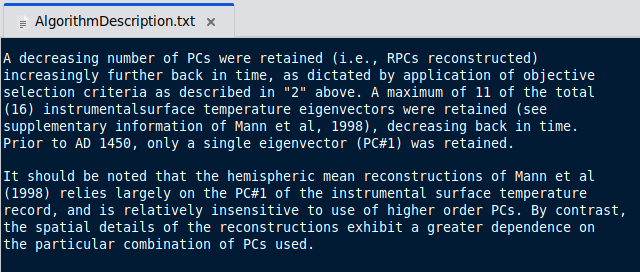
Here is the emulation back to 1400.
Whether one or two temperature PCs are used, the early and late 1400s are about as warm as the modern end of the reconstruction. The warmest year is 1566.
Whether one or two temperature PCs are used, the early and late 1400s are about as warm as the modern end of the reconstruction. The warmest year is 1566.
This obviously changed when the proxy weights were dropped, and questionable bristlecone pine chronologies were added to the proxy network and mined for by the peculiar PCA method.
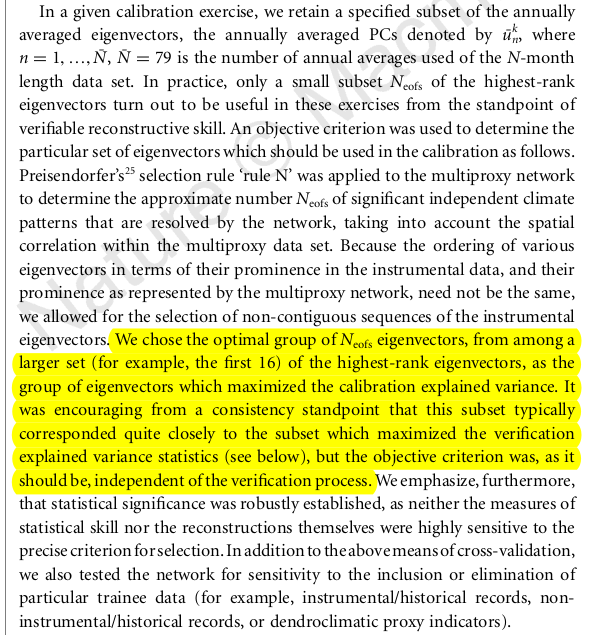
As a final note, it may or may not be possible to work out which PCs were selected for the earliest period. MB98 gives a brief description of the selection rule and refers to MBH98 for the details, but MBH98 gives a different rule. What rule they really used is anyone's guess.
• • •
Missing some Tweet in this thread? You can try to
force a refresh


