Anup Malani Profile picture
Jan 25 9 tweets 2 min read Read on X
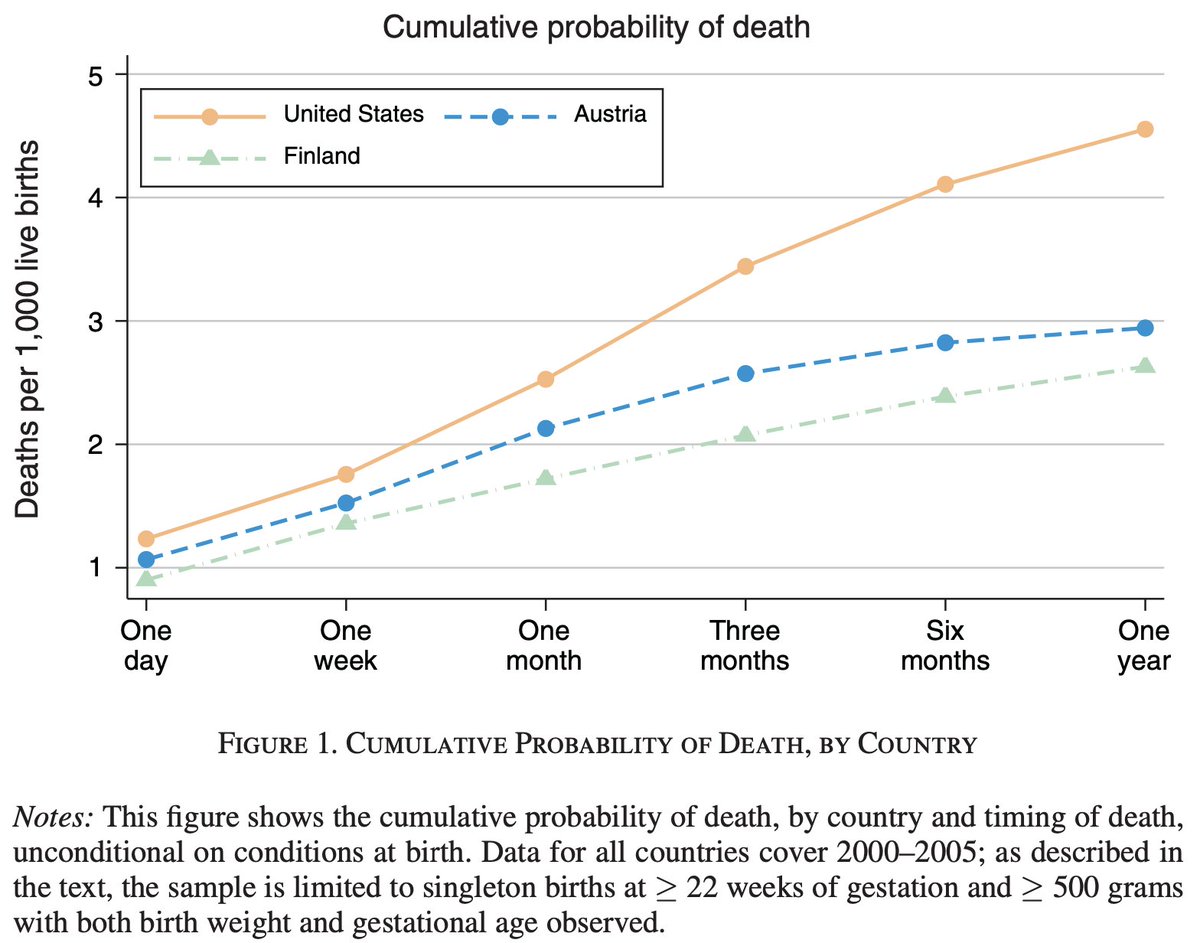
Single most under-appreciated chart for understanding health insurance policy in the US.

Uninsured typically pay less than $5k out of pocket for care, regardless of their bill.

So, even without formal health insurance, ppl effectively have a $5000 deductible insurance policy. Image
The reason is

1/ the govt requires hospitals treat people before billing them (EMTALA)

2/ the threat of bankruptcy (incl exemptions) gives people bargaining power to negotiate down these bills (debts)
You don’t have to go into bankruptcy to do this. Most debts are marked down without bankruptcy. Fair debt collection laws help reduce the burden of this process.

All this means EMTALA + bankruptcy is a substitute for insurance. So demand for & enrollment in insurance is low.
Don’t feel to sorry for the hospitals. Hospitals exaggerate debt by inflating list prices. Plus the govt subsidizes hospitals likely to have a lot of bad debt via DSH payments.
Unsurprisingly, when the govt reduced uncompensated care by hospitals by expanding Medicaid in the ACA, they also cut back DSH payments. They weren’t necessary.
Once you understand this chart and its causes, you can see why the 2 largest health insurance experiments in the US found minimal health benefits from insurance. (RAND found only the very poor benefit, Oregon found only peace of mind effects.)
The chart also helps explain why the ACA had insurance mandates. It wasn’t adverse selection causing people to go without care. It was about financing. The govt wanted low risk (young people) to pay more, rather than existing (high income) tax payers to fund high risk patients.
Chart comes from @nealemahoney

pubs.aeaweb.org/doi/pdfplus/10…
@cremieuxrecueil @ATabarrok

• • •

Missing some Tweet in this thread? You can try to force a refresh
 

Keep Current with Anup Malani

Anup Malani Profile picture

Stay in touch and get notified when new unrolls are available from this author!

Read all threads

This Thread may be Removed Anytime!

PDF

Twitter may remove this content at anytime! Save it as PDF for later use!

Try unrolling a thread yourself!

how to unroll video
  1. Follow @ThreadReaderApp to mention us!

  2. From a Twitter thread mention us with a keyword "unroll"
@threadreaderapp unroll

Practice here first or read more on our help page!

More from @anup_malani

Jan 26
Two important charts for understanding why US lags Europe in longevity.

1/ It's behavior, not healthcare: US infant mortality is higher in the months after a baby goes home from the hospital. Suggesting it's at-home behavior, not bad healthcare that is responsible. Image
2/ The gap is driven by less-educated or lower economic status populations in the US. Being high status in the US is akin to being high status in Europe.

Source: Alice Chen, @ProfEmilyOster, @heidilwilliams_ Image
More evidence that it's behavior and not health care is that the gap arises among those with normal birthweight.

Among those with low birthweight--the people who need healthcare--there is no US-Europe mortality gap. Image
Read 6 tweets
Nov 19, 2024
***New working paper alert***

With Ari Jacob, I present a new measure of the # of surviving children per female over time & across countries.

It shows slower decline globally than total fertility rate (TFR).
Show remarkable stability within countries over time.

@_alice_evans Image
TFR measures number of kids each female has. But not all kids survive.

We create a measure called effective fertility which is roughly:
TFR x probability of survival.

Survival is measured either through reproductive years (EFR-R) or theough working years (EFR-L).

@lymanstoneky
Read 12 tweets
Jan 4, 2023
I'm teaching microeconomics this quarter & frame the class as policy-relevant by discussing different methods of allocating scarce resources.

The purpose is to stop students from immediately going from mkt failure --> govt intervention. Instead...
I want them to compare mkt allocation to non-market methods, incl public ones by first specifying the alternative method & then discussing how it compares to mkts. Trashing mkts is easy, specifying better alternative is hard.
Obviously I start w/ (competitive) mkts. Instead of just saying the alternative is govt allocation, I give a bunch of different public & private mechanisms, using examples.

Here are my examples. What are yours? @BrianCAlbrecht @mattkahn1966 @ethanbdm @JustinWolfers
Read 7 tweets
Jan 3, 2023
Teaching microeconomics today & explained Friedman point that econ, unlike eg biology, seeks a parsimonious predictive model rather than a descriptively accurate one.

But raises a q: as cost of info & processing power falls, should economics use a more complex base model?
The way I explain it is that predictive power (of a model for human behavior) is an increasing, concave function of complexity (eg number of variables k). Cost of complexity is increasing and complexly. Suggests an optimal complexity point where slope of power = slope of cost.
But as cost curve shifts down w technology, optimal model is more complex. Yet we kind of teach the same price theory model as Friedman in 1946.

One answer could be that Samuelson’s mathematical path is the optimal one.
Read 4 tweets
Jul 23, 2022
Research involves a *lot* of admin costs that reduce scientific productivity. Here are 8 ways to reduce this (especially in economics), with little cost to journals or grantors. We should pressure organization to make these changes....
But first, this thread is inspired by a @salonium post at @WorksInProgMag. Also H/T @MargRev.

worksinprogress.co/issue/real-pee…
1/ Journals should adopt a common manuscript format for submissions (borrowing from the common app for college applications). They should specialize formatting AFTER a paper is accepted. Researchers should spend more time researching, less time reformatting for submission.
Read 14 tweets
Apr 6, 2022
What if you could bid to get quicker ref repts for your submission to the peer review journals? At least for econ journals.

Refs would be chosen by editor (not authors), remain anonymous. But payment for completed repts would increase acceptance of invitation & faster review...
Seems like the mechanism economists would like.

Benefits obvious: refs get $$ for time, encourages reviews at a time ppl are complaining abt how hard it is, etc.

Also research is public good w/ inadequate private supply. Why discourage supply w/ 0 or low-price caps on refs?
The cons are inequality and crowd-out.

1/ Inequality

Inequality boat has saled! Richer uni's could pay for higher rept fees. But even if we stop them, they already provide greater research budgets, facilities, networks. That swamps report fees!
Read 6 tweets

Did Thread Reader help you today?

Support us! We are indie developers!


This site is made by just two indie developers on a laptop doing marketing, support and development! Read more about the story.

Become a Premium Member ($3/month or $30/year) and get exclusive features!

Become Premium

Don't want to be a Premium member but still want to support us?

Make a small donation by buying us coffee ($5) or help with server cost ($10)

Donate via Paypal

Or Donate anonymously using crypto!

Ethereum

0xfe58350B80634f60Fa6Dc149a72b4DFbc17D341E copy

Bitcoin

3ATGMxNzCUFzxpMCHL5sWSt4DVtS8UqXpi copy

Thank you for your support!

Follow Us!

:(