Artemis Profile picture
Jan 26 1 tweets 1 min read Read on X
Congrats @JupiterExchange for 50% of fees to buyback $JUP.

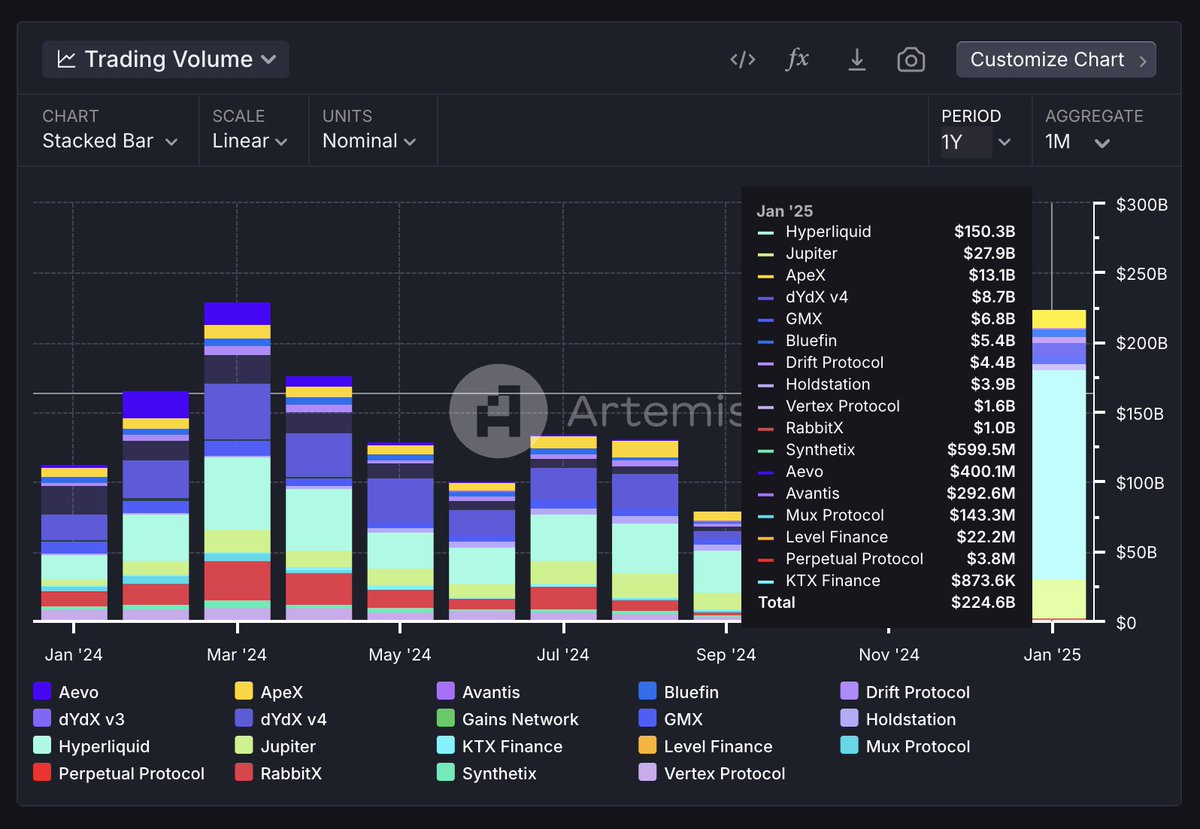
We see on Artemis there's ~$80B of aggregator volume + ~$20B of perp volume per month = ~$100B monthly total volume on Jupiter.

$100B monthly volume * 0.1% * 50% is roughly $600m of annualized buyback.

At $2.4B of circulating marketcap that's roughly 25% of marketcap.

Impressive.Image

• • •

Missing some Tweet in this thread? You can try to force a refresh
 

Keep Current with Artemis

Artemis Profile picture

Stay in touch and get notified when new unrolls are available from this author!

Read all threads

This Thread may be Removed Anytime!

PDF

Twitter may remove this content at anytime! Save it as PDF for later use!

Try unrolling a thread yourself!

how to unroll video
  1. Follow @ThreadReaderApp to mention us!

  2. From a Twitter thread mention us with a keyword "unroll"
@threadreaderapp unroll

Practice here first or read more on our help page!

More from @artemis

Jul 2
$HYPE Hyperliquid has dominated 75%+ of decentralized perps volume and allocated 97% of generated fees to buybacks.

We finished our full deep dive and bull case on Hyperliquid at a $40B FDV.

Here are the key highlights from our research 🧵👇
(1/6) Significant Potential in Spot Market:

Hyperliquid’s on-chain CLOBs and Hyper Unit protocol uniquely position it to gain significant more decentralized spot market share.

Hyperliquid spot volume is already back to December highs, while CEXs are still down ~50%. Image
(2/6) Hyperliquid’s Evolution Into a General-Purpose L1:

With HyperEVM, staking, lending, and stablecoins, Hyperliquid is building a complete DeFi ecosystem — already surpassing $1B in TVL and still climbing.

The real challenge in DeFi doesn't come from bootstrapping supply-side, it’s sustaining organic demand for this leverage and liquidity. Hyperliquid perps and spot trading sits at the center of that demand, powering the most compelling use case in the ecosystem.Image
Read 7 tweets
May 29
How are stablecoins used for payments?

Alongside @CastleIslandVC and @dragonfly_xyz, we sourced data from 20 leading stablecoin companies (with public data from 11 more) to answer the question.

A 🧵 on the incredible growth of stablecoin payments Image
We were able to specifically attribute $94.2 billion worth of stablecoin payments settled between January 2023 and February 2025

Monthly stablecoin payment growth is up 215%, from <$2bn to over $6.3bn Image
The most popular stablecoin used by sampled firms was @Tether_to , with around 80 percent market share by volume, followed by @circle USDC Image
Read 8 tweets
Sep 16, 2024
@Celo recently passed @trondao in daily active addresses for stablecoin usage.

-What's behind this meteoric rise?
-Is Africa undergoing a stablecoin breakout?

A 🧵 Image
We know the limitations of daily active addresses, so we are taking a deep dive into @Celo stablecoin transaction volumes.

-Transfer sizes across all buckets are growing, indicating its not addresses spamming the network making very small transactions Image
Stablecoin supply on @Celo has grown significantly in the past year as well... Image
Read 6 tweets
Sep 12, 2024
We are thrilled to power the onchain insights of "Stablecoins: The Emerging Market Story." Working closely with @Visa and @CastleIslandVC we highlighted:

-A new "adjusted" transfer volume metric
-Stablecoin vs overall crypto growth
-Dollar dominance of stablecoins Image
As shown above, today, stablecoins are responsible for between 70 and 80 percent of all value settled on public blockchains.
Stablecoin usage continues to break ATHs and has decoupled from the crypto market

-While trading ebbs and flows, stablecoin monthly active users has consistently increased Image
Read 7 tweets
Jun 27, 2024
Solana stablecoin volumes - a small thread 🧵
Since June 10, Solana stablecoin volume have diminished from $74bn to roughly $7bn a day Image
As mentioned in @WazzCrypto's thread, much of overall volume is driven by 2 sources: MEV Bot 7rhxnL and Phoenix DEX, accounting for ~$1tn of total transfer volume over the last month

solscan.io/account/7rhxnL…
Image
Read 11 tweets
Nov 2, 2023
📢 Exciting news! The Q3 2023 On-Chain Report is here.

In collaboration with @QuickNode, we dove deep into blockchain consumer behavior, developer trends, and venture capital investments.

Get ready for some eye-opening insights! 🧵⬇️ Image
This report gives an overview of blockchain activity:

1. Current usage trends
2. Emerging developer trends
3. Investment landscape by VCs

By centering on developers and end users, we gain insights into building a sustainable Web3 ecosystem. Image
1️⃣ Consumer Trends —Where are users today?

Stablecoins, DeFi, and Social categories standout in blockchain usage.
- Financial applications and value transfer remain dominant, with high user adoption.
- Stablecoins have shown growth, becoming the most popular category in Q3 2023. Image
Read 21 tweets

Did Thread Reader help you today?

Support us! We are indie developers!


This site is made by just two indie developers on a laptop doing marketing, support and development! Read more about the story.

Become a Premium Member ($3/month or $30/year) and get exclusive features!

Become Premium

Don't want to be a Premium member but still want to support us?

Make a small donation by buying us coffee ($5) or help with server cost ($10)

Donate via Paypal

Or Donate anonymously using crypto!

Ethereum

0xfe58350B80634f60Fa6Dc149a72b4DFbc17D341E copy

Bitcoin

3ATGMxNzCUFzxpMCHL5sWSt4DVtS8UqXpi copy

Thank you for your support!

Follow Us!

:(