
Want to master Mark Minervini Trend Template and create one?
Here's a step-by-step breakdown👇 of the system for identifying explosive stock trends that made him a 2x US Investing Champion🧵
Here's a step-by-step breakdown👇 of the system for identifying explosive stock trends that made him a 2x US Investing Champion🧵


#1 Stage Analysis Foundations
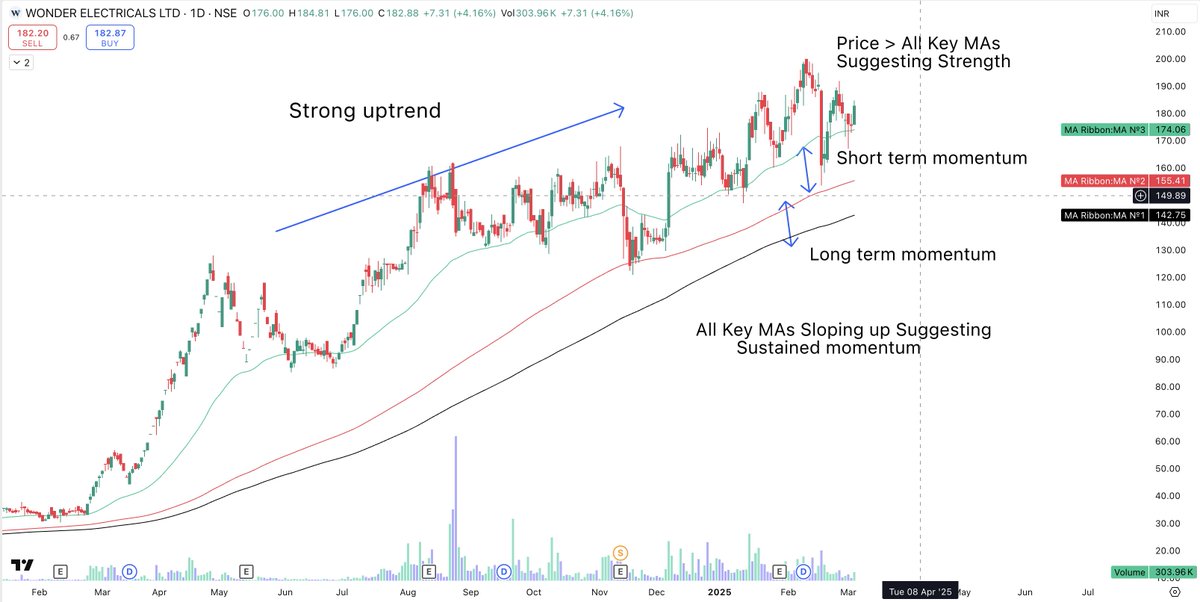
Minervini’s Template ONLY targets stocks in Stage 2 Uptrends!
This is done so by ensuring the stock trades above key Moving Averages (50-day, 150-day, and 200-day SMAs) with those averages sloping upward📈
Why this matters: Rising SMAs signal sustained institutional buying—the fuel for multi-month rallies🚀
#2 Math behind Stage 2 Uptrend
1. Price > 50, 150, 200 DMA 💪
While Price > 50 DMA demonstrates short term strength, price >150 &200 DMA ensures the medium and long term uptrend of stock is intact
2. 50DMA> 150DMA> 200DMA🚄
50>150 indicates presence of short term momentum. 150>200 confirms medium term.
3. 200MA sloping up for at least 1 month 💹
An upward-sloping long-term moving average suggests sustained institutional interest.
Summary
Strength, Momentum, Sustained Interest✅

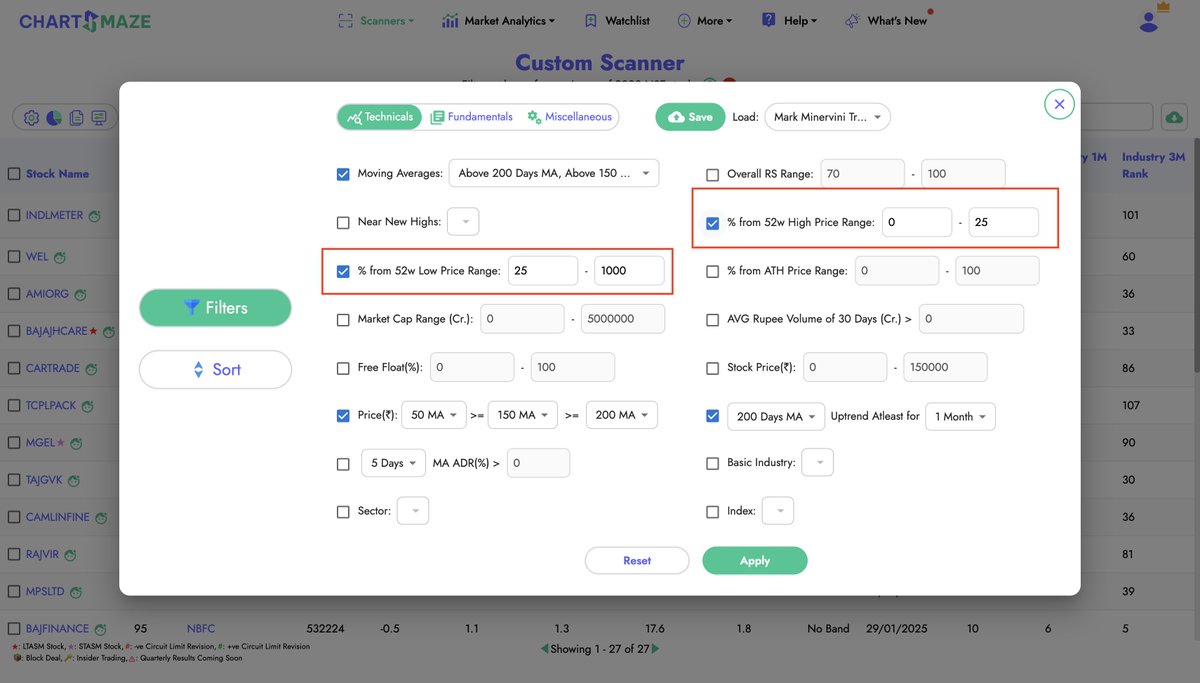
#3 Price Strength
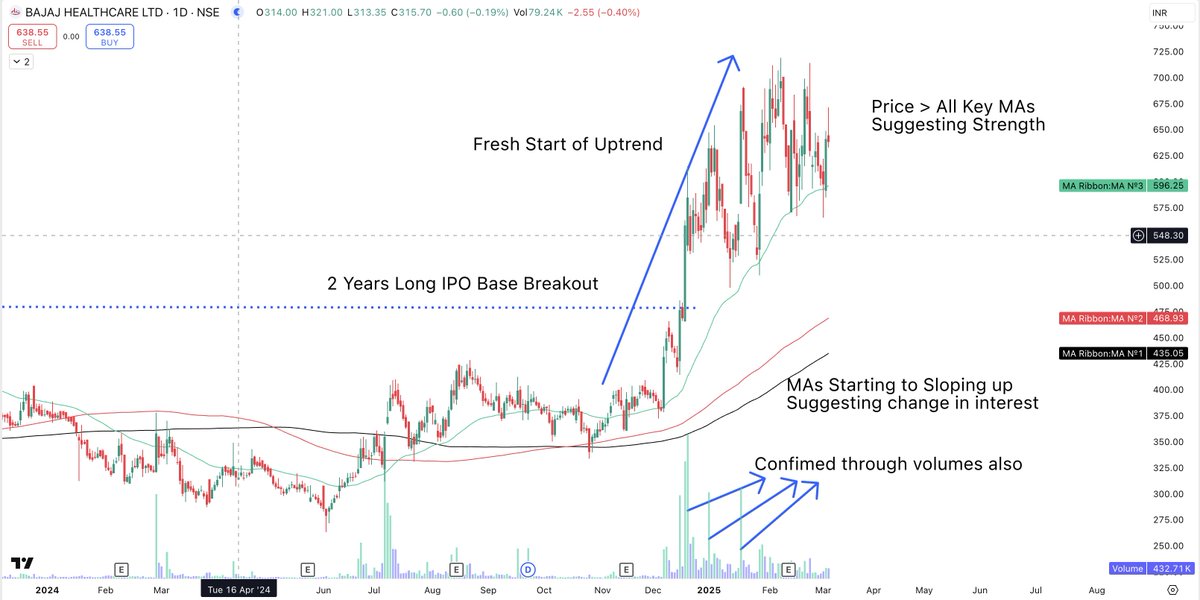
Minervini's Trend Template prioritises stocks within 25% from 52-week highs. The closer to the high, the better it is!💪
The template also strictly avoids stocks that are within 30% of 52w low. Best performers often rise 100%, 200%, or even 300% from their 52-week lows💹
Minervini's Trend Template prioritises stocks within 25% from 52-week highs. The closer to the high, the better it is!💪
The template also strictly avoids stocks that are within 30% of 52w low. Best performers often rise 100%, 200%, or even 300% from their 52-week lows💹
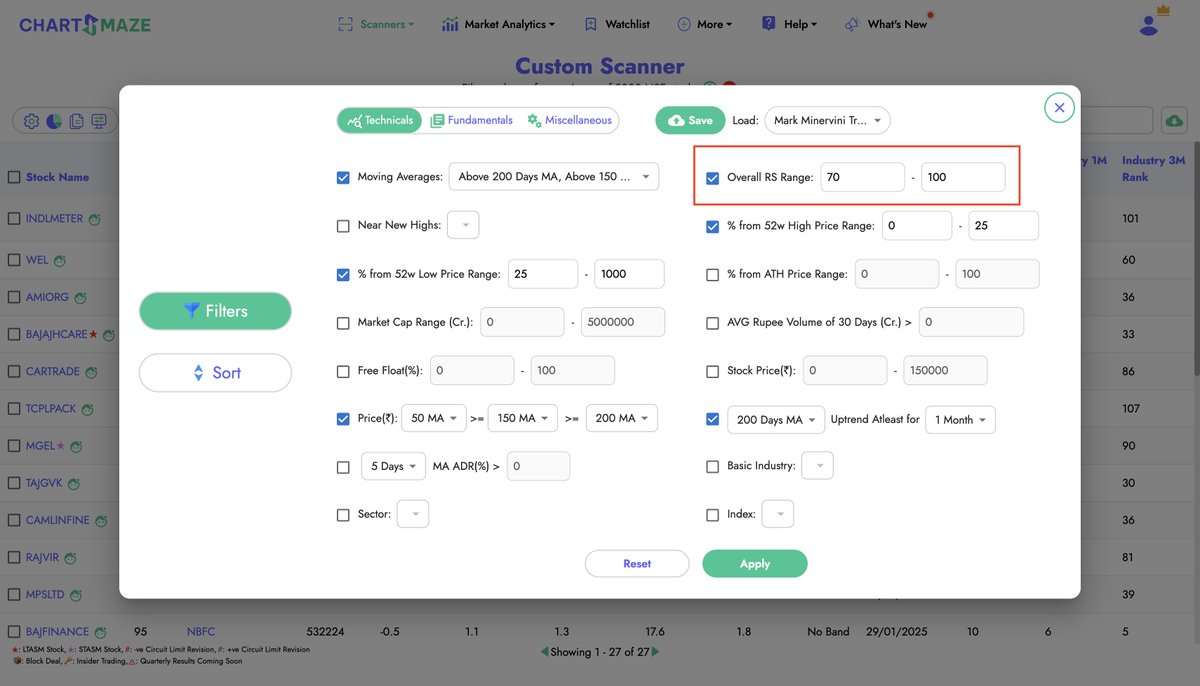
#4 Relative Strength Requirements
“Strong Relative Strength signals leadership—weak stocks never lead rallies💯”
Minervini Trend Template demands stocks outperform 80%+ of the market
A slightly relaxed condition would be Relative Strength > 7⃣0⃣
“Strong Relative Strength signals leadership—weak stocks never lead rallies💯”
Minervini Trend Template demands stocks outperform 80%+ of the market
A slightly relaxed condition would be Relative Strength > 7⃣0⃣
#5 Screener Application with examples
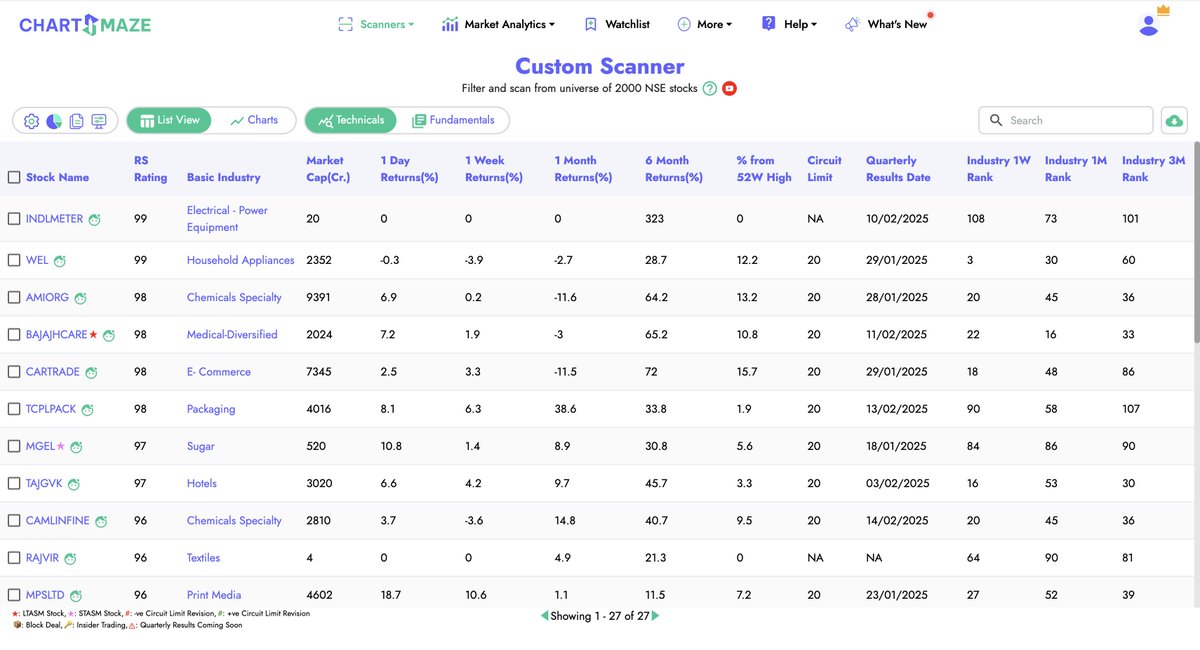
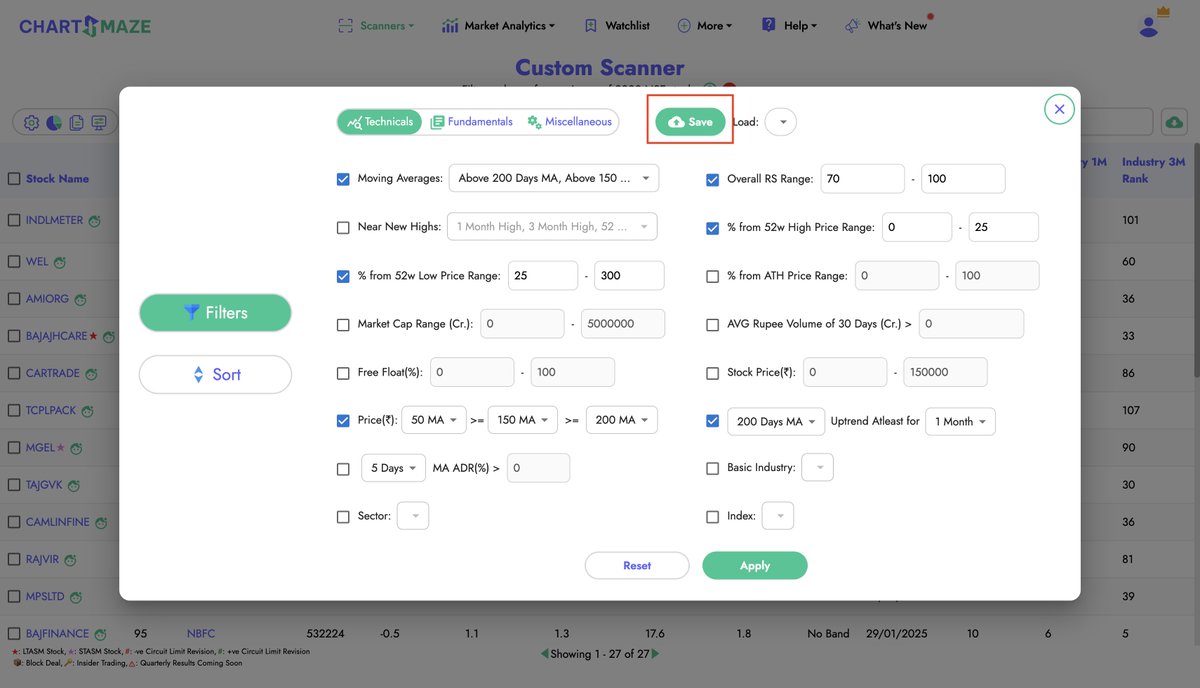
That’s it! The template is ready✅
Click Apply to obtain the list of stocks satisfying the criteria and study the charts in detail🔍
That’s it! The template is ready✅
Click Apply to obtain the list of stocks satisfying the criteria and study the charts in detail🔍
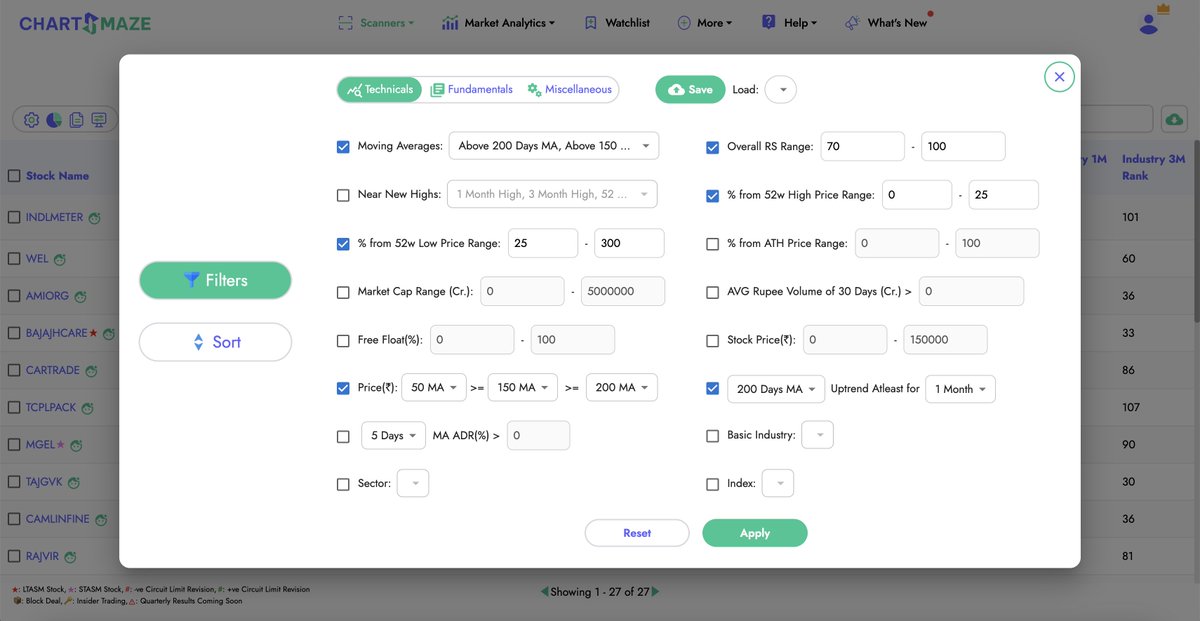
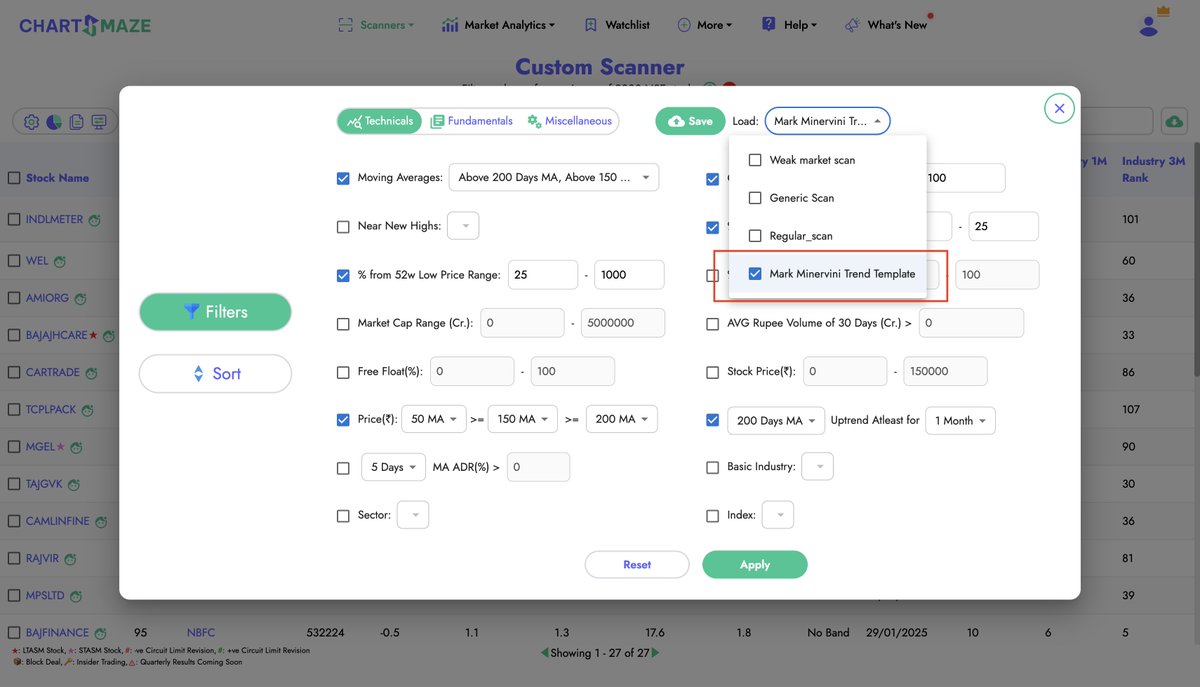
#6 Saving the Template
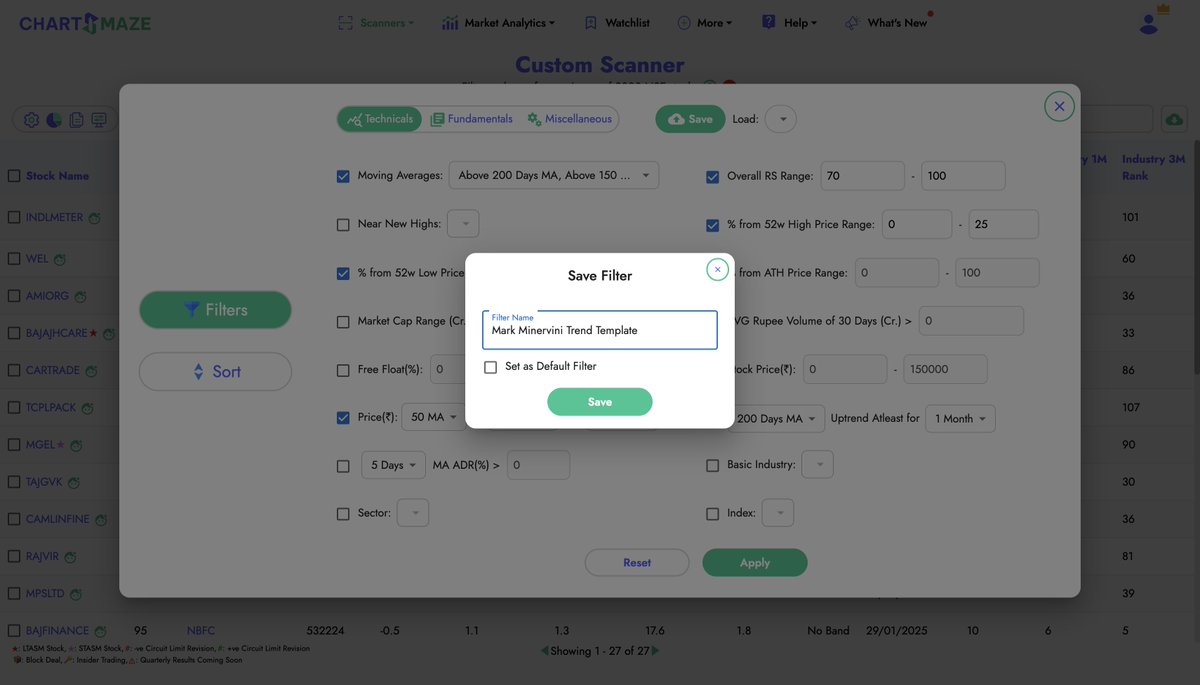
The good news is you don’t have apply these filters every time🤟
You can save the template and load it every time with just one click🖱️
The good news is you don’t have apply these filters every time🤟
You can save the template and load it every time with just one click🖱️
#7 Conclusion
Why the Mark Minervini Trend Template outperforms generic screeners?
🔹 Ensures Uptrend of Stock with Strength and Momentum (Price & MA Criterias)
🔹 Filters for sustained INSTITUTIONAL interest (200DMA sloping up)
🔹 Focuses on Out performers (Relative Strength, % from 52W Criterias)
Why the Mark Minervini Trend Template outperforms generic screeners?
🔹 Ensures Uptrend of Stock with Strength and Momentum (Price & MA Criterias)
🔹 Filters for sustained INSTITUTIONAL interest (200DMA sloping up)
🔹 Focuses on Out performers (Relative Strength, % from 52W Criterias)
• • •
Missing some Tweet in this thread? You can try to
force a refresh


