Ive been using volume since I started trading
but just like most I was reading it completely WRONG
learning to to read volume the RIGHT way helped me double my win rate
Below I'll show you exactly how I use it to make 6 figures trading🧵👇
but just like most I was reading it completely WRONG
learning to to read volume the RIGHT way helped me double my win rate
Below I'll show you exactly how I use it to make 6 figures trading🧵👇

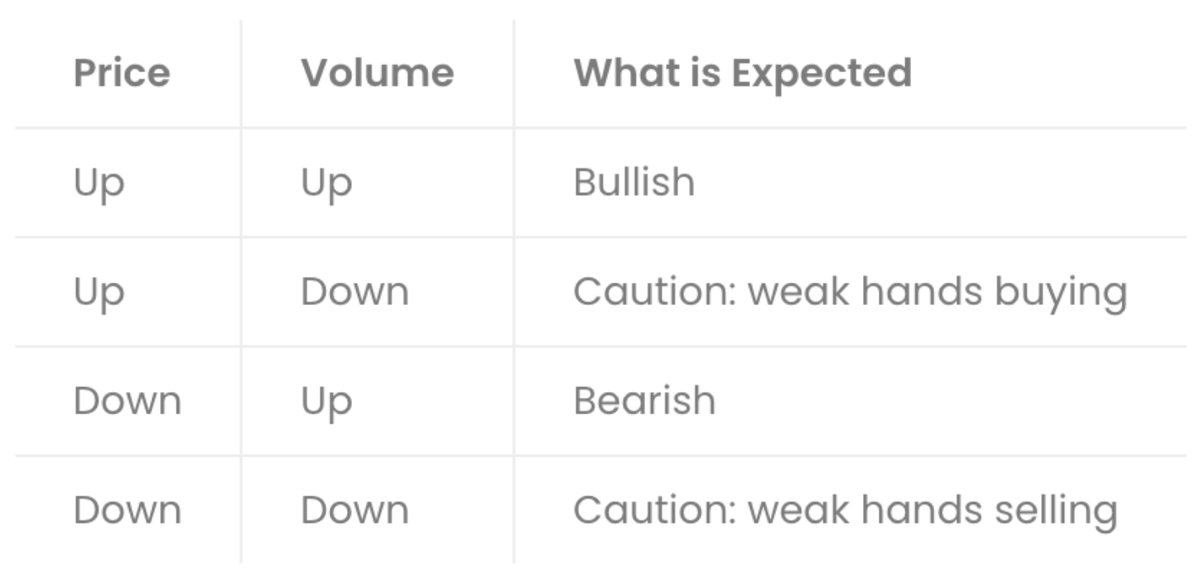
Volume is a critical indicator in trading because it provides insight into the strength and conviction behind price movements.
Most importantly volume does not lie, you can see every order that is executed printed in the volume
This creates patterns in the volume just like price
Most importantly volume does not lie, you can see every order that is executed printed in the volume
This creates patterns in the volume just like price
These volume patterns are referred to as VPA(Volume Price Analysis) and we can use them to determine if institutions are accumulating or distributing a position.
as well as the strength of the move and how likely we are to see follow through.
as well as the strength of the move and how likely we are to see follow through.
1. Volume indicator
Any charting platform will have the volume indicator available
volume will indicate how many shares were traded during a specific candle(1m, 5m, 15m, 1d)
I find that volume patterns are best to identify on the bigger time frames like the weekly and daily
since institutors can take weeks and even months to accumulate or distribute

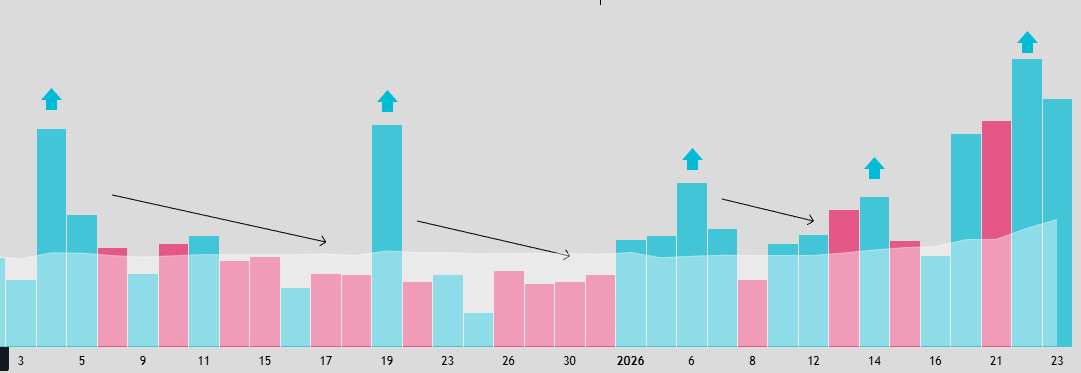
i like to add the MA cloud to my volume indicator this way i can easily spot if a stock is trading on higher than average volume

whenever volume shows above the cloud this indicates higher than average volume for the time frame we are on

2. Accumulation
accumulation refers to a period of time where institutions begin to add(accumulate) a stock
On this chart we can see that accumulation patterns were taking place
Higher volume as price gets bought up off the lows and lower volume on normal trading days indicating accumulation is happening
Pullbacks most be on low volume

3. Volume patterns
The strongest volume patterns
should look like this:
-super high volume ignition candle(indicating initial position from institutions)
-low volume pullbacks
-volume returning as price moves in the direction of the trend
The strongest volume patterns
should look like this:
-super high volume ignition candle(indicating initial position from institutions)
-low volume pullbacks
-volume returning as price moves in the direction of the trend

4. Setup
Once you start noticing a stock showing these type of volume patterns
we want to combine price action with volume analysis
When looking for price action patterns
you want to start looking for a range, a base, or any tight consolidation pattern
these can be:
-bullflags
-wedges
-pennants
Once you start noticing a stock showing these type of volume patterns
we want to combine price action with volume analysis
When looking for price action patterns
you want to start looking for a range, a base, or any tight consolidation pattern
these can be:
-bullflags
-wedges
-pennants

5. Entries
The easiest way to enter is to find a trigger level for the breakout
What I look for, is a previous level of resistance that price has rejected multiple times
In this example, you can see the $146 price level has rejected multiple times
If price breaks over that level, then we can assume a daily breakout is likely to occur
We want to confirm the breakout with lots of volume over the trigger level

We can use the 5m time frame to confirm our entry.
First 5m close above our level triggers long entry.
Stop loss is placed on the low of the daily candle that broke trigger
to make sure that we manage our risk in case of a failed breakout
First 5m close above our level triggers long entry.
Stop loss is placed on the low of the daily candle that broke trigger
to make sure that we manage our risk in case of a failed breakout

7. Targets
Take profits at previous resistance levels
If price is making new all time highs, use Fibonacci levels to scale out.
My scale out strategy is 25% of the position at a time and moving up stop to break even after first trim
Take profits at previous resistance levels
If price is making new all time highs, use Fibonacci levels to scale out.
My scale out strategy is 25% of the position at a time and moving up stop to break even after first trim

This sets you up for a huge r/r trade
for breakouts we do not want the stock to comeback to our entry level
the strongest stocks will lockout traders and keep running
this is why my scale strategy works so well to hold winners
for breakouts we do not want the stock to comeback to our entry level
the strongest stocks will lockout traders and keep running
this is why my scale strategy works so well to hold winners
Like any other strategy this is not a holy grail strategy but there's a reason why some of the best traders in the world swing strong stocks with great volume patterns
volume tells all
I've personally used this strategy to catch:
huge winners over the last 4 years:
$SMCI $200-$1000
$NVDA $50-$100+
$MSTR $150-$450
$TSLA $270-$480
volume tells all
I've personally used this strategy to catch:
huge winners over the last 4 years:
$SMCI $200-$1000
$NVDA $50-$100+
$MSTR $150-$450
$TSLA $270-$480
I post these setups every night on my twitter with trigger levels, option contracts, and targets.
So you can follow along, and learn the strategy.
If you enjoyed and learned something from this thread LIKE+RT❤️
for more trade plans and educational threads.
So you can follow along, and learn the strategy.
If you enjoyed and learned something from this thread LIKE+RT❤️
for more trade plans and educational threads.
I also made a short video breaking this strategy down on Instagram:
this should help to visualize it: instagram.com/reel/DHOu3v5Rz…
this should help to visualize it: instagram.com/reel/DHOu3v5Rz…
• • •
Missing some Tweet in this thread? You can try to
force a refresh