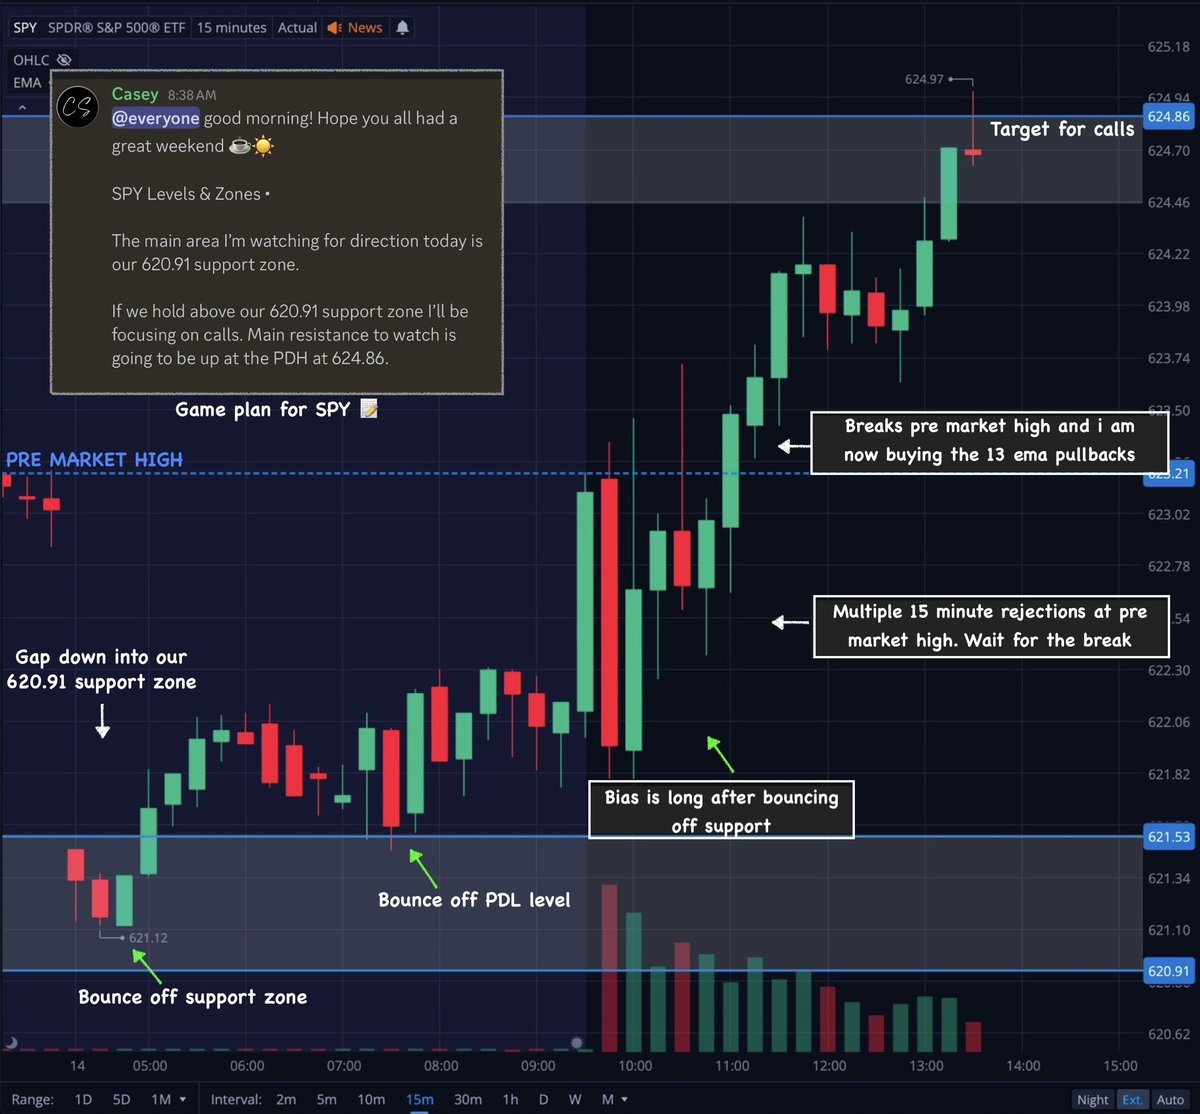
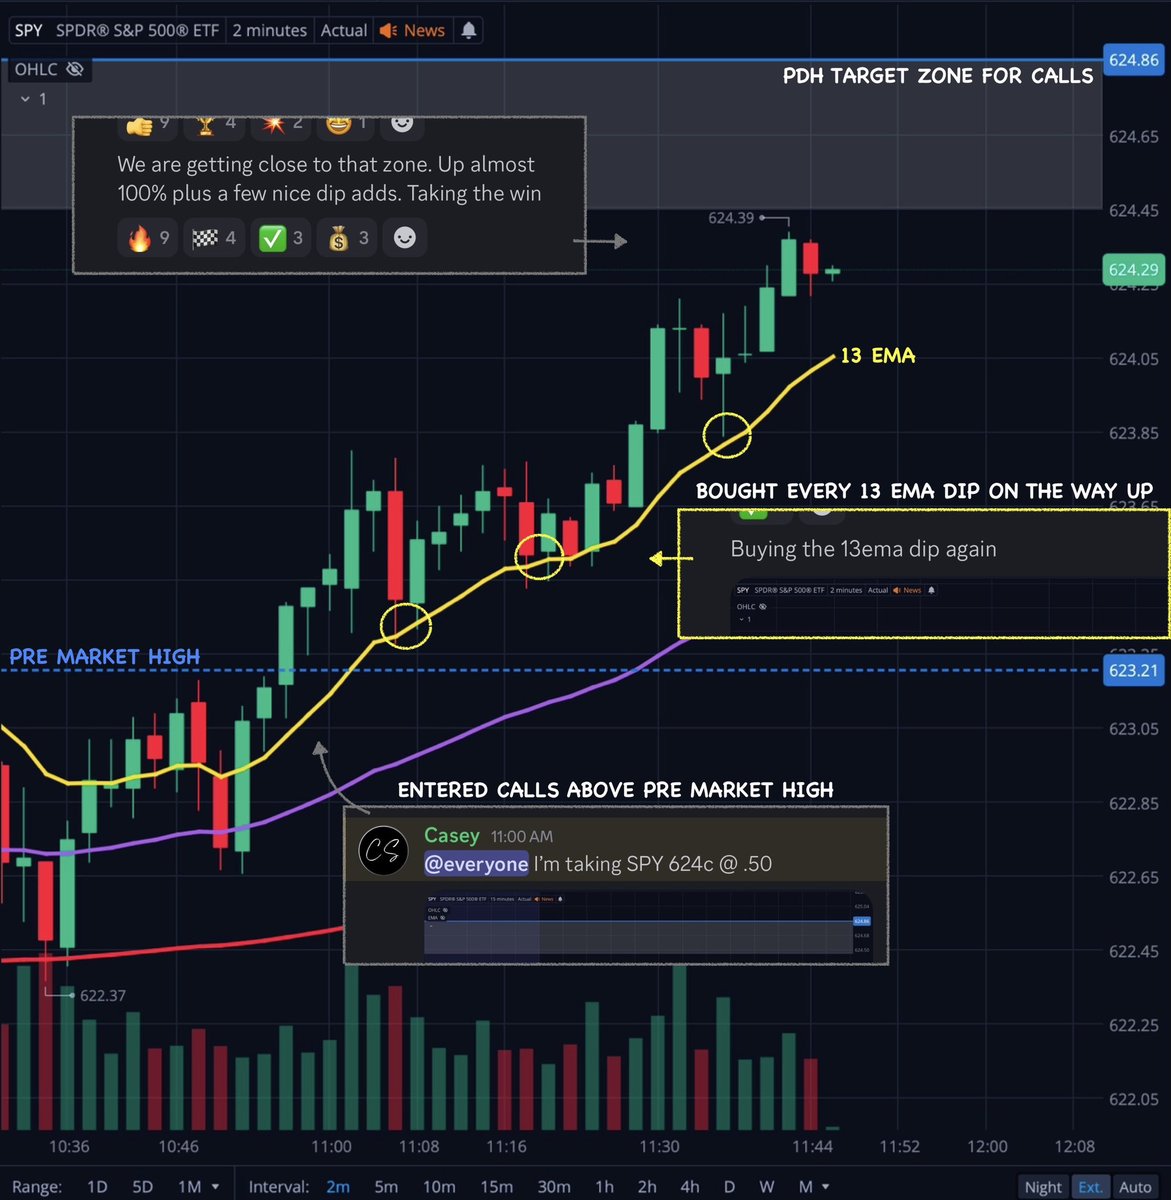
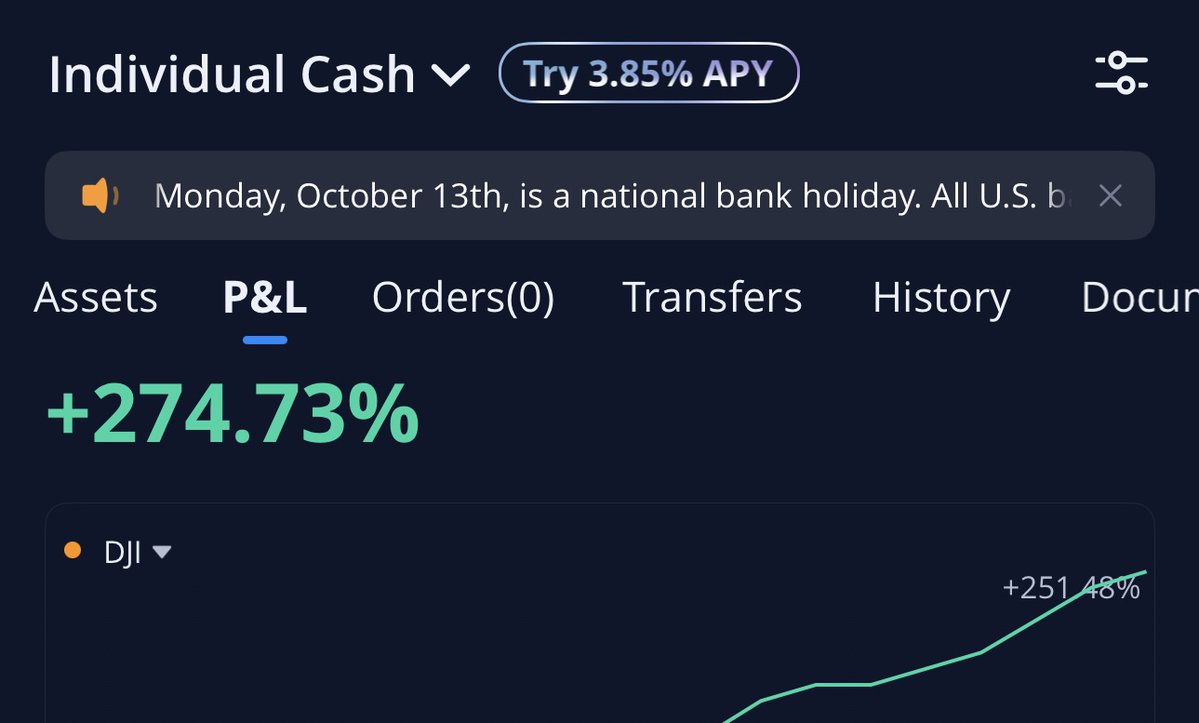
Cheat codes for trading $SPY & $QQQ 🧵
I'm going to show you 3 simple techniques I use to find & alert trades like these every single week!👇

I'm going to show you 3 simple techniques I use to find & alert trades like these every single week!👇


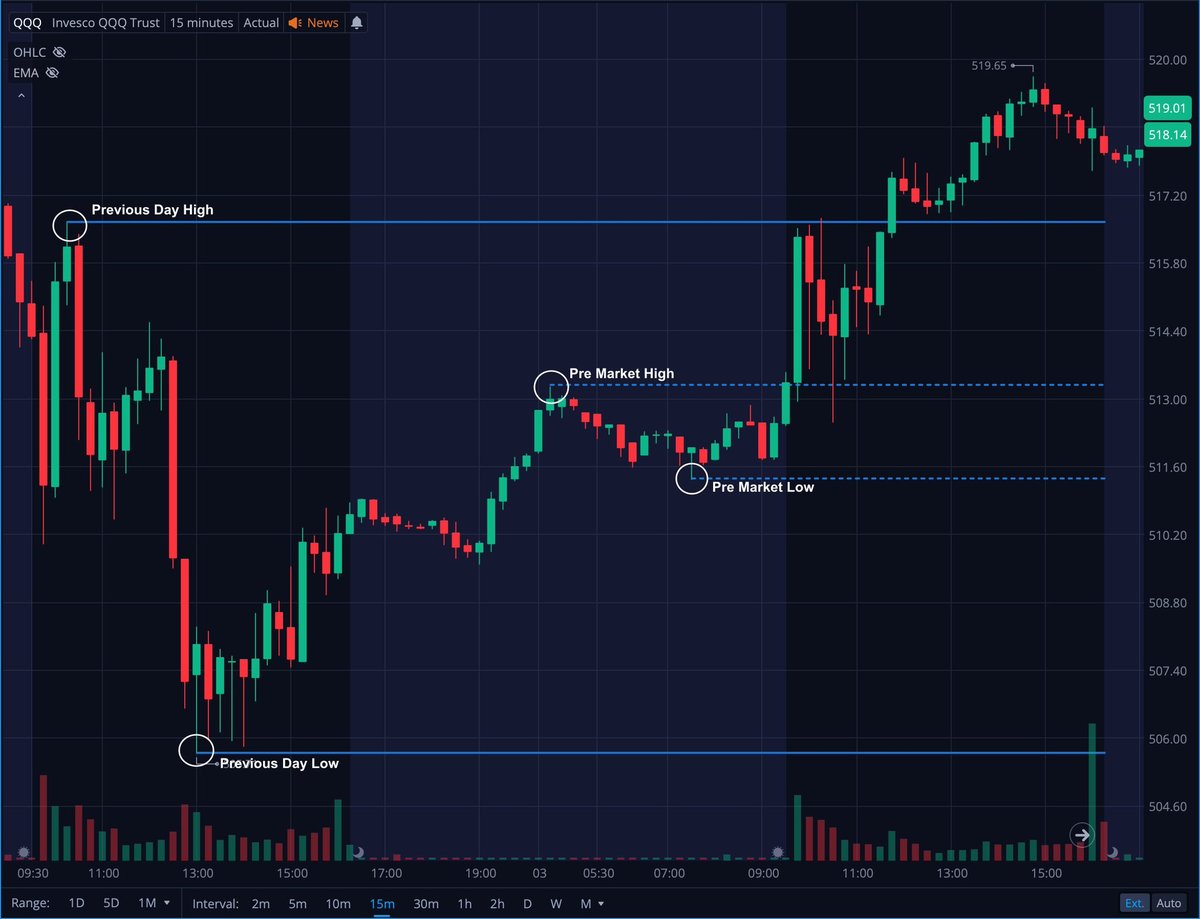
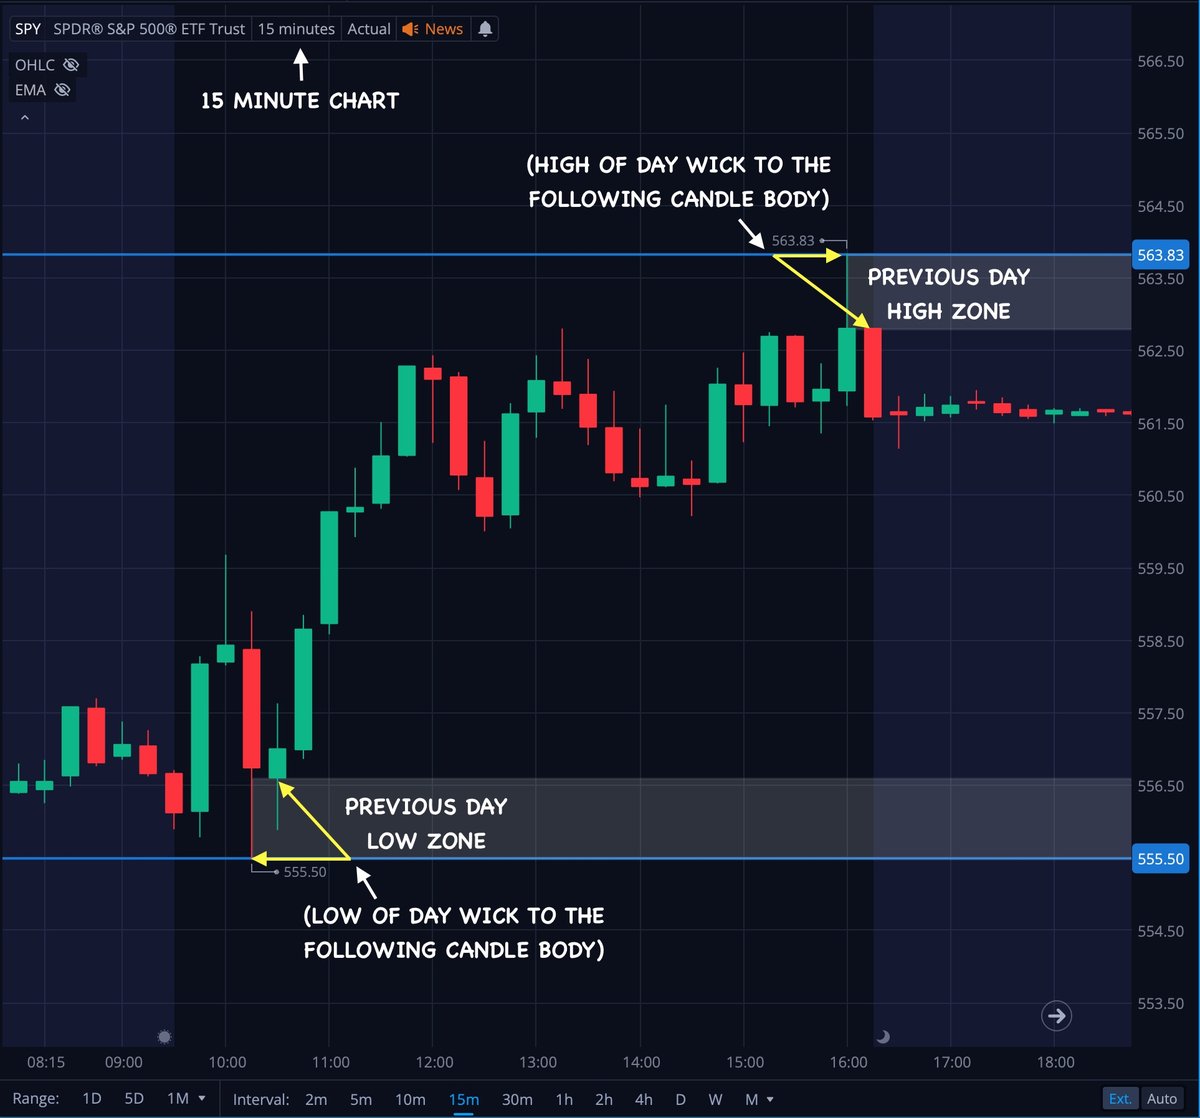
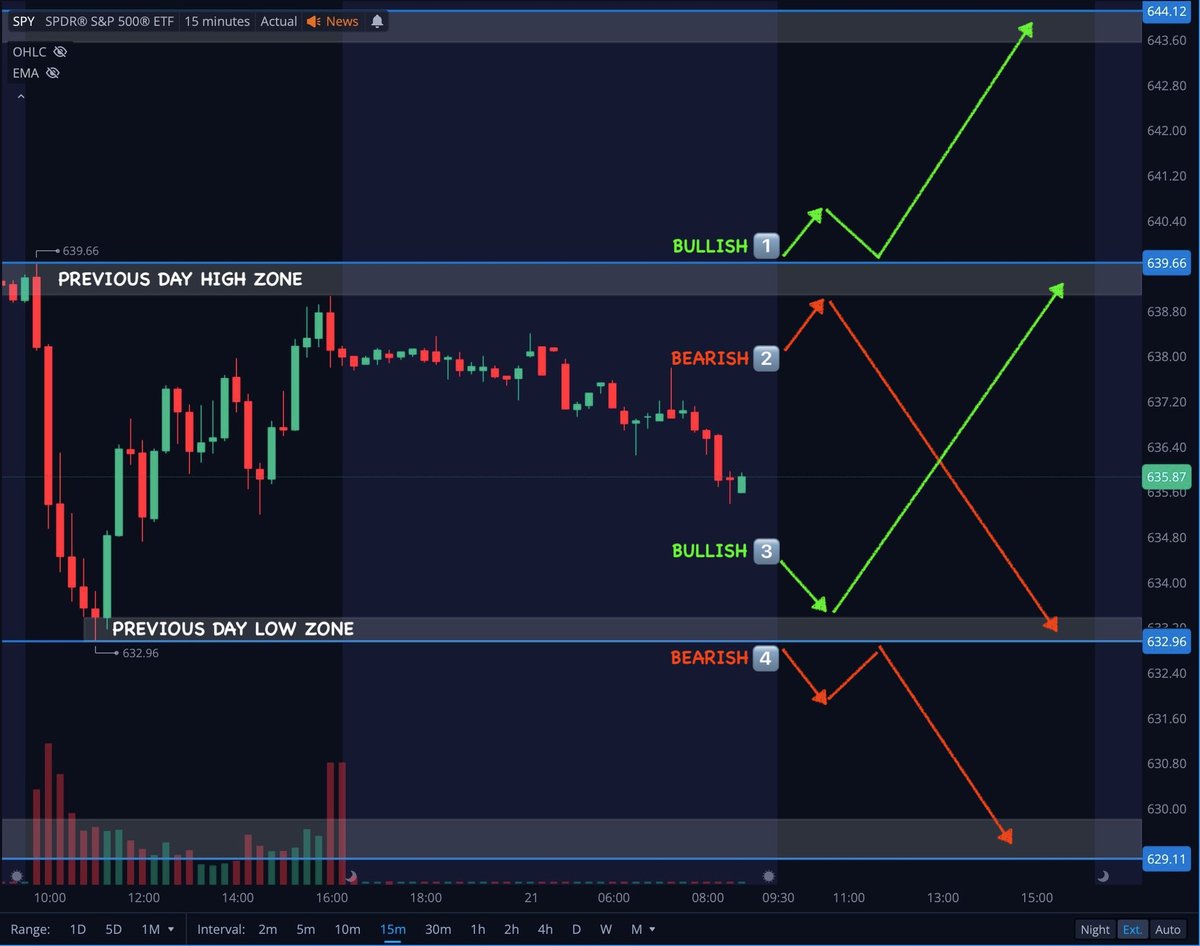
Cheat code #1 = Previous Day High & Low Zones ✅
These are the 2 most powerful areas of support & resistance on a day to day basic!
Here's the cheat sheet ⬇️
Trend days...
Above PDH = Focus on calls 📈
Below PDL = Focus on puts 📉
Range days...
Reject PDH = Focus on puts 📉
Bounce PDL = Focus on calls 📈
These 4 easy follow scenarios help me determine the directional bias on the next trade i take👇

Cheat code #2 = EMA trends ✅
I use the 13 / 48 / 200 EMA's on the 2 minute chart (extended hours on) to look for Bullish & Bearish EMA trends, As well as a tool to determine chop vs trend!
Lets breaks down all 3 scenarios right now 👇


I use the 13 / 48 / 200 EMA's on the 2 minute chart (extended hours on) to look for Bullish & Bearish EMA trends, As well as a tool to determine chop vs trend!
Lets breaks down all 3 scenarios right now 👇


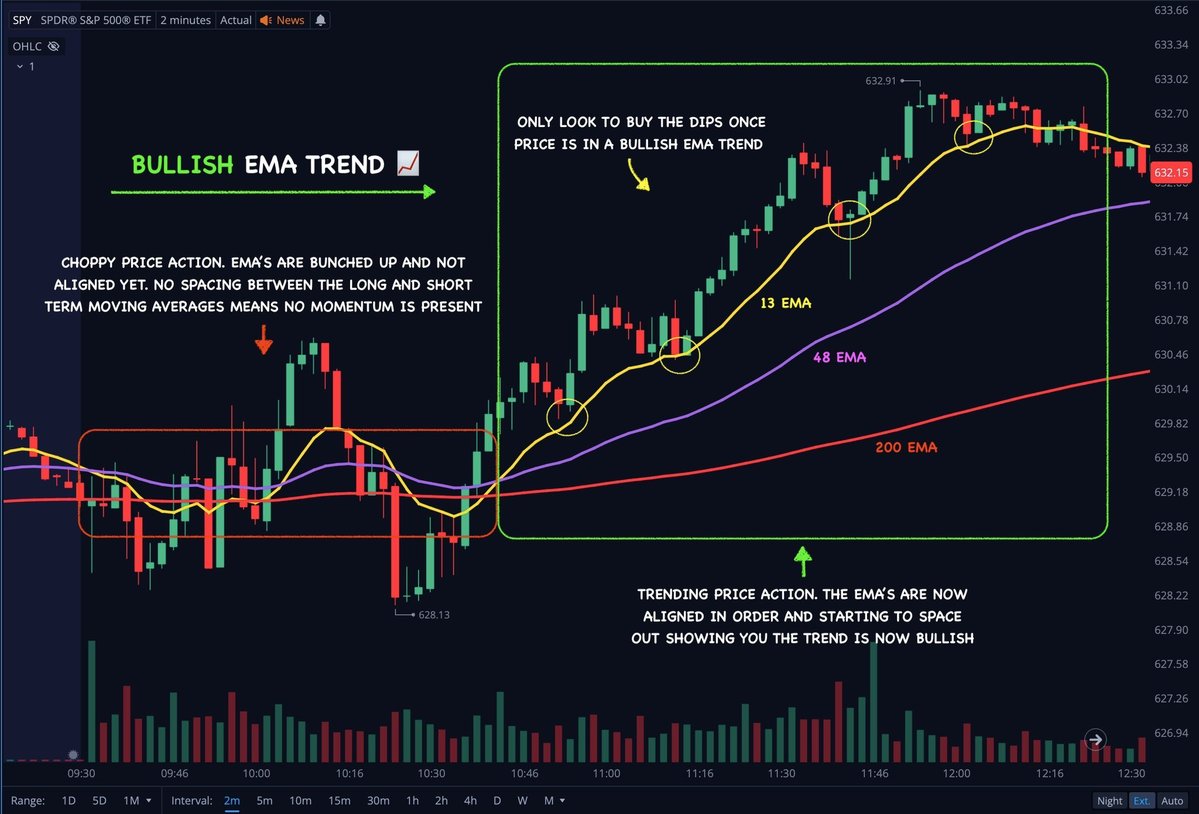
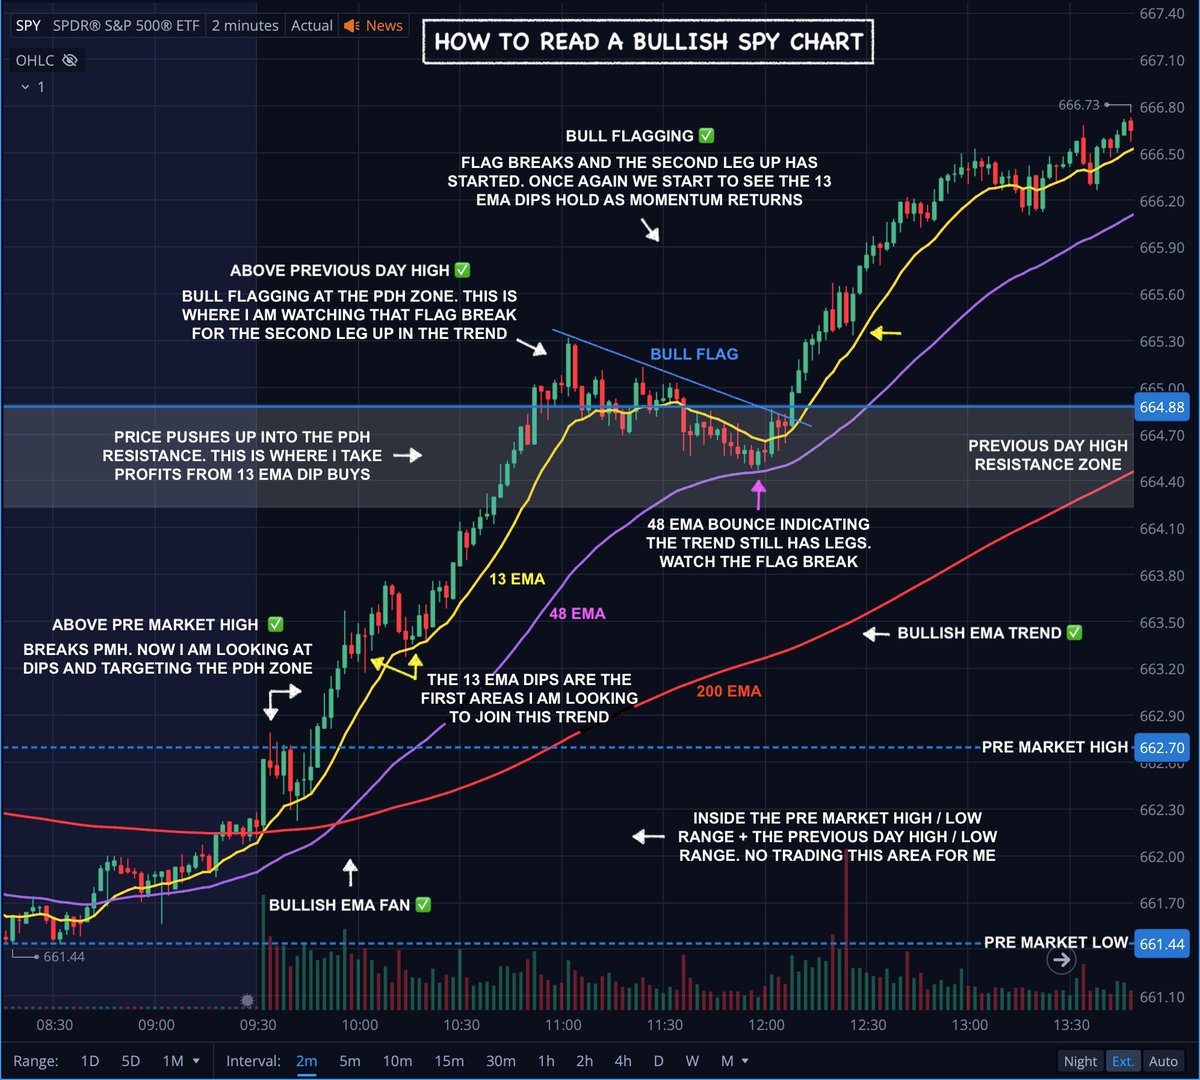
Bullish EMA trends = Here's the cheat sheet ⬇️
Above 200 EMA = Bullish
Above 200 + 48 EMA = More Bullish
Above 200 + 48 + 13 EMA = Mega Bullish
The strongest upside momentum happens when...
13 EMA on top 🟡
48 EMA in middle 🟣
200 EMA on bottom 🔴
Study this bullish price action 👇
Above 200 EMA = Bullish
Above 200 + 48 EMA = More Bullish
Above 200 + 48 + 13 EMA = Mega Bullish
The strongest upside momentum happens when...
13 EMA on top 🟡
48 EMA in middle 🟣
200 EMA on bottom 🔴
Study this bullish price action 👇

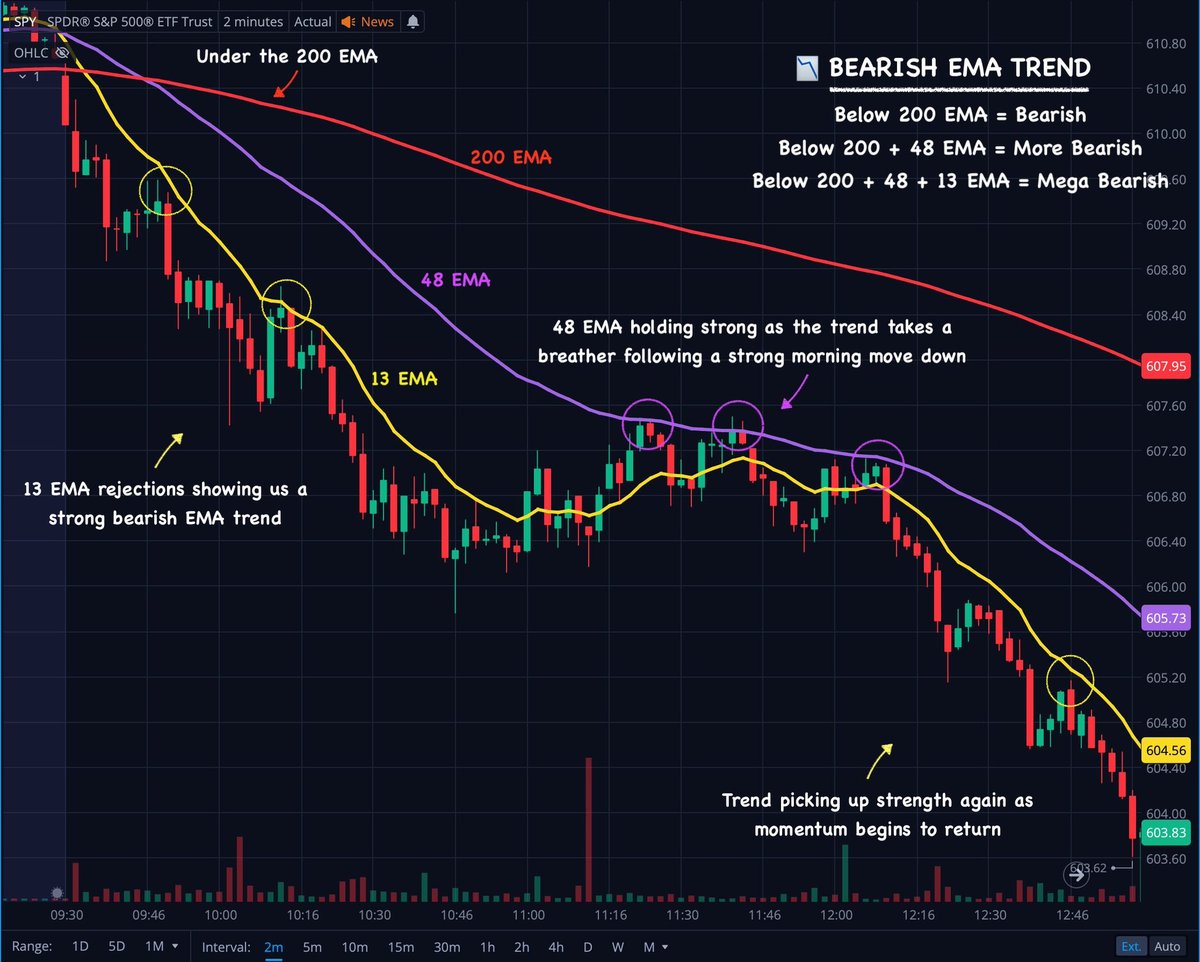
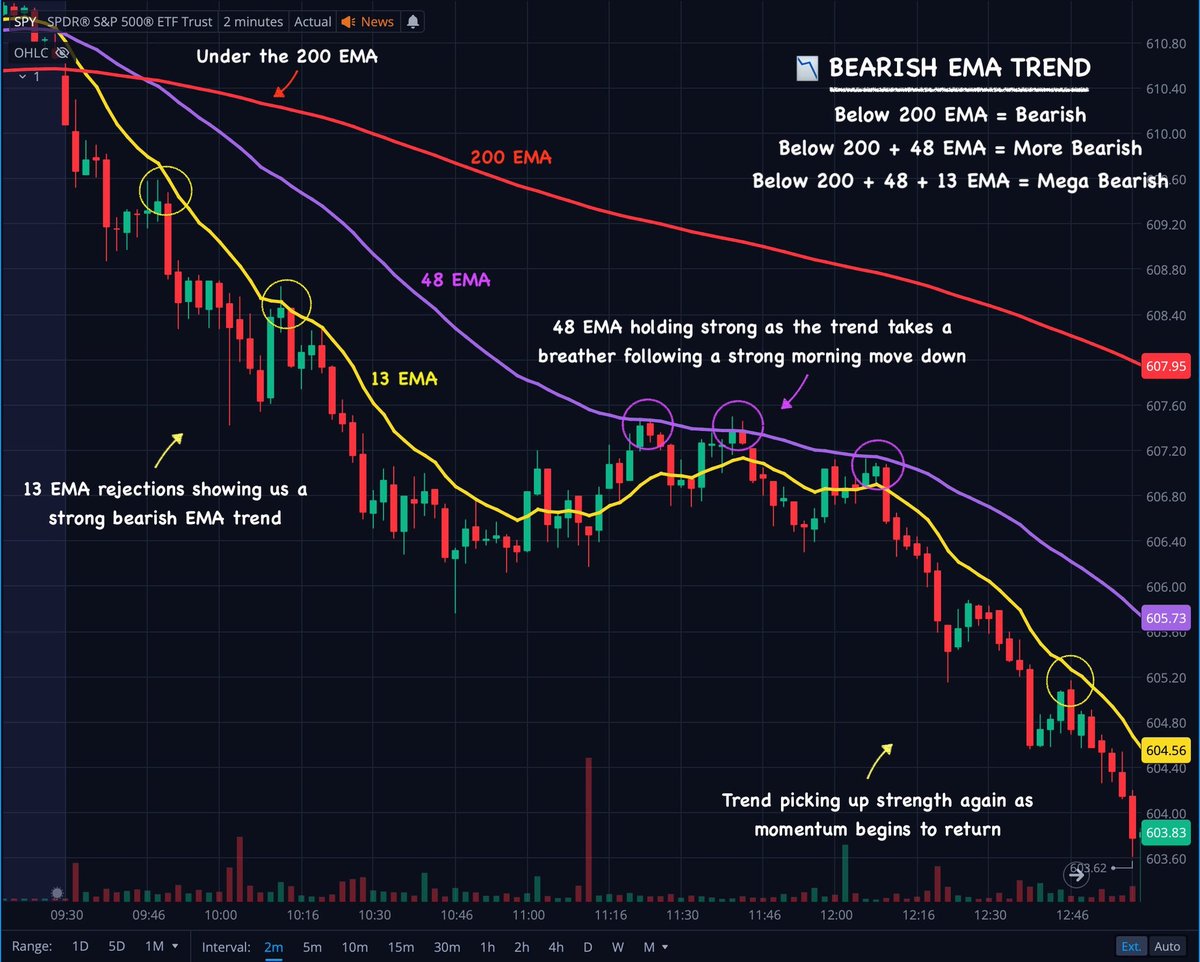
Bearish EMA trends = Here's the cheat sheet ⬇️
Below 200 EMA = Bearish
Below 200 + 48 EMA = More Bearish
Below 200 + 48 + 13 EMA = Mega Bearish
The strongest downside momentum happens when...
200 EMA on top 🔴
48 EMA in middle 🟣
13 EMA on bottom 🟡
Study this bearish price action 👇
Below 200 EMA = Bearish
Below 200 + 48 EMA = More Bearish
Below 200 + 48 + 13 EMA = Mega Bearish
The strongest downside momentum happens when...
200 EMA on top 🔴
48 EMA in middle 🟣
13 EMA on bottom 🟡
Study this bearish price action 👇
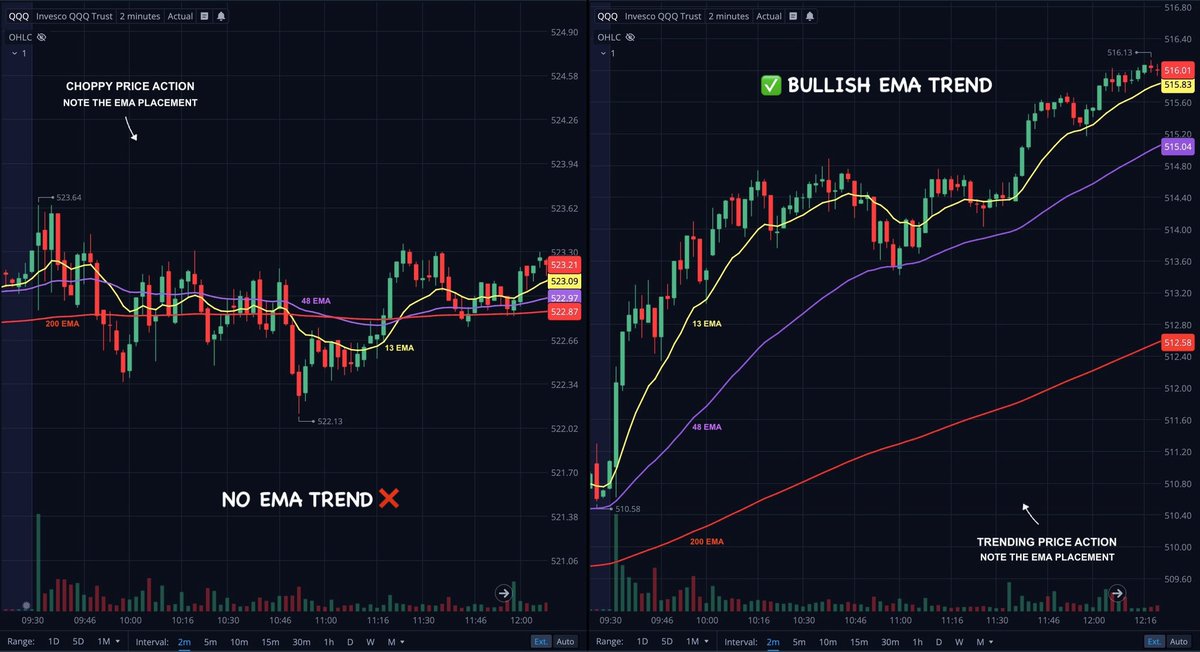
You will notice that balanced or "range days" will be showing little to no EMA trend.
When these 3 EMA's are too tightly spaced it's simply showing a lack of momentum to one side.
In other words we are consolidating and it's time to stay patient and wait for more confirmation.
Study the choppy days and take notes of the areas to avoid 👇
When these 3 EMA's are too tightly spaced it's simply showing a lack of momentum to one side.
In other words we are consolidating and it's time to stay patient and wait for more confirmation.
Study the choppy days and take notes of the areas to avoid 👇
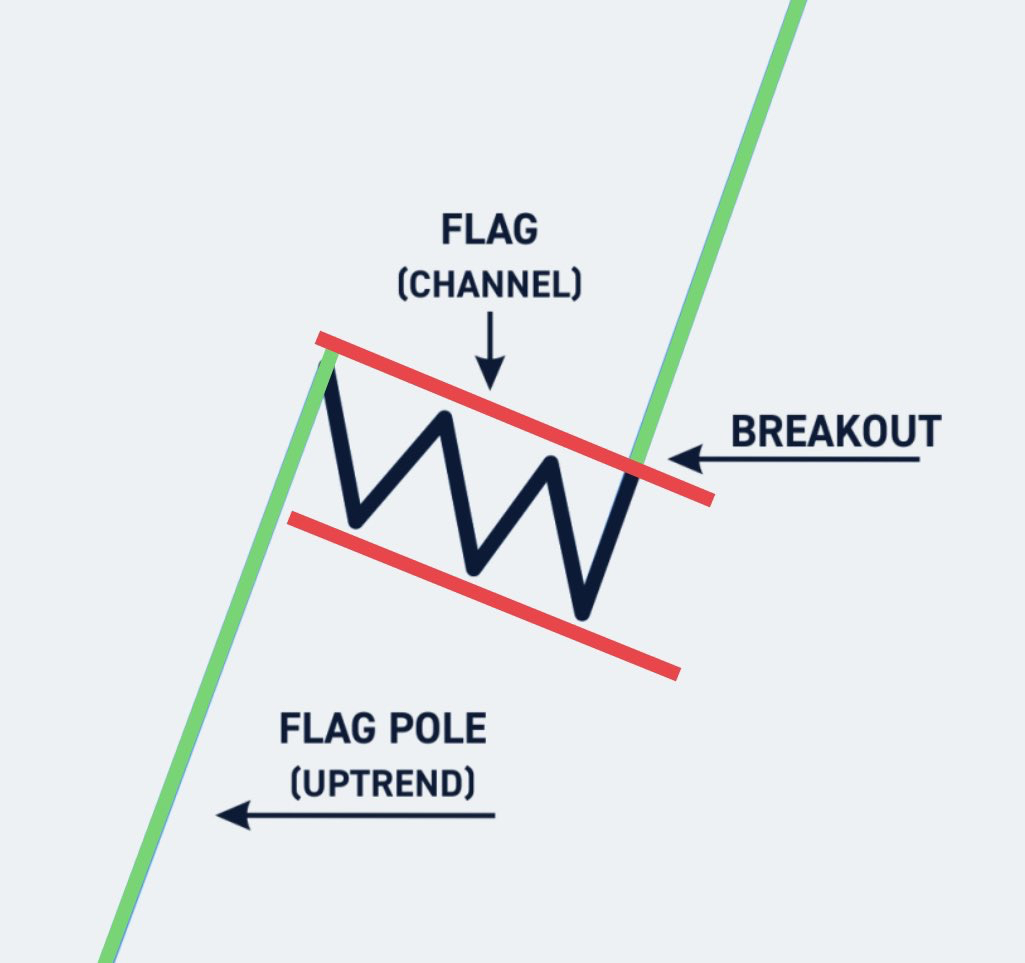
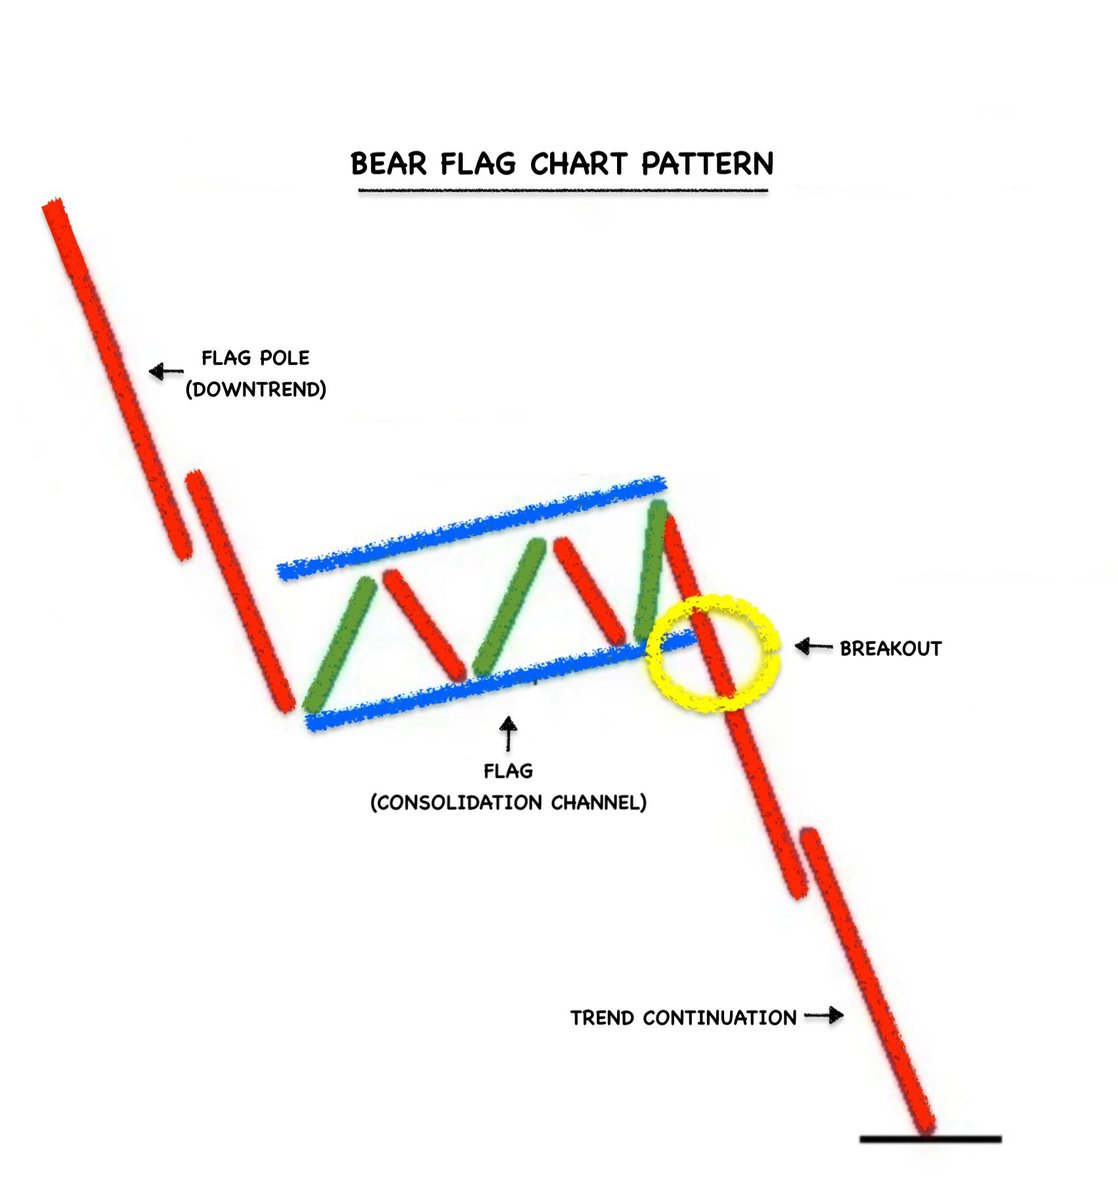
Cheat code # 3 = Bull / Bear Flags ✅
Here's the cheat sheet ⬇️
Focus on Bull Flags above the Previous Day High
Focus on Bear Flags below the Previous Day Low
Learn to spot the flags! They are one of the most simple and reliable chart patterns out there 👇


Here's the cheat sheet ⬇️
Focus on Bull Flags above the Previous Day High
Focus on Bear Flags below the Previous Day Low
Learn to spot the flags! They are one of the most simple and reliable chart patterns out there 👇
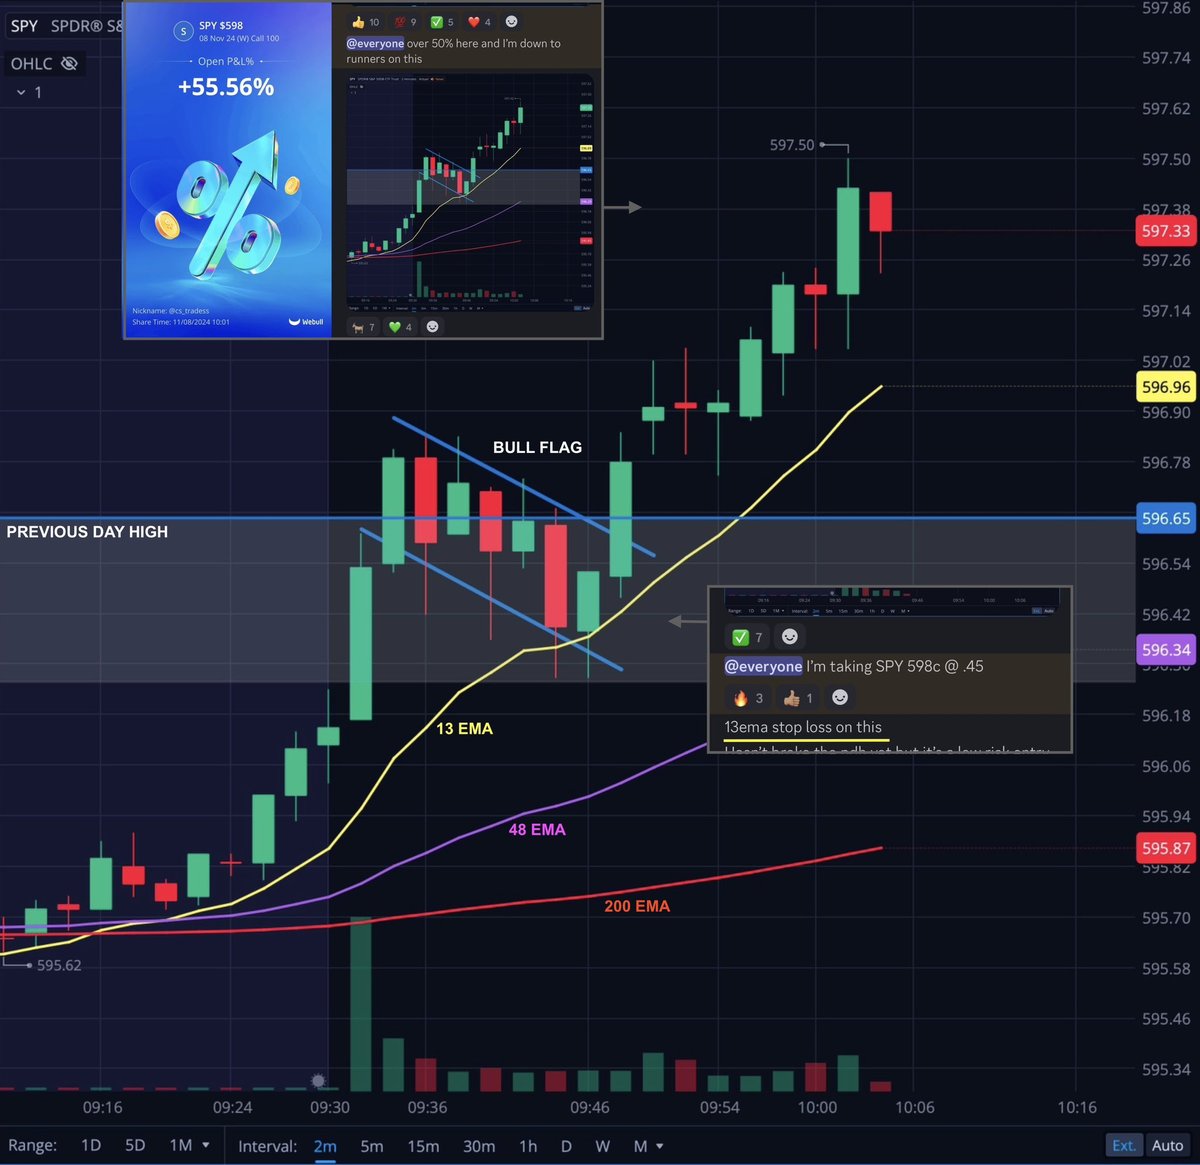
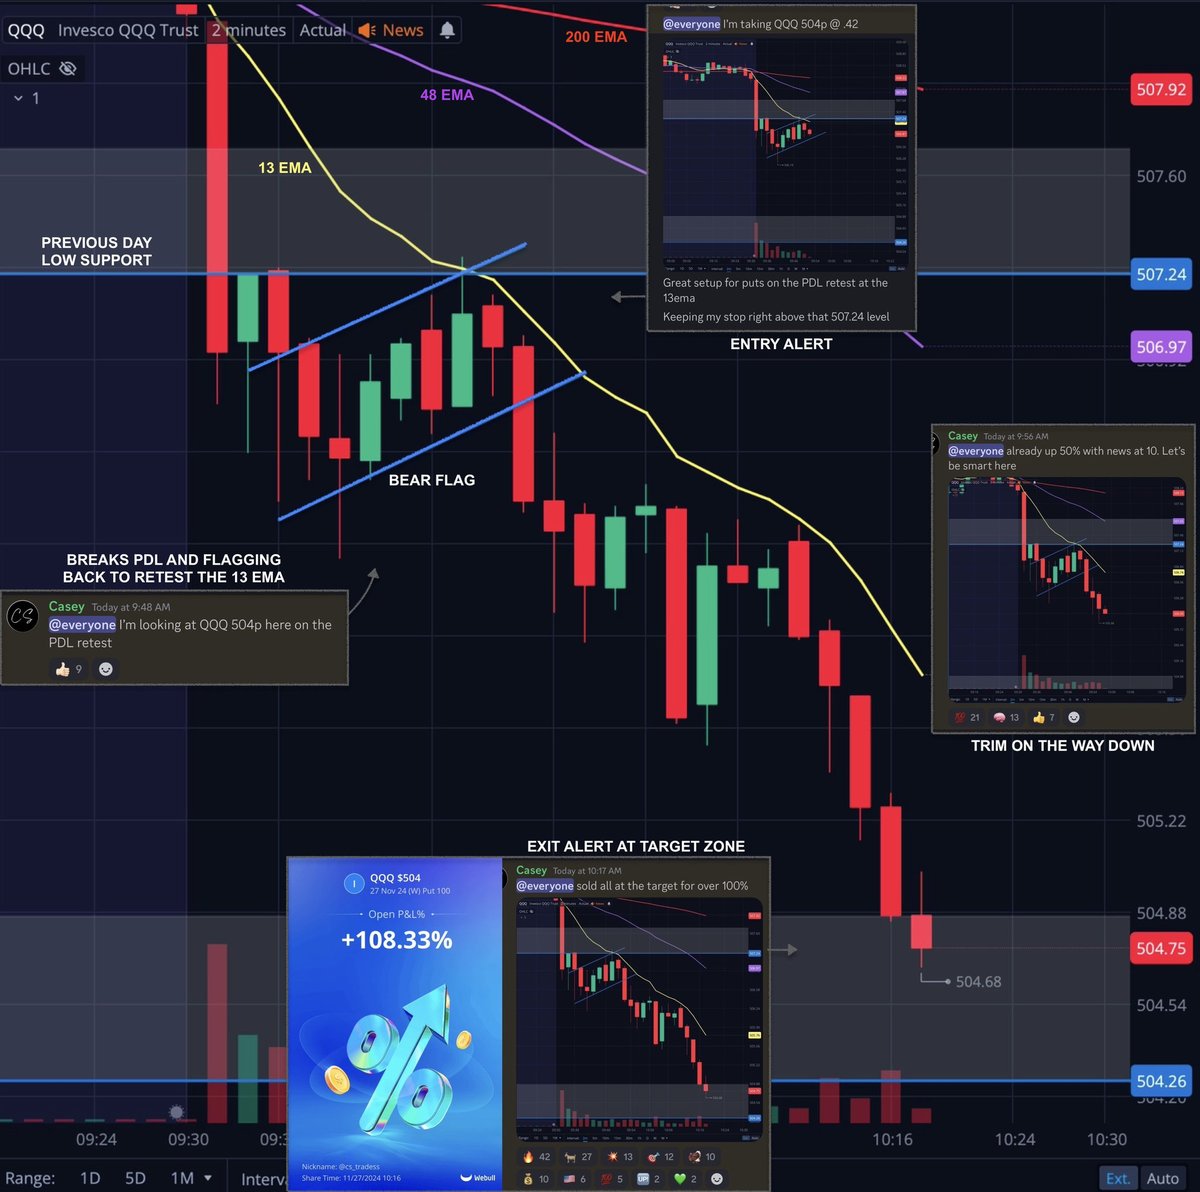
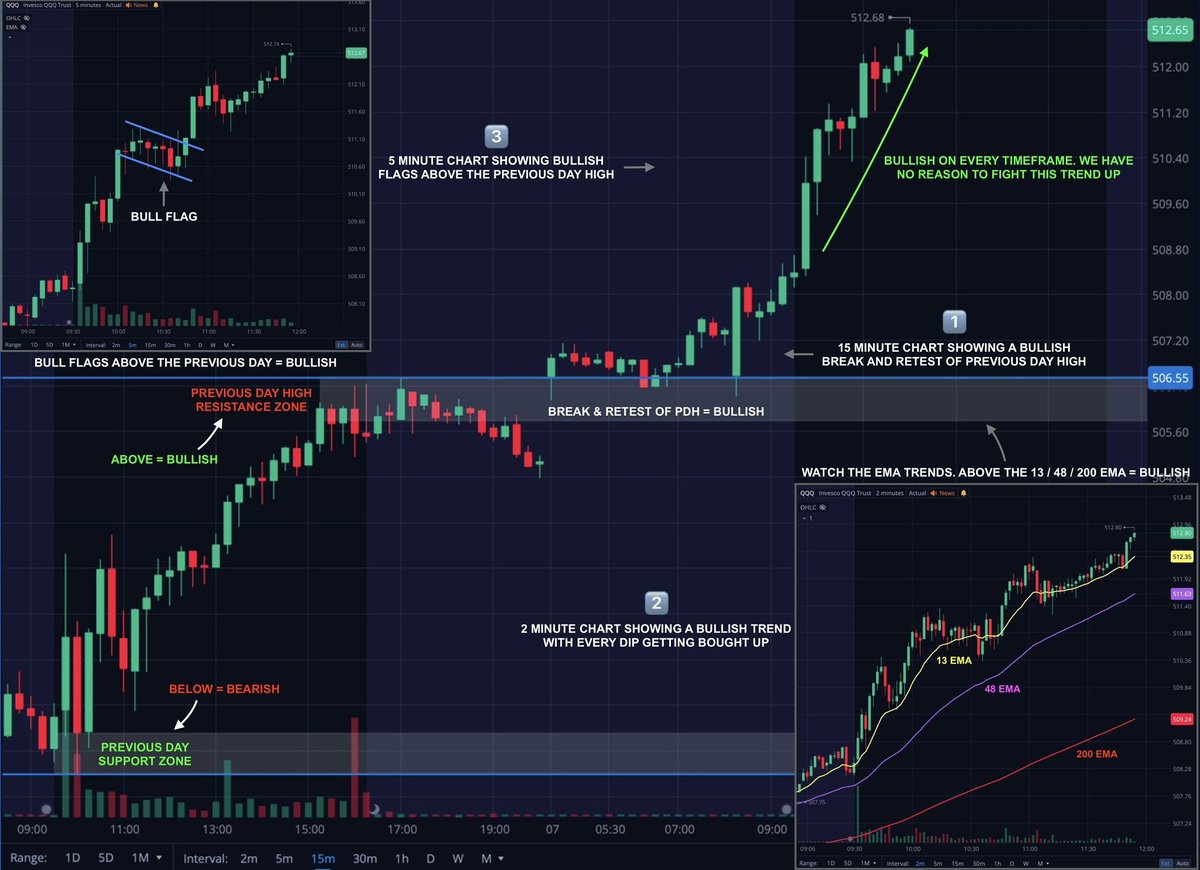
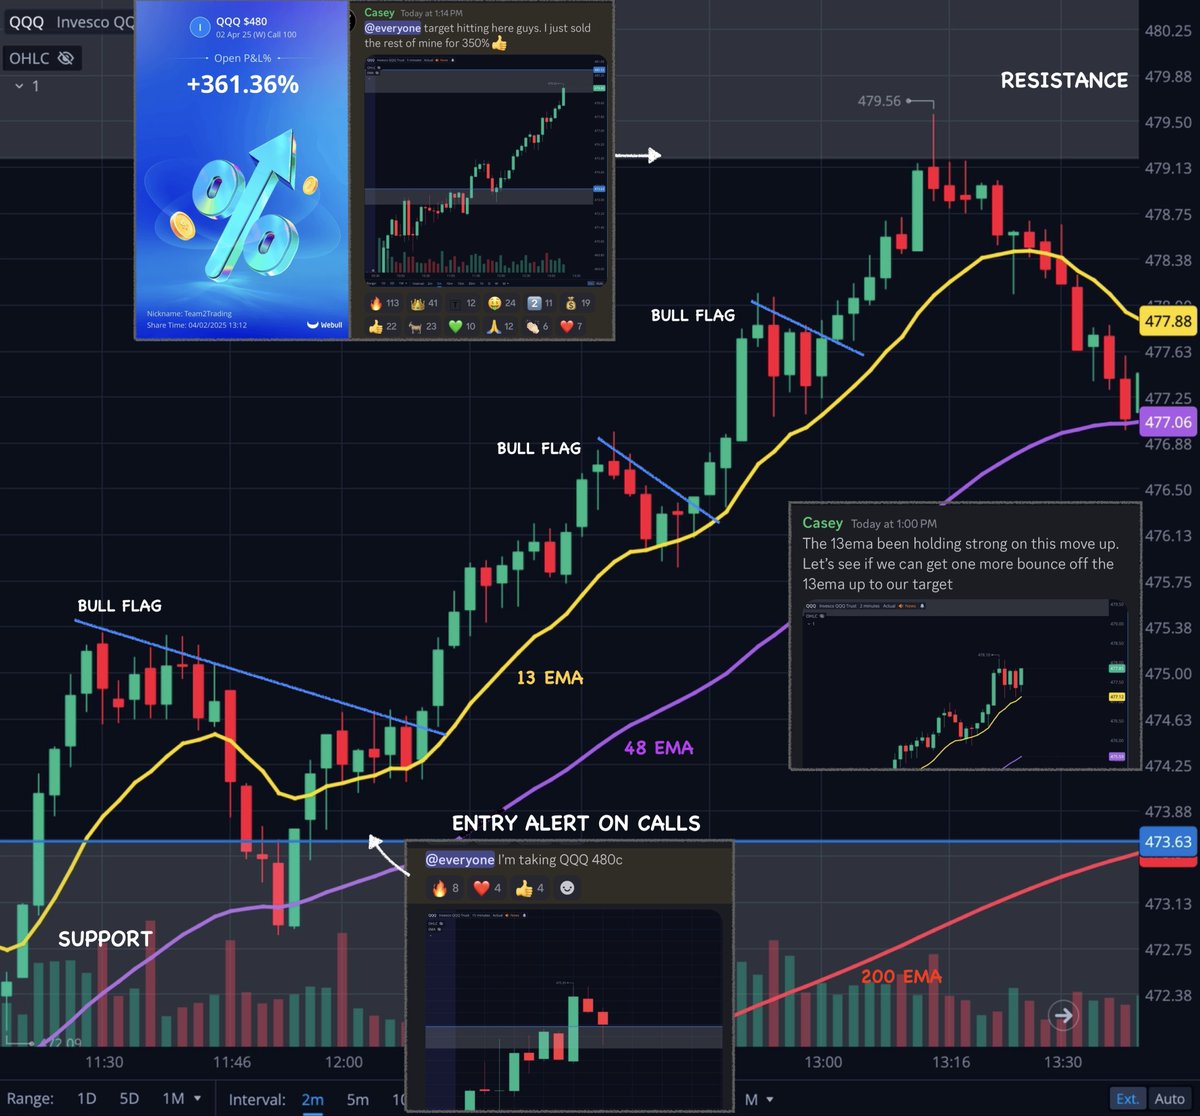
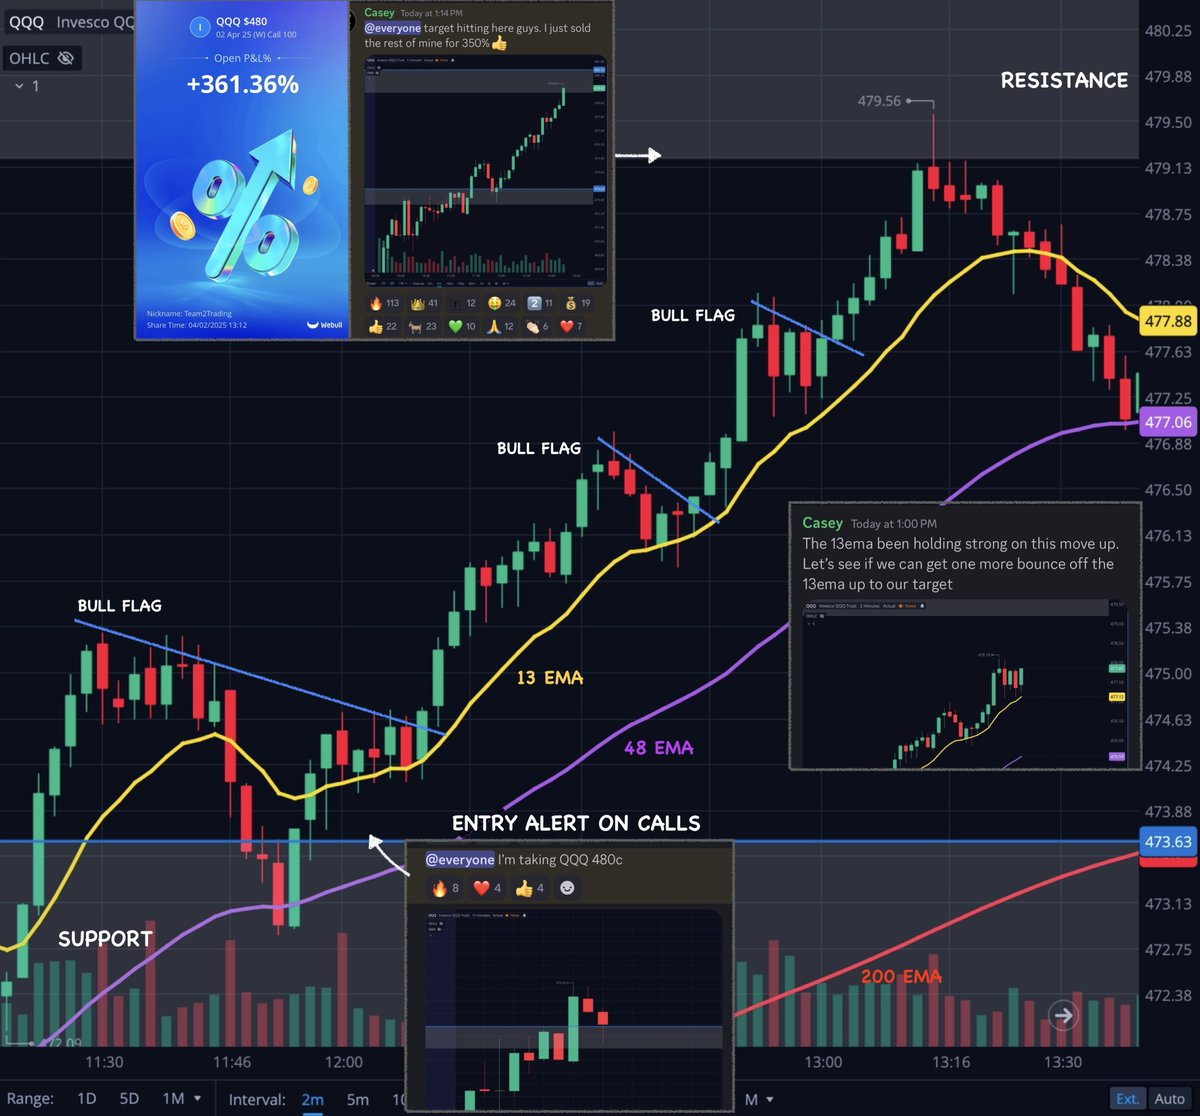
Trade example from this week on $QQQ
+350% on some calls. Why was I long?
Price above Previous Day High ✅
Bullish EMA trend ✅
Bull Flagging ✅
We were in an uptrend here with multiple entry opportunities to capture a piece of the momentum 👇
+350% on some calls. Why was I long?
Price above Previous Day High ✅
Bullish EMA trend ✅
Bull Flagging ✅
We were in an uptrend here with multiple entry opportunities to capture a piece of the momentum 👇
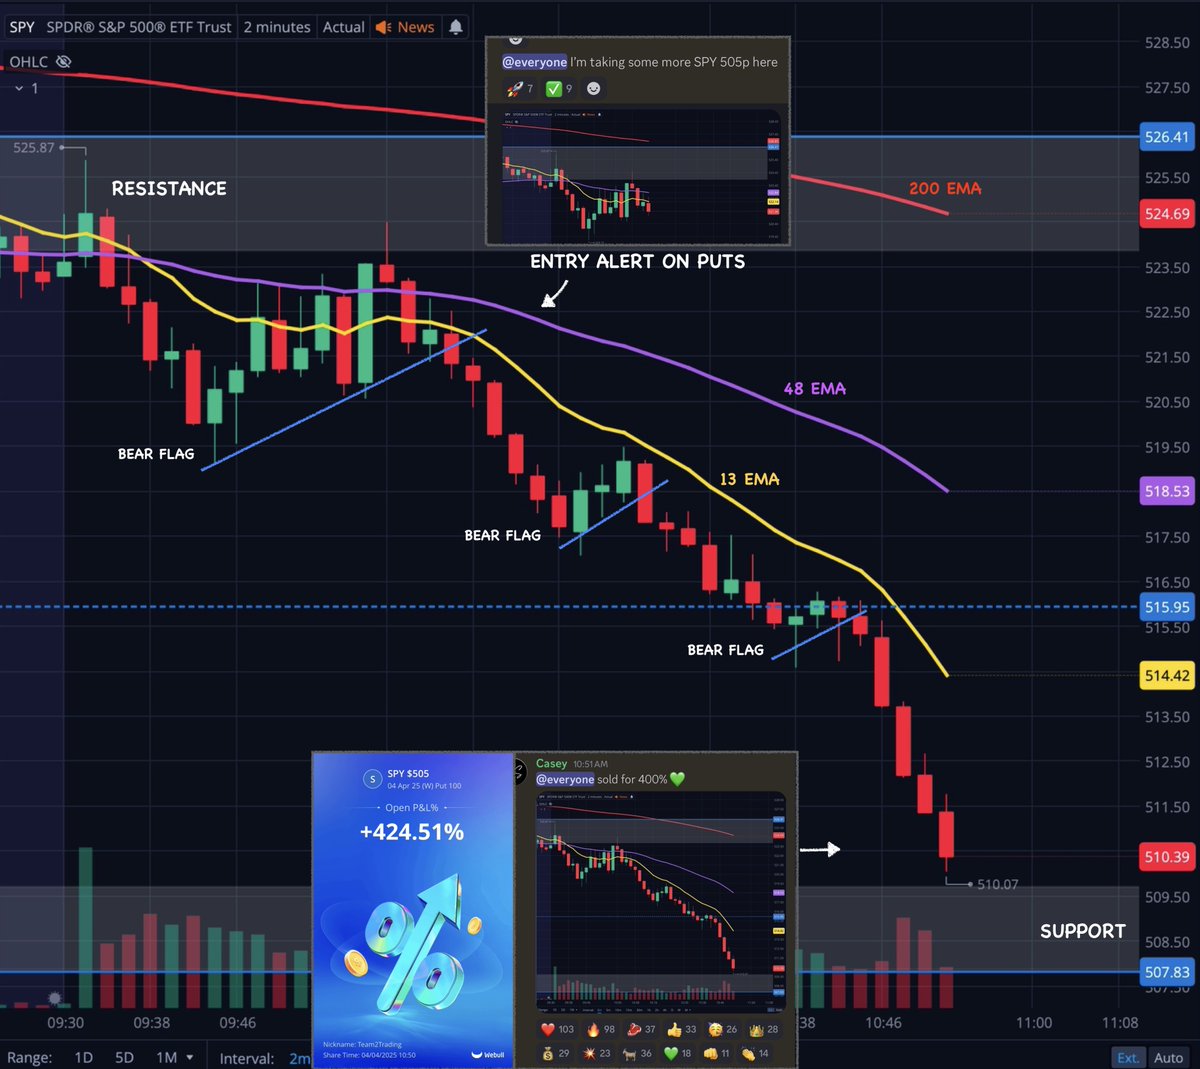
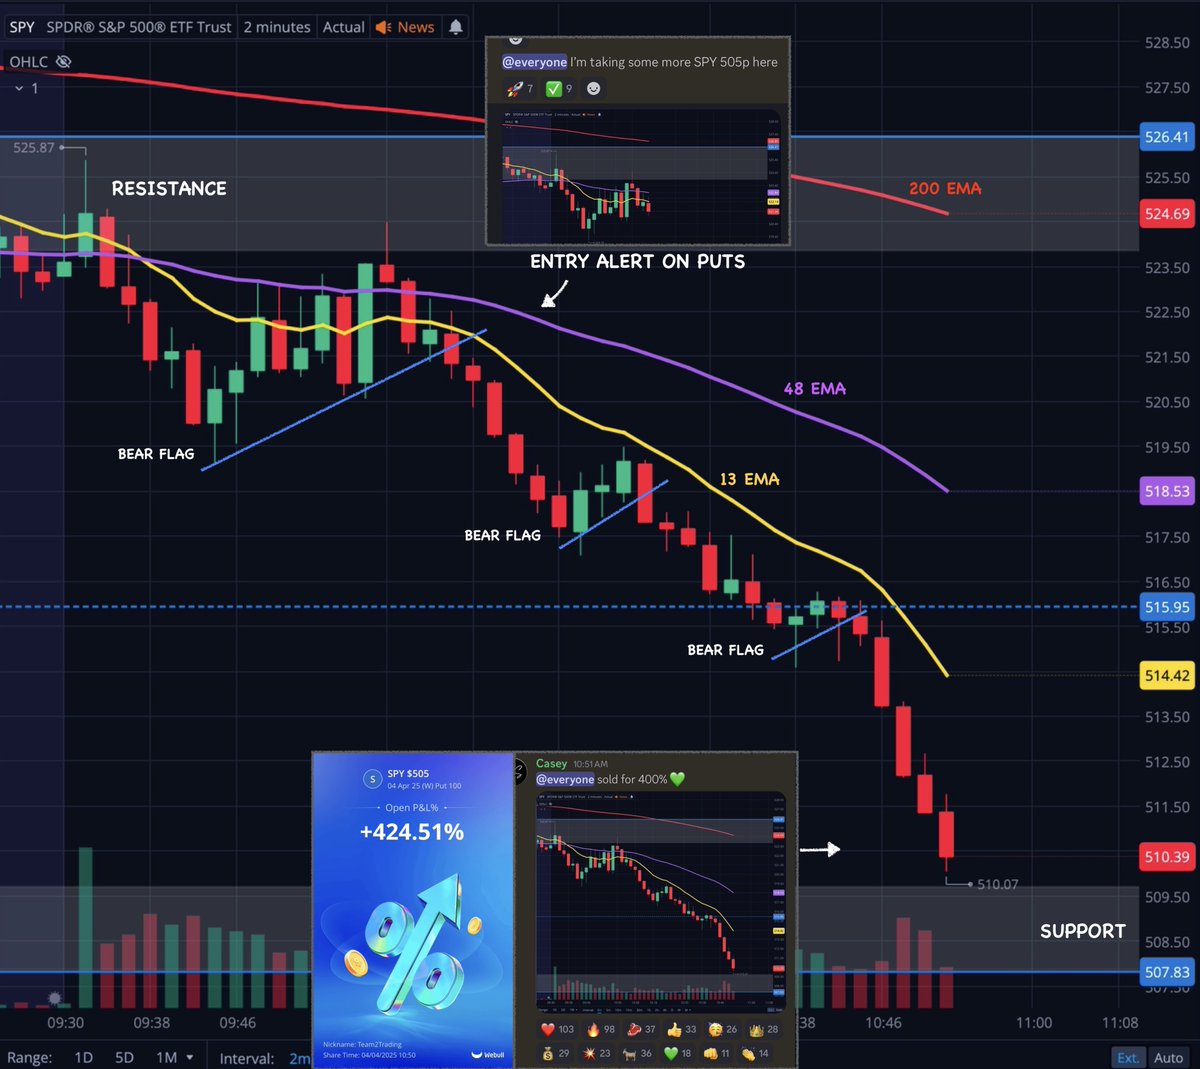
Another trade example from this week on $SPY
+400% on some puts. Why was i short?
Below Previous Day Low ✅
Bearish EMA trend ✅
Bear Flagging ✅
We were in a downtrend here with multiple entry opportunities to capture a piece of this momentum👇
+400% on some puts. Why was i short?
Below Previous Day Low ✅
Bearish EMA trend ✅
Bear Flagging ✅
We were in a downtrend here with multiple entry opportunities to capture a piece of this momentum👇
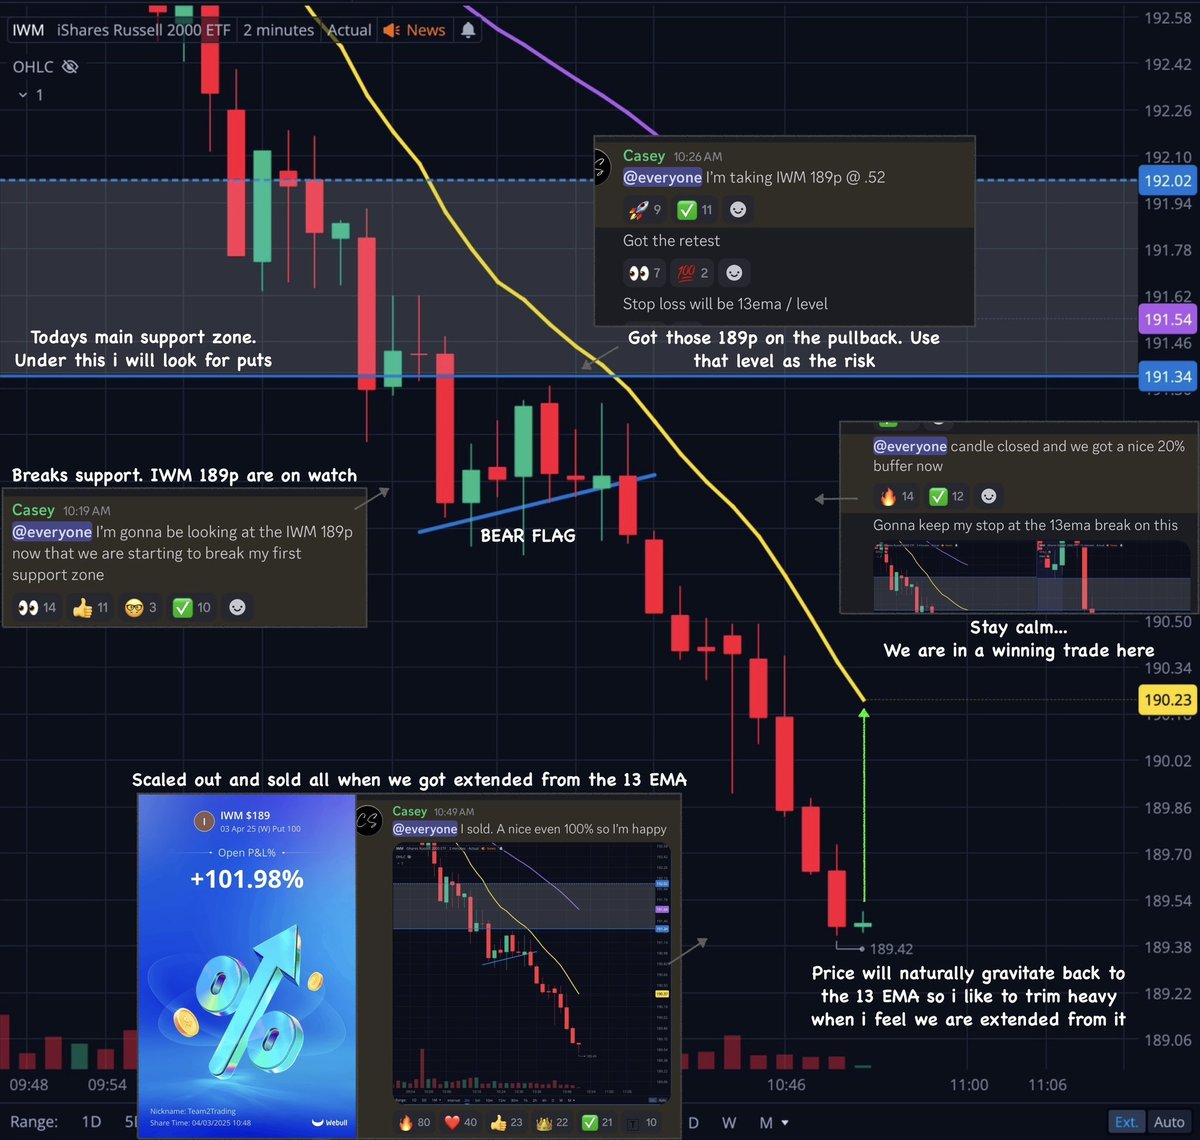
Another example of a trade I took and alerted this week!
+100% on some $IWM puts. Why was I short?
Below Previous Day Low ✅
Bearish EMA trend ✅
Bear Flagging ✅
It's just a simple effective way to read price action!
+100% on some $IWM puts. Why was I short?
Below Previous Day Low ✅
Bearish EMA trend ✅
Bear Flagging ✅
It's just a simple effective way to read price action!
Those are my 3 cheat codes for trading $SPY & $QQQ
So whether the market is going up or down... I have an unbiased technical edge that allows me to capture a piece of the trends.
Thanks for reading everyone! Like & share it to help out the Fintwit community 💚

So whether the market is going up or down... I have an unbiased technical edge that allows me to capture a piece of the trends.
Thanks for reading everyone! Like & share it to help out the Fintwit community 💚
• • •
Missing some Tweet in this thread? You can try to
force a refresh


