This is possibly the most important chart a bond trader needs to look at right now. Not only will this determine your curve sector bias and inform your macro regime expression, it will be one of your key road-markers over the next 12 months.
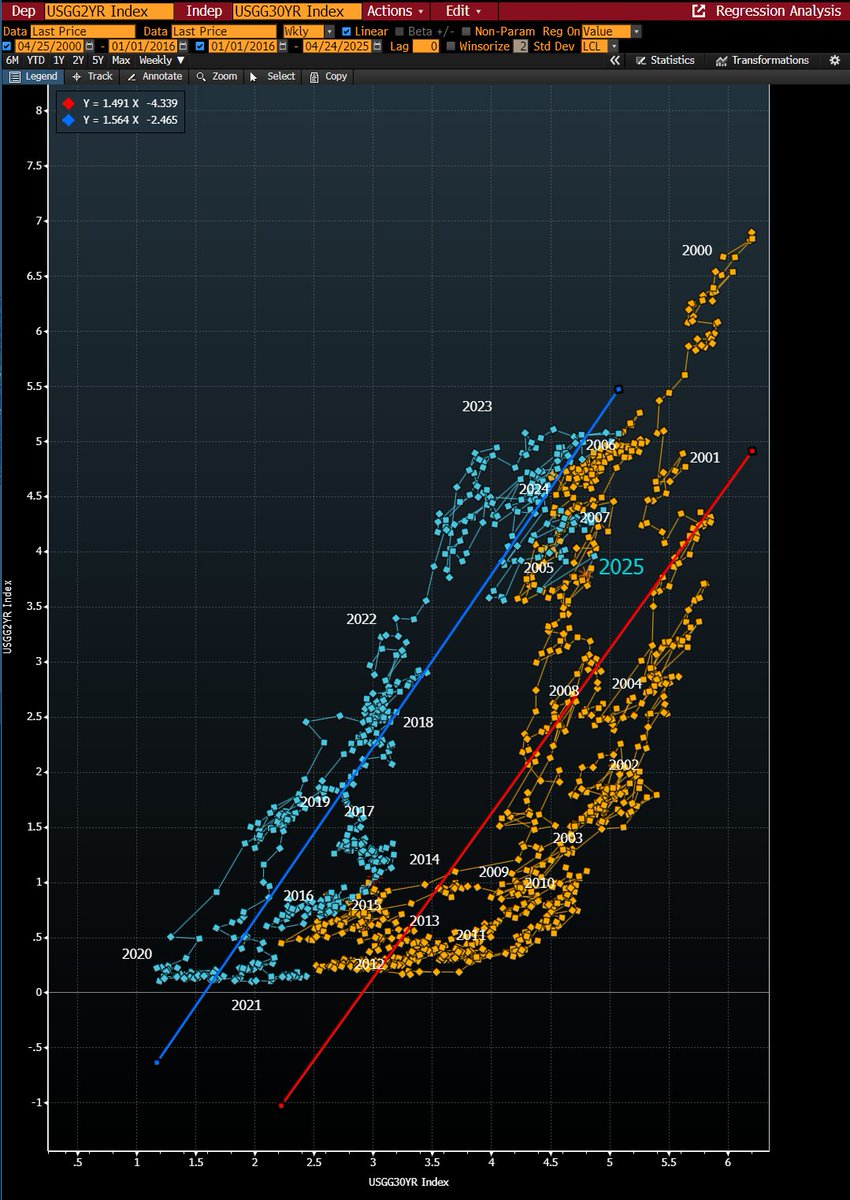
Two important things: 1. The distribution shifted left post-2015 into a flatter curve world. This occurred coincidentally or not, with China's shock devaluation which further fostered deflationary conditions
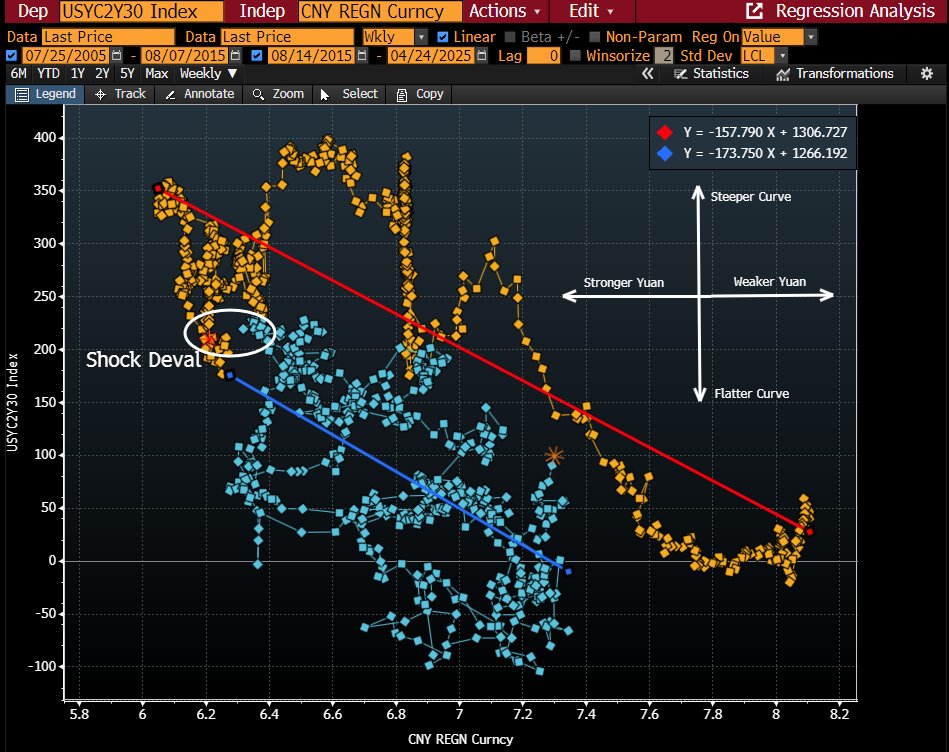
2. We have spent the last 2 years shifting back to the old distribution thanks to the return of inflation. If this holds then the the historical path of growth regimes speaks volumes on the relative attractiveness of the different curve sectors going forward.
• • •
Missing some Tweet in this thread? You can try to
force a refresh
As much as this is an outlook of the year ahead it’s a review of past views. In November, fresh off the election I wrote the following thread and not much has changed but here’s the lowdown: 1. Equity price has moved faster than earnings but remains correlated 2. Mid-year risk unwind was mechanical but underpinned by growth scare 3. June CPI ignited consensus for cuts – but Fed went big and now looks like a mistake 4. TY skew is back to negative, forward cuts are getting priced out 5. Risk of curve bear flattening less durable. I favoured bear steepening, which was right 6. HY issuance has been shortened, relying on rate cuts to materialize 7. Dollar is rate dependent for now 8. Clearing of rate vol sets it up for an expansion that could upset fincon 9. Gold like rate vol, was a hedge whose use was over post-election but I thought could still come back x.com/EffMktHype/sta…
Since then, I can happily report that much of it was on point 1. Equity valuations and spreads have marginally weakened 2. This was driven by tighter fincon as yields rose, the curve bear steepened and vol sustained/increased 3. Dollar has continued its march higher (which tends to be an SPX headwind) 4. Gold demand has sustained as inflation concerns gained traction
So let’s look at the basic framework of
1.Why or why not do I want to own bonds
2.And depending on that, where do I want to put my money otherwise
To begin, let’s look economically. The U.S. 3Q24 GDP was 2.7% YoY and is expected to come in at 2.4% for the full year. On a quarterly basis, growth in the US has been accelerating through 2024 with 3.1% annualized in the 3rd quarter. Globally, it’s well above everyone else. In terms of inflation however, everyone is pretty in line.
What does this mean? Assuming the trend persists, with higher growth and similar inflation I would expect the U.S. sees an overall higher level of nominal interest rates relative to its peers.
Haven't done a markets thread in a bit but it's good for me to journal this out so I can spot mental mistakes and gaps when I review this. Main question for me is, where are we now and can we keep going?
The main question is actually where did we come from to get here, as things don't feel as simple as I once thought.
/
There have been three major economic events in the last 6 months (I'm ignoring market events like August selloff) marked out on the chart: 1. The June CPI released in late July ⚪️ 2. The first Fed rate cut of the cycle (by 50bps) 🔵 3. The U.S. presidential and general election🔴
Using that main chart as our framework let's break it down into detail one by one.
SPX Forward P/E (12mths blended forward) have moved largely in line with price, generally implying that earnings expectations have lagged while price was the driving factor.
Contrast this to periods like 2009 where P/Es were rangebound while price trended higher, indicating that earnings expectations were growing in line with price appreciation. I.e. companies grew into their valuations as opposed to valuations growing with the market like now.
/
Hello and welcome to Backtest Tuesday!
Welcome to Backtest Tuesday! This will be an ongoing discourse for everyone to participate in random backtesting, realize market falsehoods and try out things that may or may not work, myself included! We will use the terminal backtesting function (augmented with custom studies) and through the week the thread is open to ANY idea within the parameters of the model.
To recap, last week we added some basic trend and breakout rules to the range-bound strategy and tweaked the exits. The equity curve looks nice, our objective function (profit factor) has been maximized while drawdowns have been lowered. Today we take the next step and move into testing with out of sample data to see how awesome this strat is!
drumroll please
Here is the "OOS" return from 2023 to present!
.
..
...
......fuck.
Welcome to Backtest Tuesday!
This will be an ongoing discourse for everyone to participate in random backtesting, realize market falsehoods and try out things that may or may not work, myself included! We will use the terminal backtesting function (augmented with custom studies) and through the week the thread is open to ANY idea within the parameters of the model.
To recap, last week we built a range-trading strategy for Russel 2000 Futures using moving retracement levels. The ultimate goal is to try and build an all-in one model that switches between range-bound and trend following.
They key points from the range-bound strategy are: 1. Short at the upper retracement, long at the lower retracement 2. Only when price action is range-bound 3. And only if that range is compressed 4. We stop out if price action exits the established range and losing more than 2.5% at the close 5. We place trailing stops using retracement levels inside the range where short term momentum is weak
Please read last week's thread QT'd here for a full rundown of how we got here.
This week - we will tackle the trend portion!
The equity curve of the model with just range-trading is what we expect to see, a general positive performance during sideways periods with pockets of being flat during larger moves (and naturally expanded volatility). The aim now is to fill in these quiet periods with effective positioning to capture trend.
Based on the final poll from last week, you guys prefer to trade on a breakout. These blends into the range-bound strat as we are already trading using resistance and support levels. So the simplest way to implement a breakout strat is to use our stops.
This will be an ongoing discourse for everyone to participate in random backtesting, realize market falsehoods and try out things that may or may not work, myself included! We will use the terminal backtesting function (augmented with custom studies)
Through the week the thread is open to ANY idea within the parameters of the model. To start...
This week we will use Russell 2000 futures. The objective for this week is to find out: 1) Can you build a model that switches between range-bound and trending 2) How do you trade either one 3) Is it even worth it?
For the sake of simplicity we will use the following parameters: 1. A constant capital amount of 100k (no compounding) with 1MM equity. 2. Daily frequency 3. Long/Short 4. 2017-2022 as our in-sample period. At the end we will then review performance using 2023-2024 as our out of sample period.
To set up the first part of this I will naively define the asset as being range-bound if it is trading in between two (or more) established levels in a lookback and trending to be anything outside of that.
To set up the rangebound conditions, I am using moving retracement levels built in STDY
The top panel defines the parameters for the lookback period, and 4 variable retracement levels.
The middle panel is to output the moving retracement levels and the bottom is just to output the actual data onto the chart.
Here is the moving retracement "bands" output in our in-sample data. For the time being we are using the classic Fibonacci retracement levels (76.4/61.8/50/23.6)
The reason why I bring up the neutral rate is because I think the market is actively debating it without realizing it or explicitly saying so.
Much of the consternation around Fed pricing right now is how many cuts is appropriate this year, but that implies that cuts themselves are appropriate.
One of the key tenets for this view is that with inflation moderating and (to a lesser extent) activity cooling, the NOMINAL Fed Funds rate, if left unchanged gets more restrictive as inflation falls due to the real-FF increasing (Nominal-FF minus Inflation = Real-FF). Thus, in order to cool the economy without overtightening the Fed has to cut rates.
The extension of this is that should the Fed see the soft landing they are hoping for, inflation is at/near target while growth is at a steady state. For now the median long run expectation is 2.5% nominal FF which implies a 0.5% real-FF with 2% inflation.
Cameron Crise picked up on this with Waller's Q&A on Jan 16.