My strategy for day trading $SPY 🧵
Learn to identify & execute your own high quality trades.
Let's begin👇
Learn to identify & execute your own high quality trades.
Let's begin👇

My goal : Identify the trend & capture a piece of it.
To accomplish this I use areas of support & resistance combined with EMA trends & basic chart patterns.
*I have found this approach gives me all the info I need to find & alert high quality trades in real time, without clouding my judgement or over complicating it 👇
To accomplish this I use areas of support & resistance combined with EMA trends & basic chart patterns.
*I have found this approach gives me all the info I need to find & alert high quality trades in real time, without clouding my judgement or over complicating it 👇

Support & Resistance :
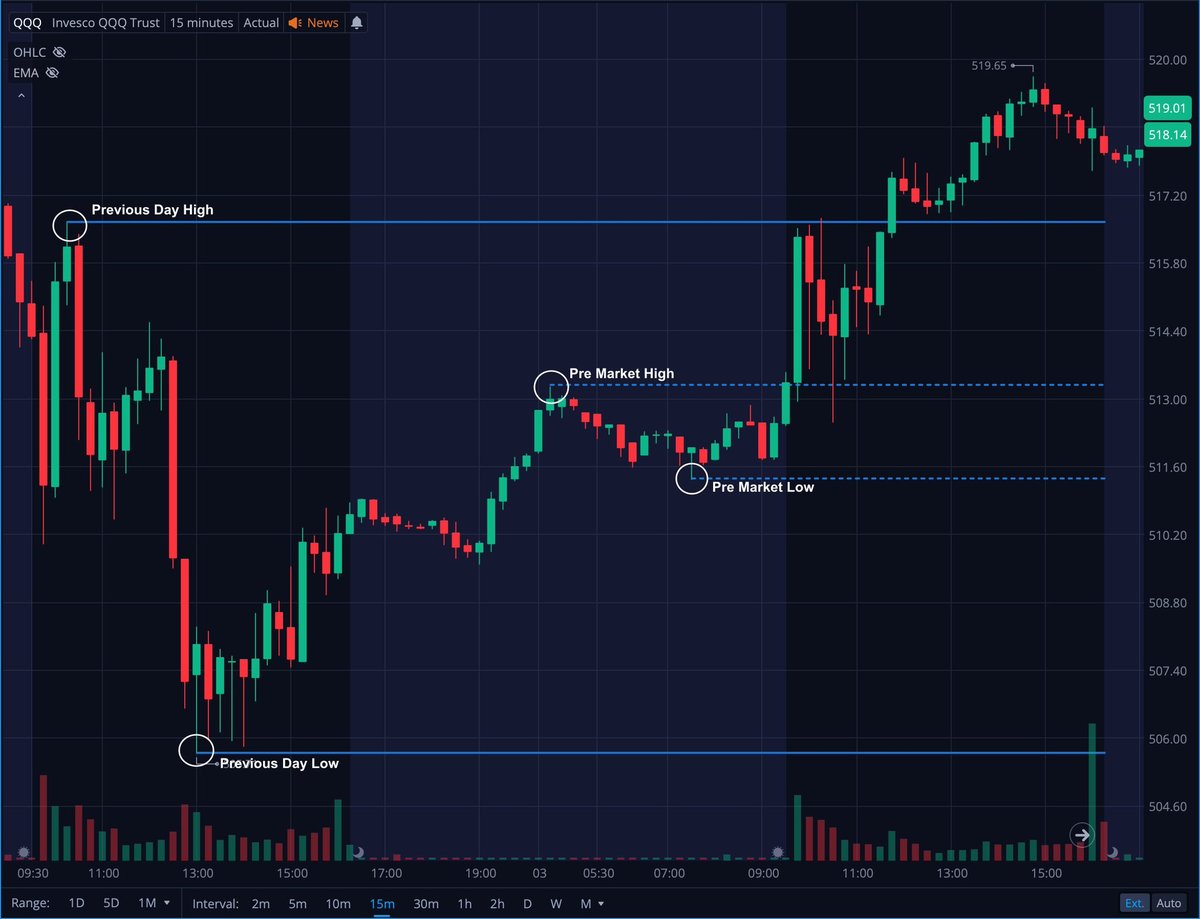
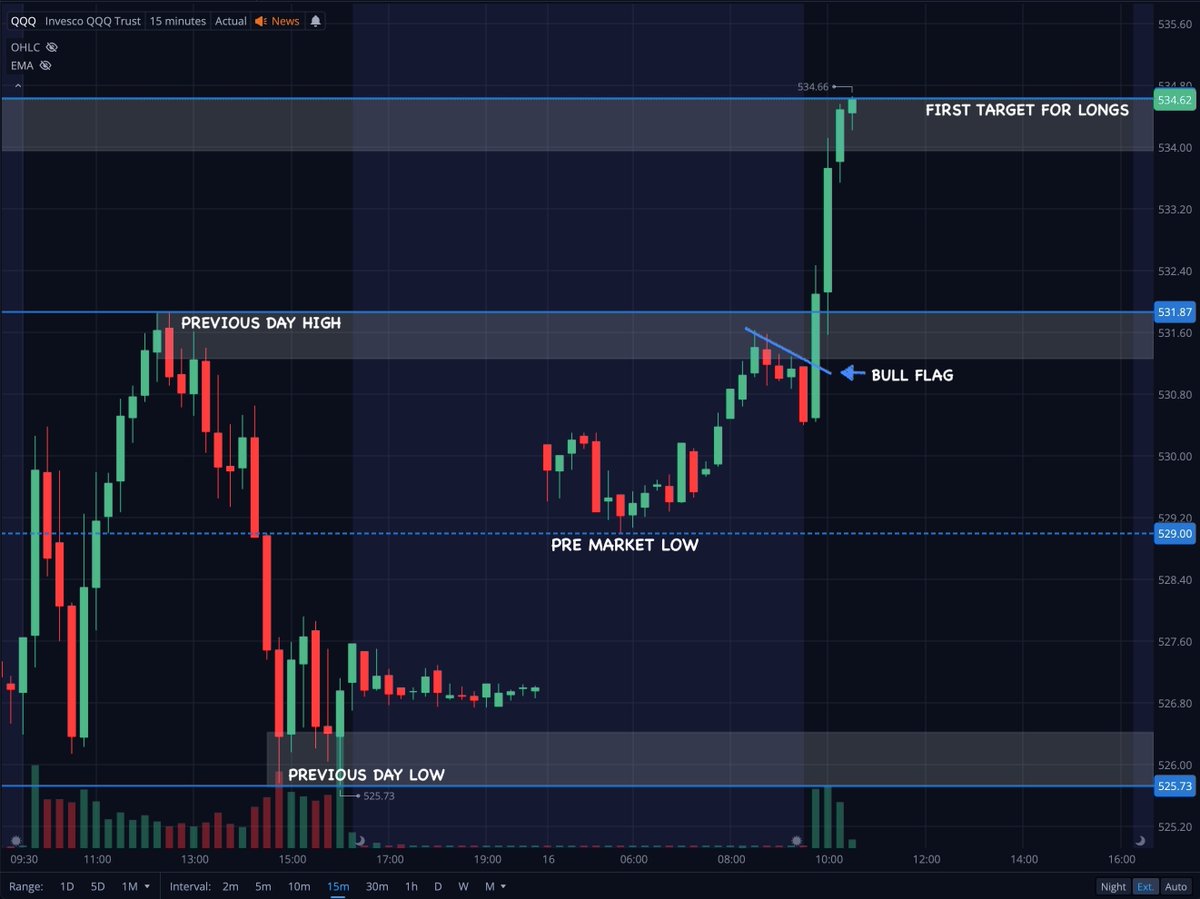
Start by charting out these 4 levels everyday before the market opens ✍️
Previous Day High✅
Previous Day Low✅
Pre Market High✅
Pre Market Low✅
Previous Day High / Low = The highest & lowest price of the previous trading session (RTH)
Pre Market High / Low = The highest & lowest price from 4am to 9:30am EST.
Visual example of where to find those levels 👇

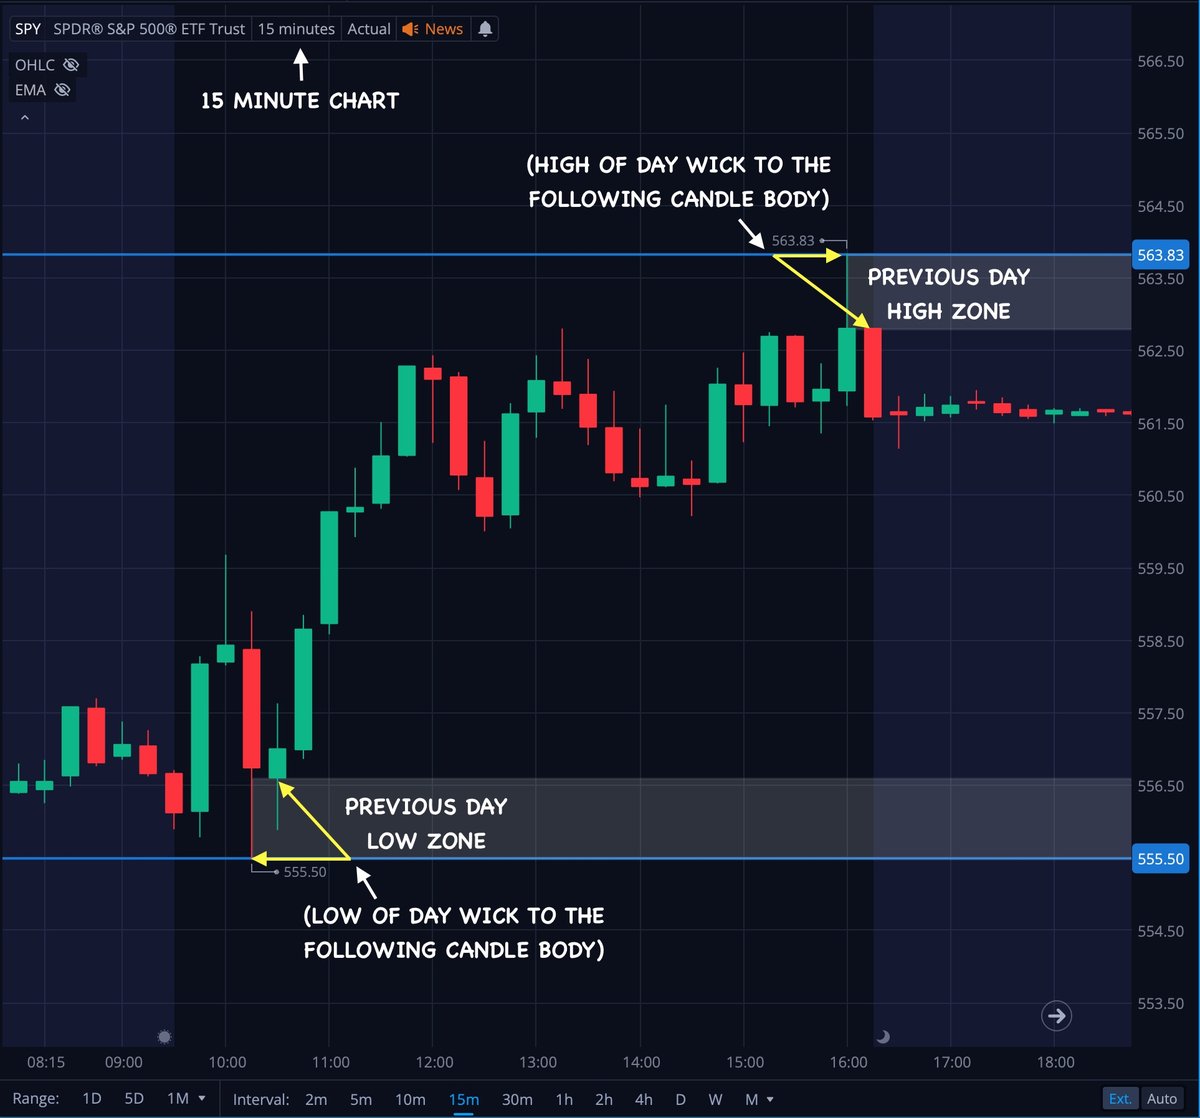
I create a small zone using those Previous Day High & Low levels. This gives me my area of support / resistance to watch.
I do this on the 15 minute chart.
I do this on the 15 minute chart.

The Pre Market High & Low levels are my secondary range to watch.
I leave these marked as dotted lines on my chart.
I leave these marked as dotted lines on my chart.

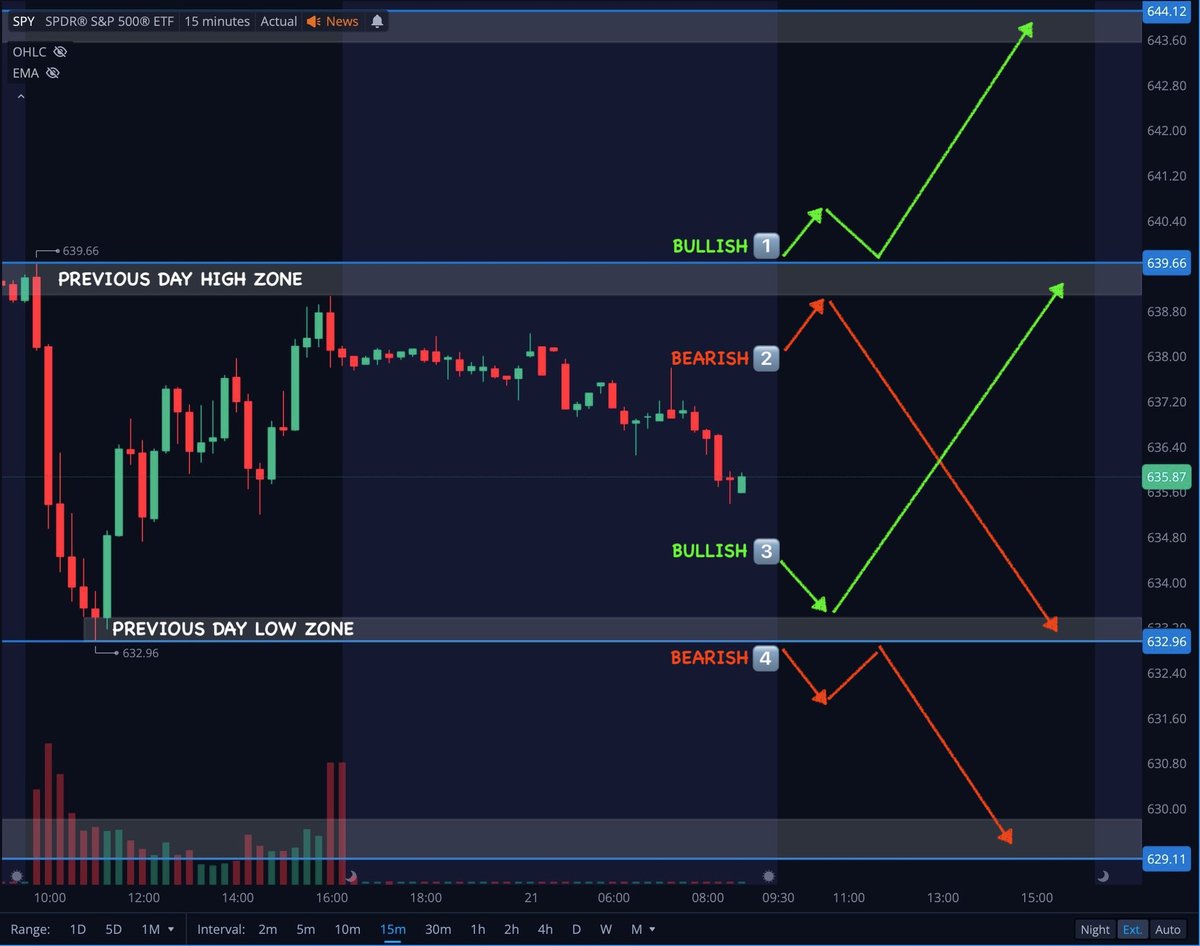
Now... One of the best ways to form your daily bias is by watching the reaction to those Previous Day High & Low zones👀
These are the 4 main scenarios I'm watching :
Break PDH = Bullish Bias 📈
Reject PDH = Bearish Bias 📉
Hold PDL = Bullish Bias 📈
Break PDL = Bearish Bias 📉
Here's a visual example of what I'm looking for 👇
These are the 4 main scenarios I'm watching :
Break PDH = Bullish Bias 📈
Reject PDH = Bearish Bias 📉
Hold PDL = Bullish Bias 📈
Break PDL = Bearish Bias 📉
Here's a visual example of what I'm looking for 👇

Typically we see more one sided momentum when price breaks outside of that Previous Days Range.
Keep that in mind, balanced days between the PDH & PDL can be a bit more choppy 👇
Keep that in mind, balanced days between the PDH & PDL can be a bit more choppy 👇

I like to use that info and be a little more cautious on range days. I typically size my positions something like this...
If price is inside both the Previous Day High & Low + Pre Market High & Low I'm being very cautious (RISK OFF)
If price is outside of both of those ranges I take a more RISK ON approach.
It's a simple range vs trend outlook.
Not a hard rule for me but its something to keep in mind, especially for newer traders who get caught up in choppy conditions often 👇

Okay so the levels & zones are marked and ready to go! Very simple right?
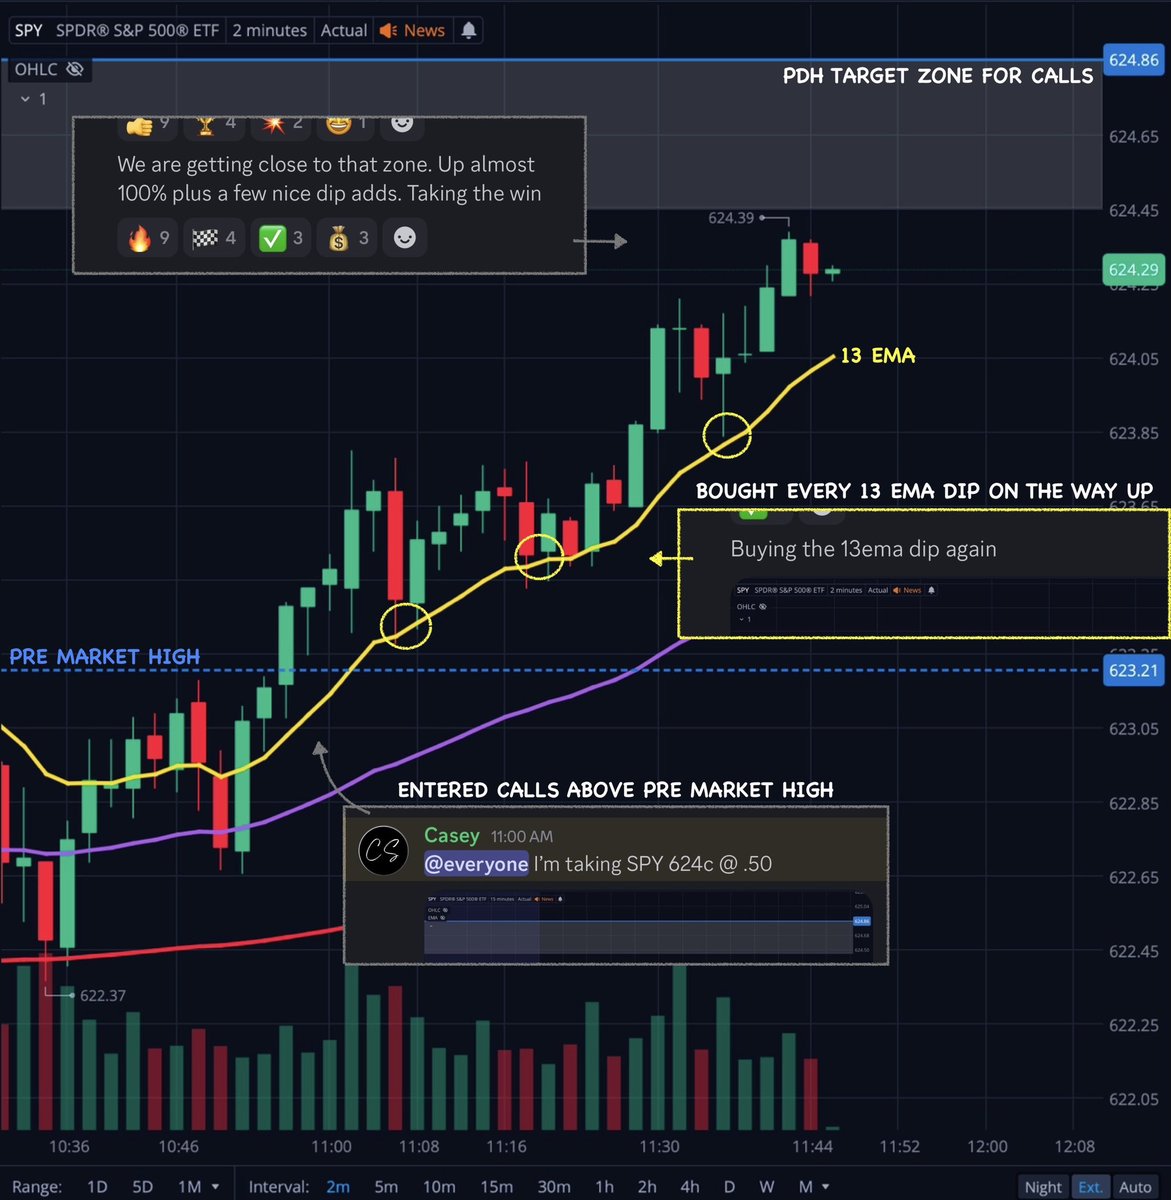
Now I turn on the EMA's...
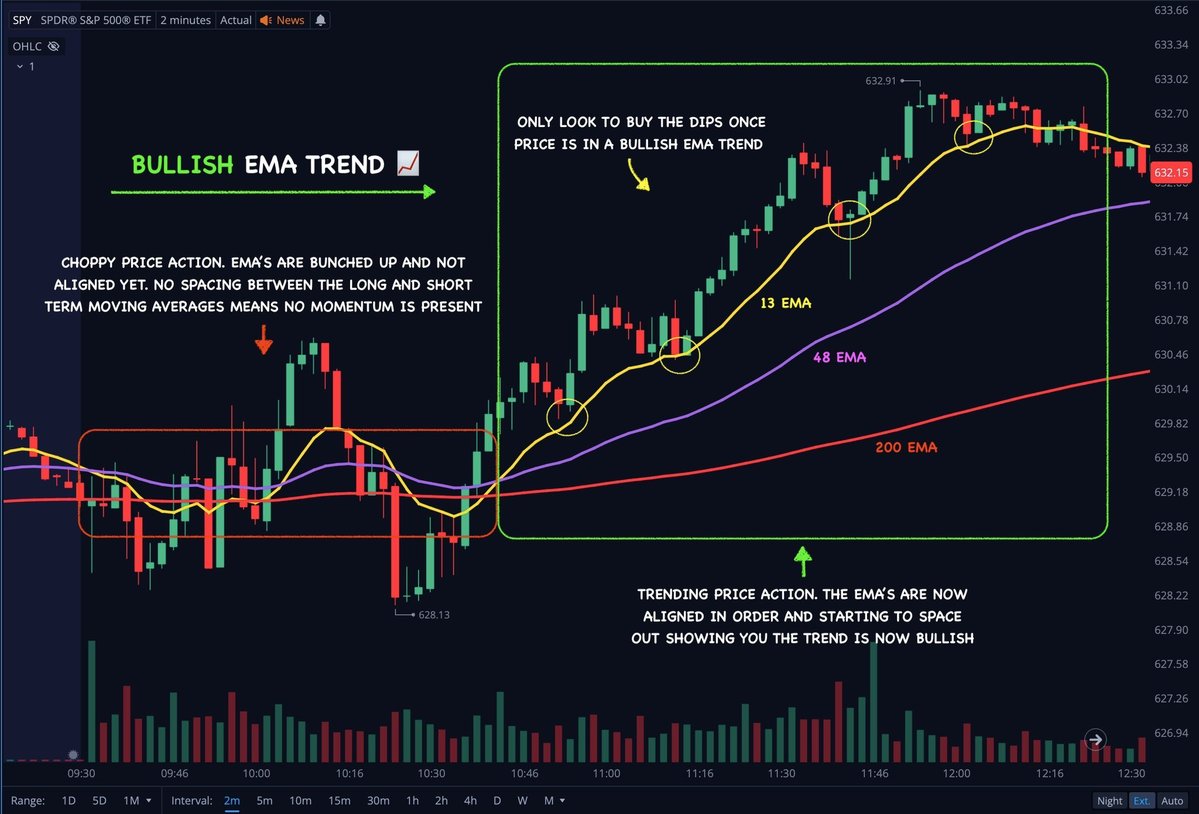
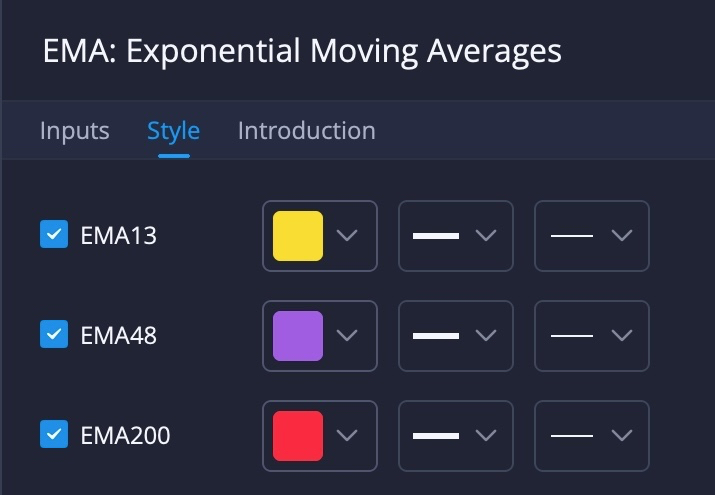
I use the 13 , 48 , 200 EMA's. They work great on most timeframes but I'm typically using them on the 2 minute chart.
These help with everything from identifying trends, avoiding chop, entries, exits etc...
Now I turn on the EMA's...
I use the 13 , 48 , 200 EMA's. They work great on most timeframes but I'm typically using them on the 2 minute chart.
These help with everything from identifying trends, avoiding chop, entries, exits etc...
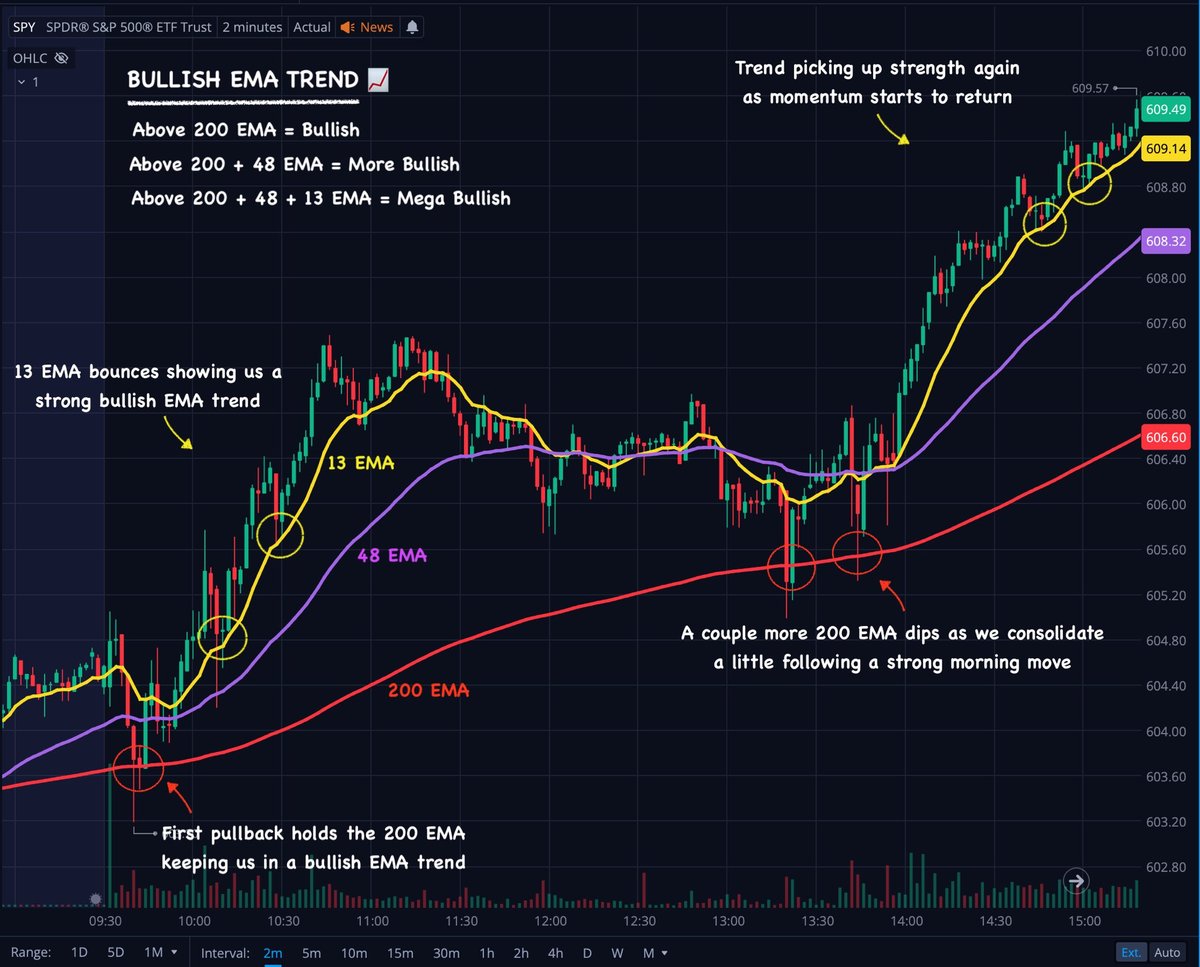
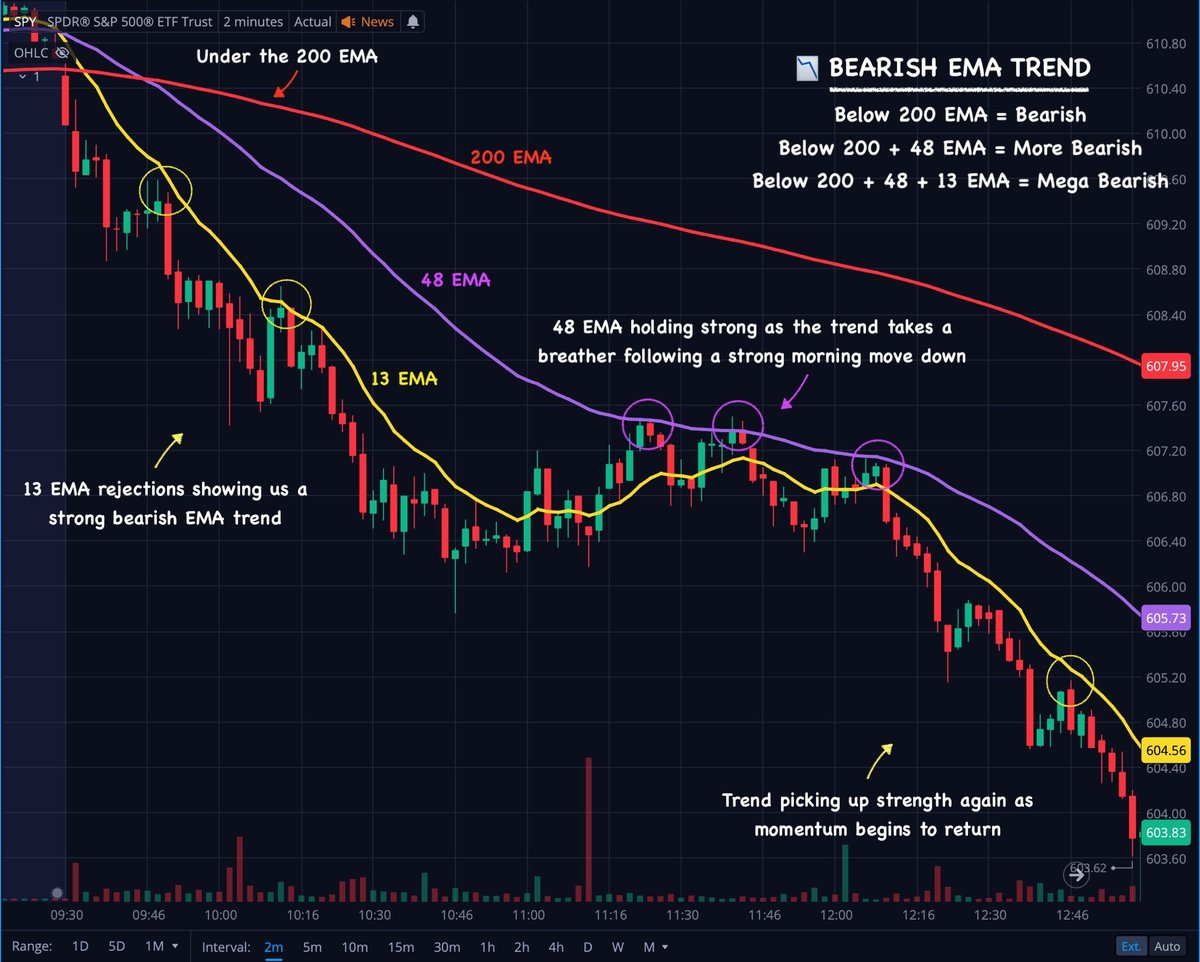
Bullish vs Bearish EMA trends 📈📉
Study these cheat sheets! They will be a game changer for you👇
Study these cheat sheets! They will be a game changer for you👇
Bull / Bear Flags ✍️
There are tons of chart patterns out there to master.
None are as simple & effective as flags.
Learn to identify Bull & Bear flags for momentum and added confirmation. You will be very glad you did 👇
There are tons of chart patterns out there to master.
None are as simple & effective as flags.
Learn to identify Bull & Bear flags for momentum and added confirmation. You will be very glad you did 👇


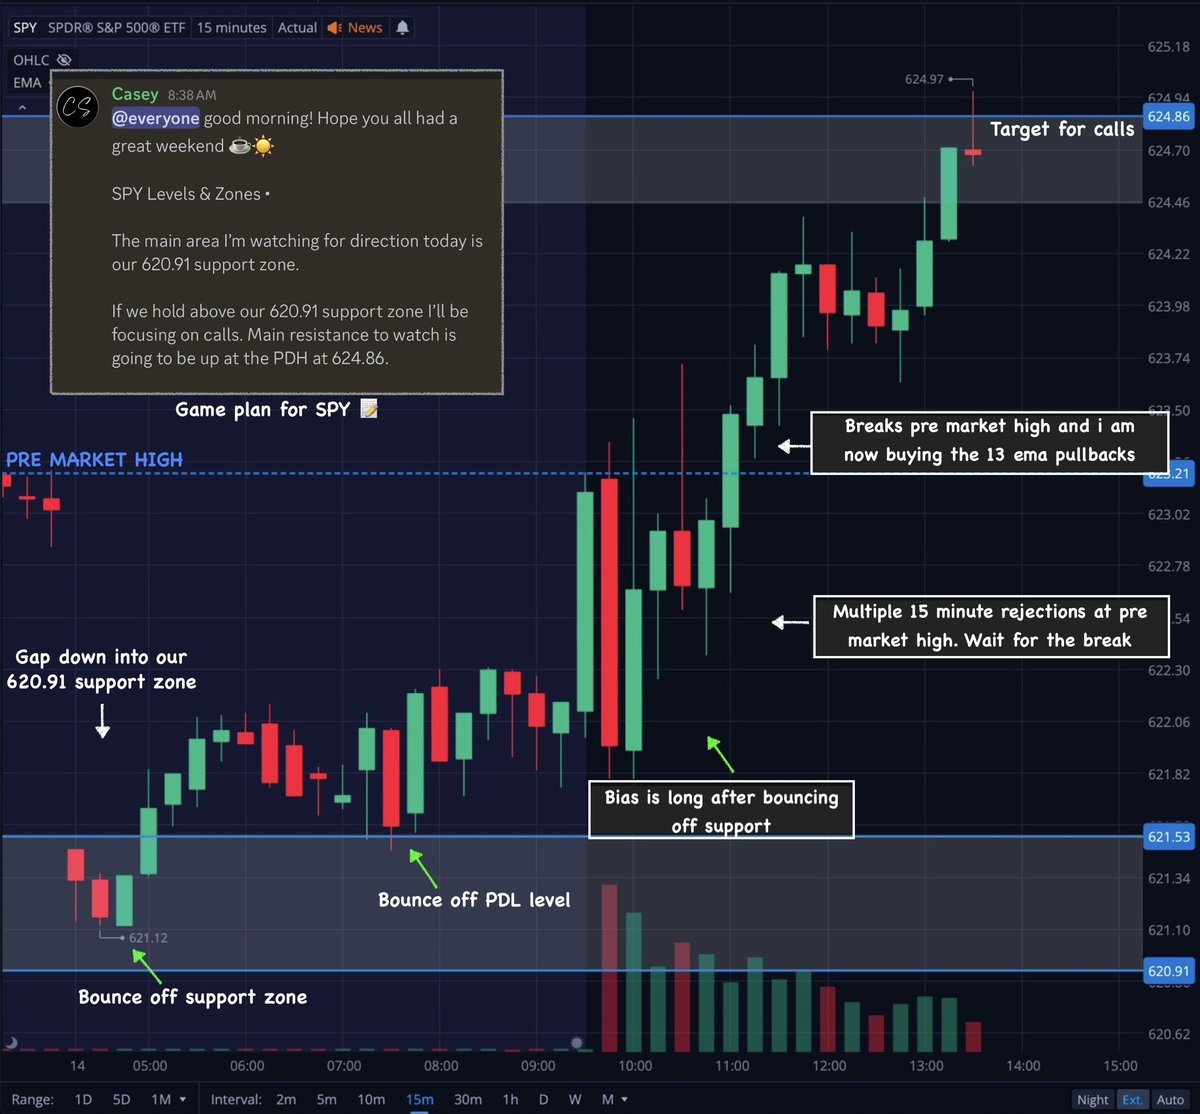
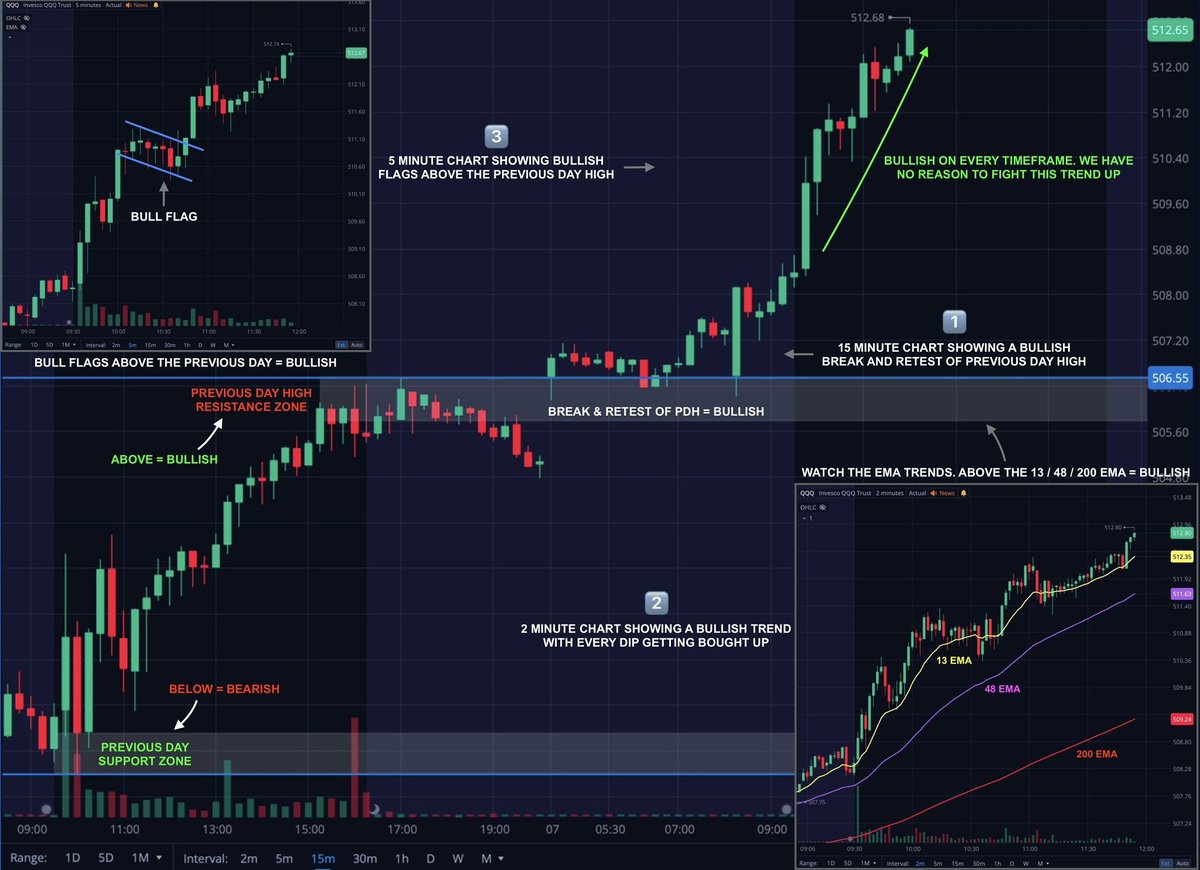
Now lets get caught up on what we are working with here to find some A+ trades...
Support & Resistance ✅
EMA trends ✅
Flags ✅
This gives me multiple confirmations to help me trade trends like this with confidence 👇
Support & Resistance ✅
EMA trends ✅
Flags ✅
This gives me multiple confirmations to help me trade trends like this with confidence 👇

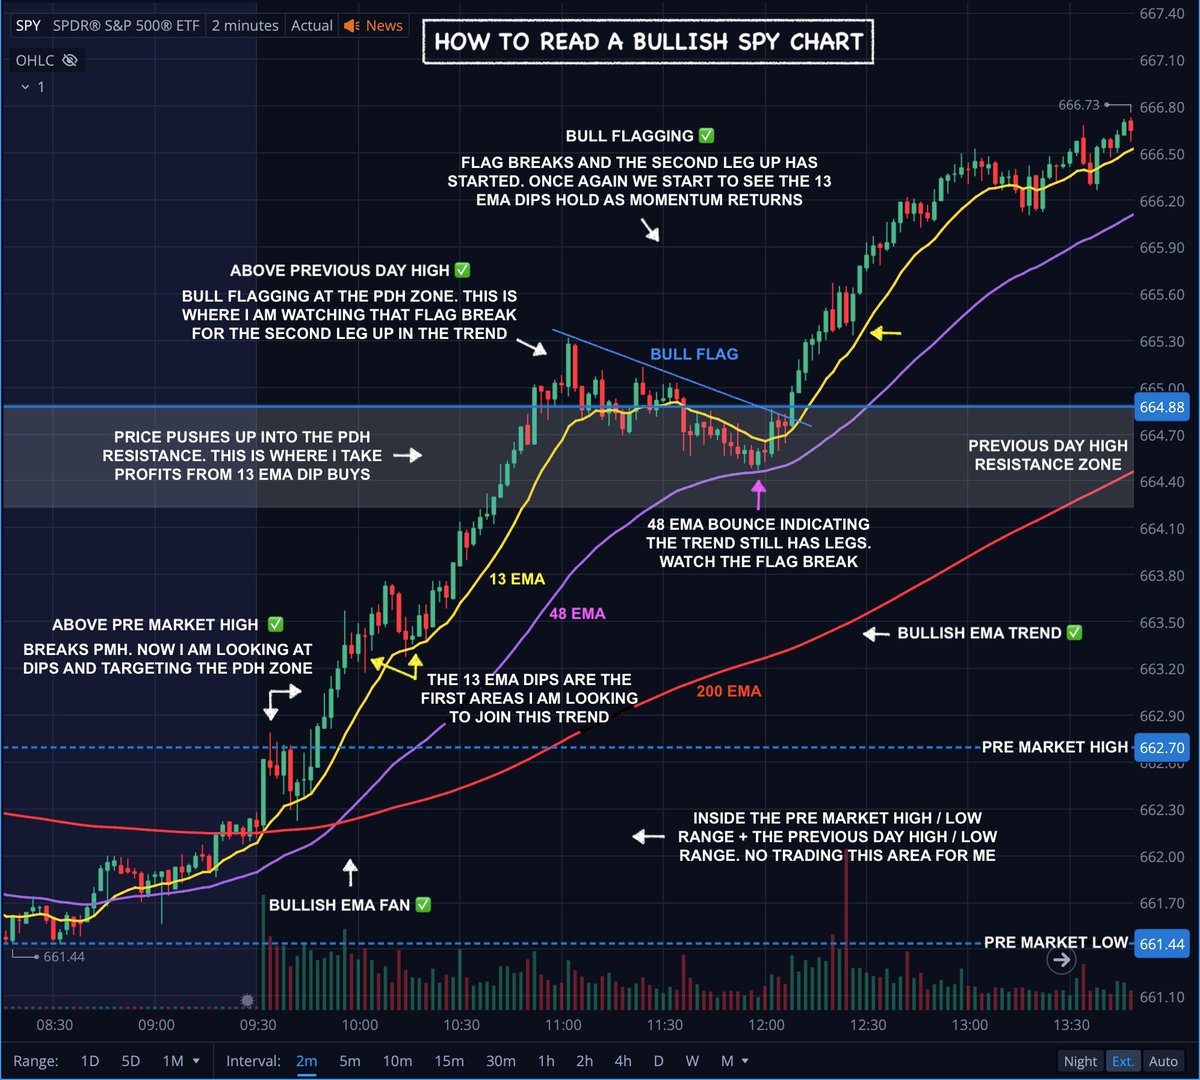
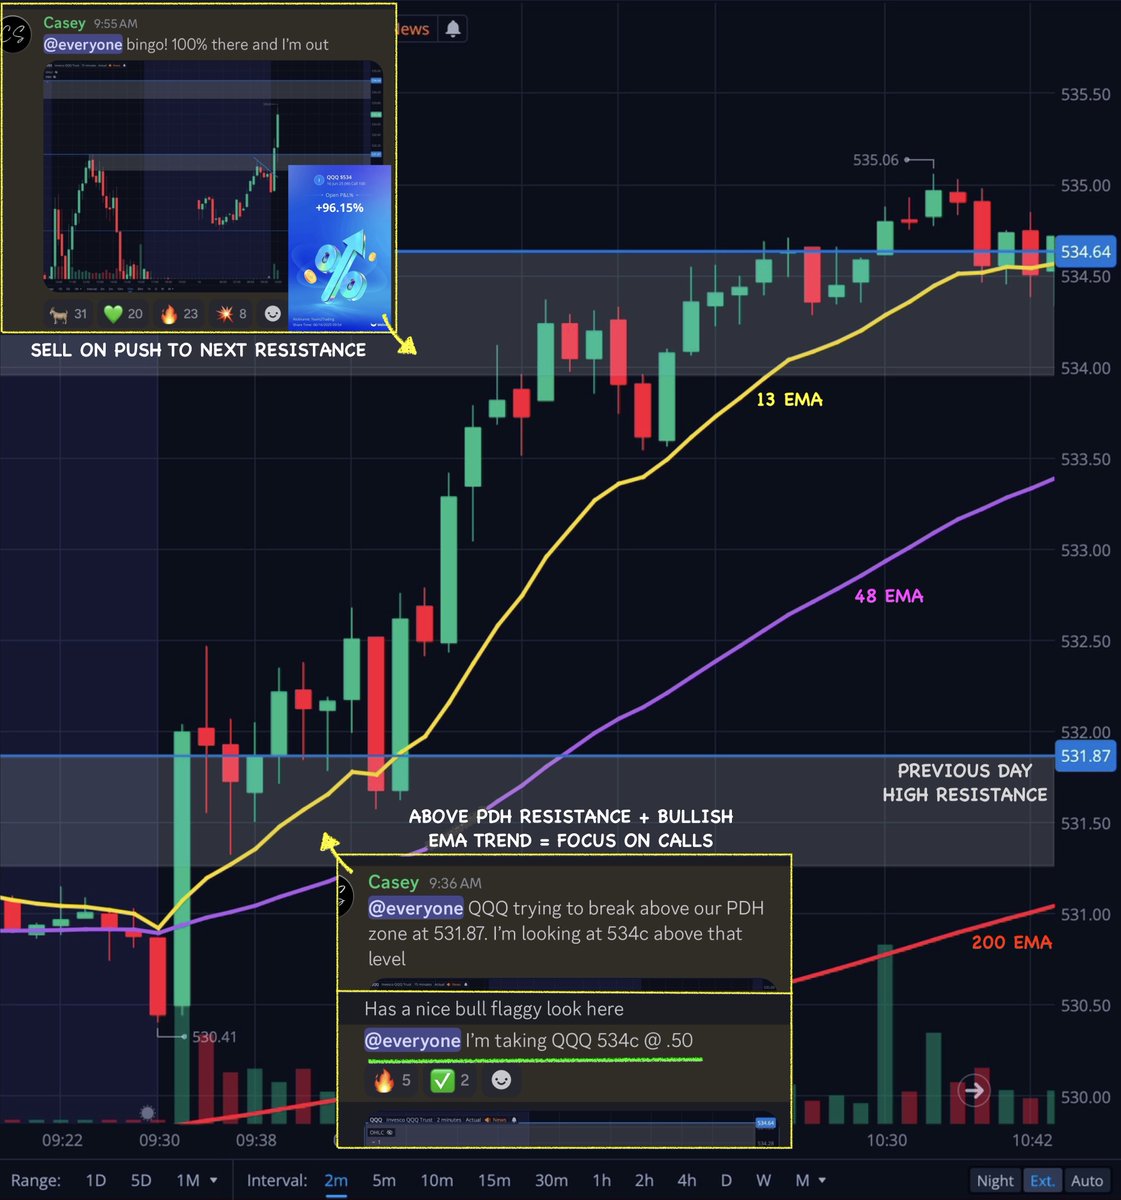
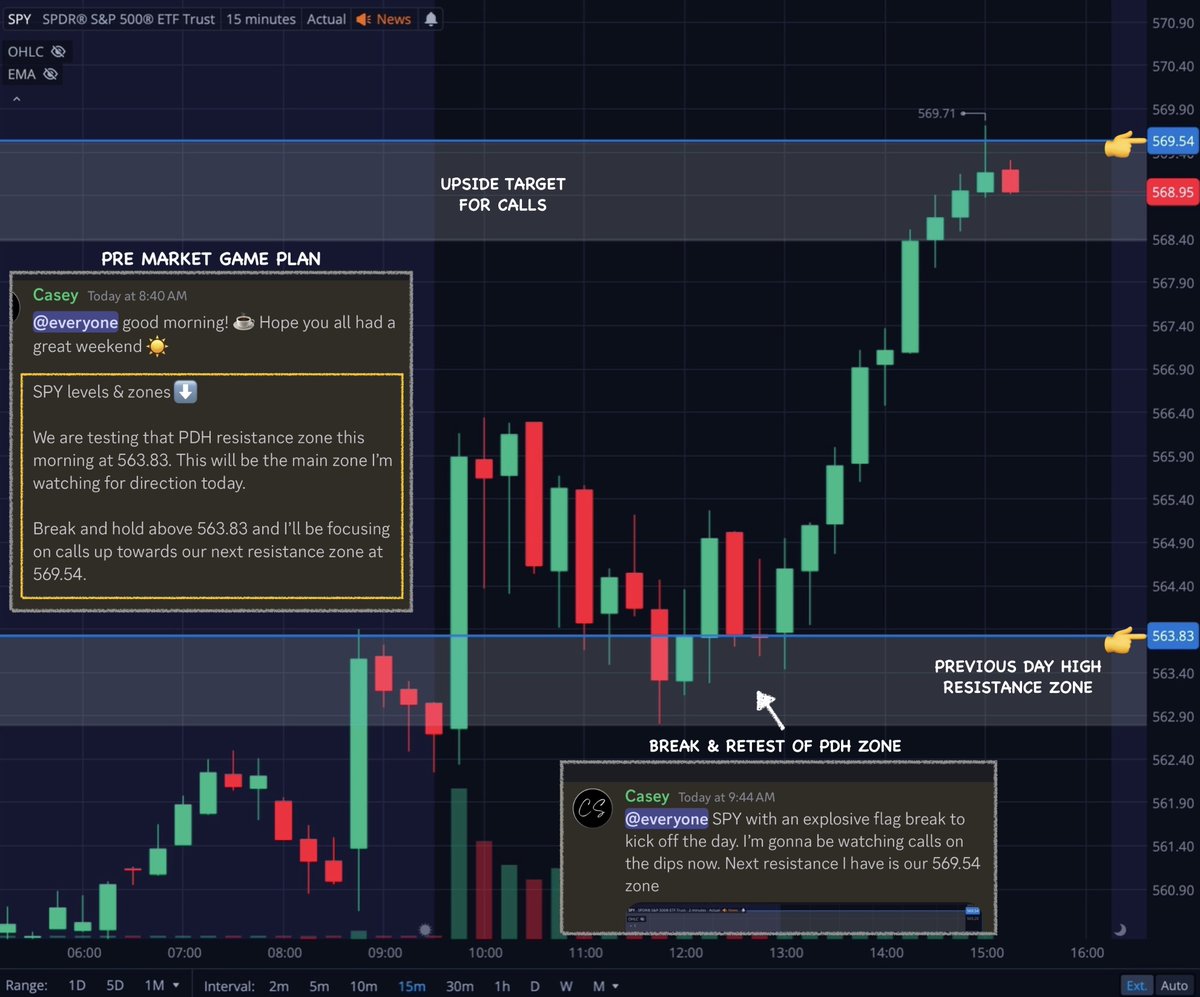
A+ trade on calls 📝
Breaks PDH resistance ✅
Bullish EMA trend ✅
Bull Flagging ✅
Multiple confirmations for upside.
0 confirmations for downside.
Breaks PDH resistance ✅
Bullish EMA trend ✅
Bull Flagging ✅
Multiple confirmations for upside.
0 confirmations for downside.
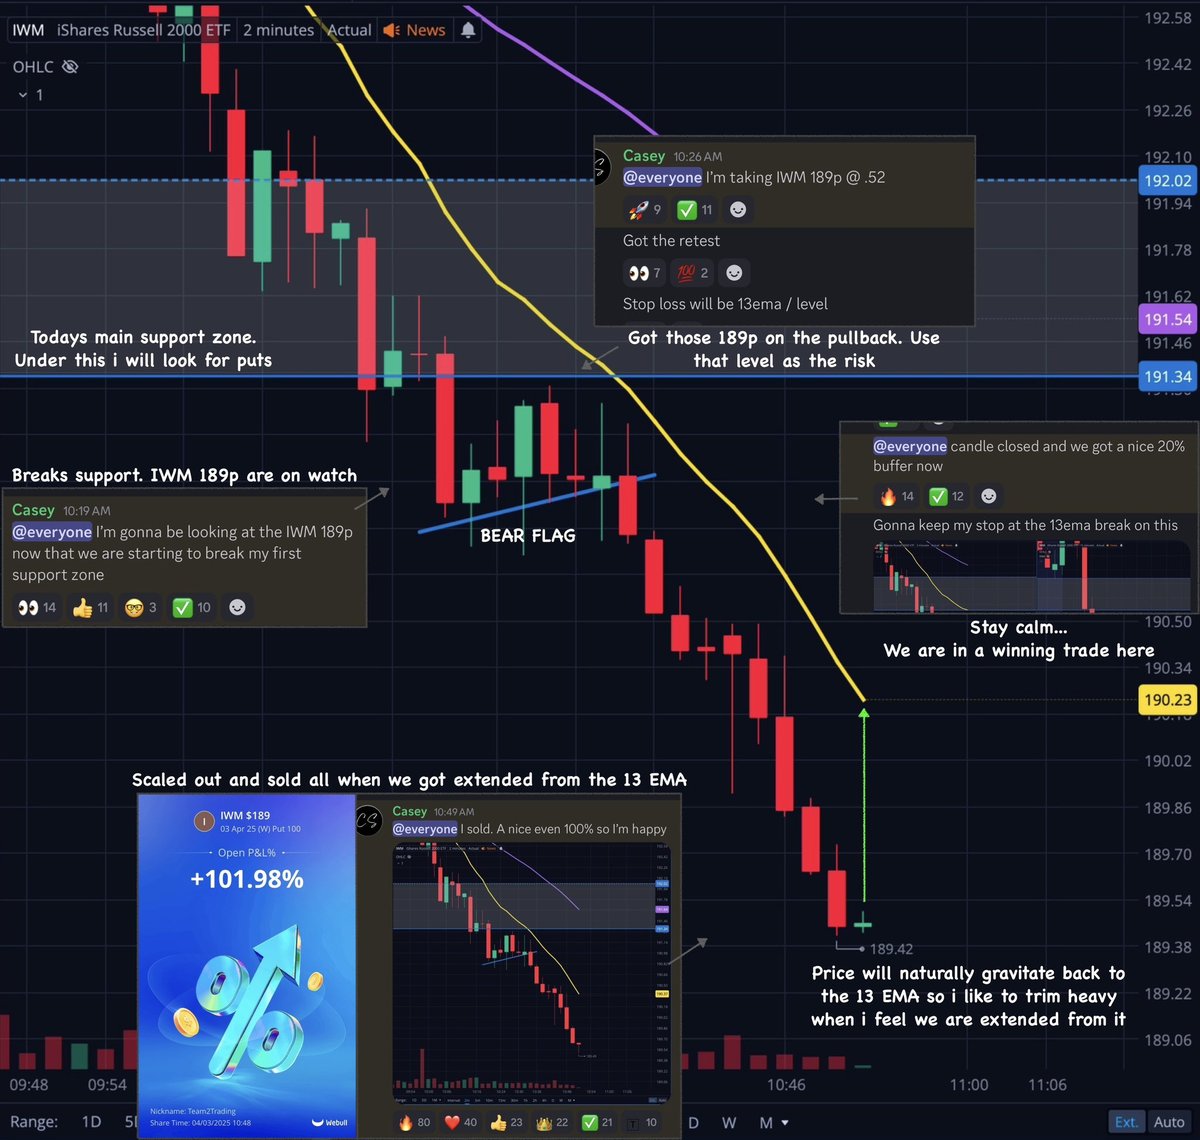
A+ trade on puts 📝
Breaks PDL support ✅
Bearish EMA trend ✅
Bear Flagging ✅
Multiple confirmations for downside.
0 confirmations for upside.
Breaks PDL support ✅
Bearish EMA trend ✅
Bear Flagging ✅
Multiple confirmations for downside.
0 confirmations for upside.

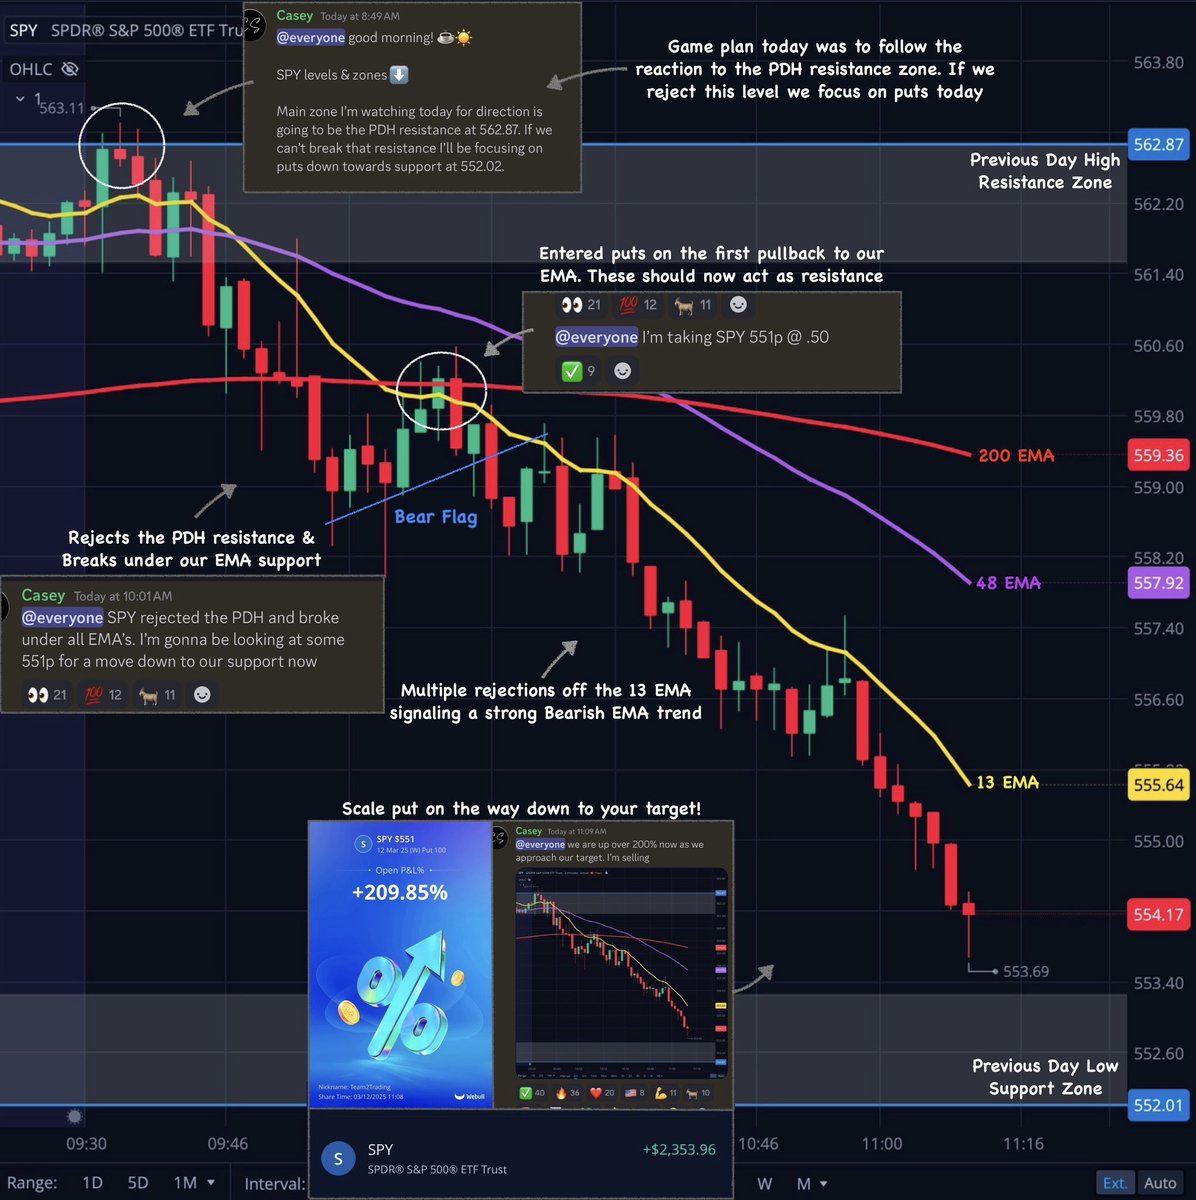
A+ range trade on puts 📝
Rejects PDH resistance ✅
EMA trend flips Bearish ✅
Bear Flagging ✅
Rejects PDH resistance ✅
EMA trend flips Bearish ✅
Bear Flagging ✅
A+ range trade on calls 📝
Bounces at PDL support ✅
Bullish EMA trend ✅
Bull Flagging ✅
Bounces at PDL support ✅
Bullish EMA trend ✅
Bull Flagging ✅

Support & Resistance combined with EMA trends!
Simple... Effective... Game changing 👇
Simple... Effective... Game changing 👇

There's only so much I can cover in a single thread!
Make sure to follow along for daily tips, trade recaps , breakdowns, threads, etc...
And don't worry, I only post charts and trades that I personally took & alerted in real time. No hindsight nonsense over here 🤙
Make sure to follow along for daily tips, trade recaps , breakdowns, threads, etc...
And don't worry, I only post charts and trades that I personally took & alerted in real time. No hindsight nonsense over here 🤙


Have a great weekend everyone!
And remember, have fun and enjoy the process.
Trading is a privilege that we are very lucky to have 💚
And remember, have fun and enjoy the process.
Trading is a privilege that we are very lucky to have 💚
• • •
Missing some Tweet in this thread? You can try to
force a refresh