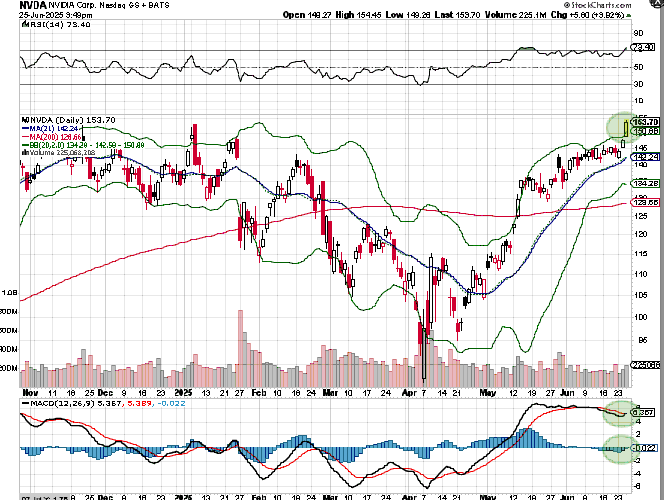
NVIDIA $NVDA Stock Analysis & Buy Levels We're Watching To Add More
NVIDIA's stock has been red-hot, but is it time for a pullback or will the rally continue? In today's detailed breakdown, we dive into multiple charts 

Now take a look at the Point & Figure chart. NVDA triggered an ascending triple top breakout pattern on June 9th and has followed through strongly. The bullish price objective from this formation is 216. 

The $216 Price objective may sound aggressive, but this chart has a solid track record, and we’ve seen similar vertical runs in prior phases.
The last confirmed P&F breakout in early 2024 led to a 40% rally in just two months. If history rhymes, we could be looking at another sharp push into Q3.
Let’s talk about the options market—which is screaming bullishness. The 150 strike calls saw over 55,000 contracts traded today, with open interest surging past 113,000. Even the 160 and 170 strikes showed triple-digit percentage gains. 

More telling: 152.50 and 155 #nvda calls are trading with aggressive premiums, and the 165s and 170s are seeing outsized volume. This suggests that institutions aren’t just chasing, they’re positioning for continuation. 

@threadreaderapp unroll
Get our options trades in realtime;
Patreon: SoraTrades
Get our options trades in realtime;
Patreon: SoraTrades
• • •
Missing some Tweet in this thread? You can try to
force a refresh


