Options Trading University Profile picture
Jun 28 8 tweets 2 min read Read on X
$AAPL A Thread: Bollinger Band Squeeze: Volatility is compressing, and #AAPL is riding the top half of the band. This “squeeze” often precedes a sharp move, and since price is pressing against the upper band, that favors an upside resolution.y channel. Image
In the chart above, AAPL is exhibiting a classic Bollinger Band compression, often referred to as a volatility squeeze. This phenomenon occurs when the upper and lower bands contract tightly around price due to prolonged low volatility.
Statistically, such contractions precede periods of expansion, and thus signal the likelihood of an impending sharp directional move.
This target aligns with prior resistance and would represent a ~10% rally. However, failure to break above the 50-day resistance could result in a retracement to the mid-$190s. In short, this Bollinger Band squeeze reflects a market in stasis, storing potential energy. Image
The next expansion will likely define the dominant trend for weeks to come.
This looks like a coiled spring, and if price clears $205 with volume, it could ignite toward $215–220 short term. But if it gets rejected at the 50-day MA again, expect a pullback to $195, but a close above the 50-day is the buy signal that we need is still pending.
A break of that zone would negate the recent attempt at a base and could trigger downside toward $179, which is the 200-day on the weekly chart. @threadreaderapp unroll
If you want to learn how to trade options, get our trades in real time everyday - join us by searching for SoraTrades on Patreon or tap the link in the bio

• • •

Missing some Tweet in this thread? You can try to force a refresh
 

Keep Current with Options Trading University

Options Trading University Profile picture

Stay in touch and get notified when new unrolls are available from this author!

Read all threads

This Thread may be Removed Anytime!

PDF

Twitter may remove this content at anytime! Save it as PDF for later use!

Try unrolling a thread yourself!

how to unroll video
  1. Follow @ThreadReaderApp to mention us!

  2. From a Twitter thread mention us with a keyword "unroll"
@threadreaderapp unroll

Practice here first or read more on our help page!

More from @OT__University

Jun 25
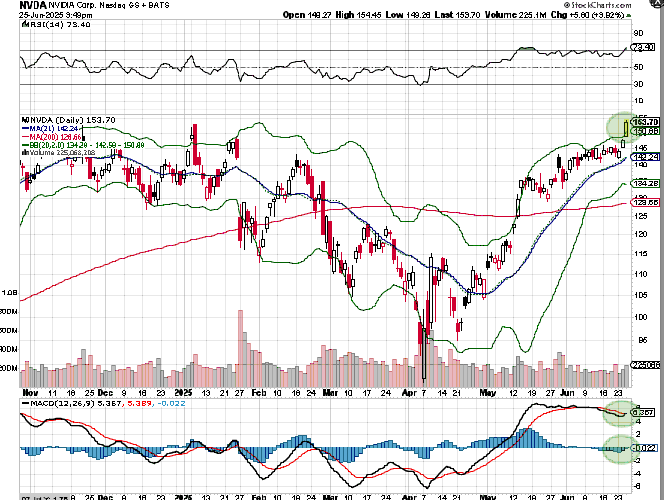
NVIDIA $NVDA Stock Analysis & Buy Levels We're Watching To Add More
NVIDIA's stock has been red-hot, but is it time for a pullback or will the rally continue? In today's detailed breakdown, we dive into multiple charts Image
Now take a look at the Point & Figure chart. NVDA triggered an ascending triple top breakout pattern on June 9th and has followed through strongly. The bullish price objective from this formation is 216. Image
Read 8 tweets
Jun 23
$TSLA Tesla Just Triggered a Massive Breakout

But Can It Hold?

Is the next move higher?

This thread dives deep into whats going on with the chart $QQQ $NIO
TSLA just triggered a textbook Triple Top Breakout on the Point & Figure chart with a bullish price objective of $439.

That’s a 25% potential move from current levels, and today’s volume surge adds serious weight behind the signal.
This right here is what traders dream of, a Triple Top Breakout confirmed on the daily P&F chart. Image
Read 8 tweets
Jun 21
A Thread: My Favorite 5-Minute Trading Setup That Just Works.

Let’s talk edge. This is a AND avoid FOMO Chasing)5-min scalping strategy I’ve used for years to catch high-probability moves. (AND avoid FOMO chasing)
All I this strategy needs is two moving averages:

20 EMA and the 50 EMA

Start by identifying the trend. If both the 20 EMA and 50 EMA are sloping up, we’re in a bullish environment. You're only looking to buy dips (not shorting). Image
Setup Logic: Price pulls into the 20 or 50 EMA with VWAP support nearby Wait for a 5-minute engulfing candle or hammer - doesn't matter if you trade $TSLA $SPY or $AAPL or any US stock or #crypto Image
Read 7 tweets
Jun 20
Robinhood Breakout Incoming? What’s Fueling the Surge? $HOOD Image
Robinhood #HOOD stock has rocketed this year, climbing from the low $10s to a recent high above near $80 an over 600% rally.
So what’s behind the surge, and is there more room to run? Let’s break it down with both fundamentals and technicals.

@threadreaderapp unroll Image
Read 6 tweets
Jun 19
The S&P 500 has reached a pivotal moment, clearly reflected in recent price action across multiple timeframes. Let's break down key levels, indicators, and targets for $SPY.
Daily Chart ($SPY at 597.44): Price action reveals an emerging bearish pattern. Notably, a clear head and shoulders pattern on the 60-minute chart signals potential downside. Image
Key Level to Watch (Neckline at 596): A decisive close below this neckline triggers a short-term bearish signal. Immediate downside targets: • ~591 (38.2% Fibonacci retracement) • 588-586 (50% retracement & 200-period hourly MA)
Read 11 tweets

Did Thread Reader help you today?

Support us! We are indie developers!


This site is made by just two indie developers on a laptop doing marketing, support and development! Read more about the story.

Become a Premium Member ($3/month or $30/year) and get exclusive features!

Become Premium

Don't want to be a Premium member but still want to support us?

Make a small donation by buying us coffee ($5) or help with server cost ($10)

Donate via Paypal

Or Donate anonymously using crypto!

Ethereum

0xfe58350B80634f60Fa6Dc149a72b4DFbc17D341E copy

Bitcoin

3ATGMxNzCUFzxpMCHL5sWSt4DVtS8UqXpi copy

Thank you for your support!

Follow Us!

:(