
🚨 Episodic Pivot - Indian Edition 🧵
Master how to trade EP setups⚡
📊 Want the Ultimate Chart Stack with real intraday EP examples + precise entry points?
✅ telegram.me/StockyMind
Master how to trade EP setups⚡
📊 Want the Ultimate Chart Stack with real intraday EP examples + precise entry points?
✅ telegram.me/StockyMind

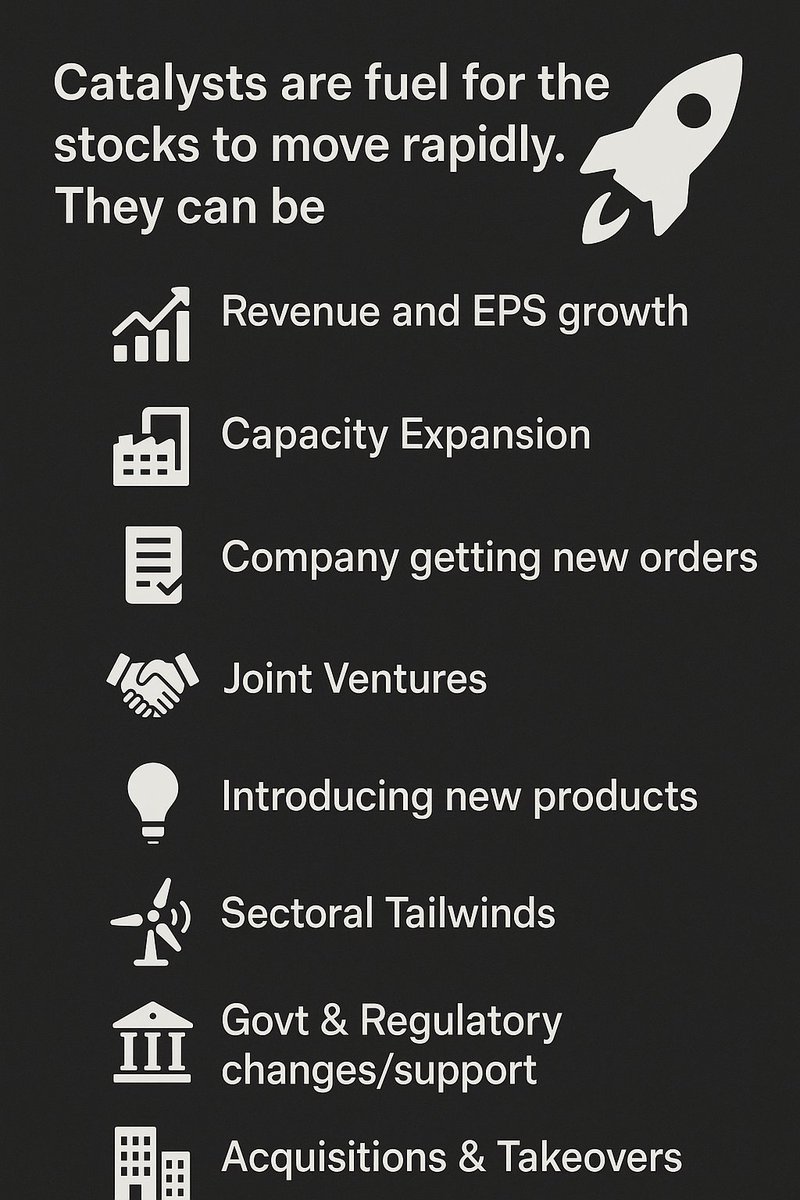
Multi-fold rallies are often fueled by robust revenue and earnings growth, steady flow of new orders, and consistent quarter-on-quarter improvement, all backed by strong technical indicators.
Usually, such stocks respond positively to news by opening with a gap-up and gradually delivering significant gains over time.
Usually, such stocks respond positively to news by opening with a gap-up and gradually delivering significant gains over time.
Buyer commitment is heavily influenced by overall market conditions.
In a bull market, stocks tend to rise with ease and broad participation. In contrast, during bear phases, only a few selective stocks see movements - often short-lived.
Sometimes, a stock reacts to a development that could potentially change the company’s long-term trajectory and trigger a sharp price acceleration.
However, in Indian markets, circuit limits often restrict immediate large-scale institutional participation once such news breaks.
There are several factors to consider, but the most crucial is the initial reaction and the quality of the follow-up action.
Reactions can broadly be classified into the following type:
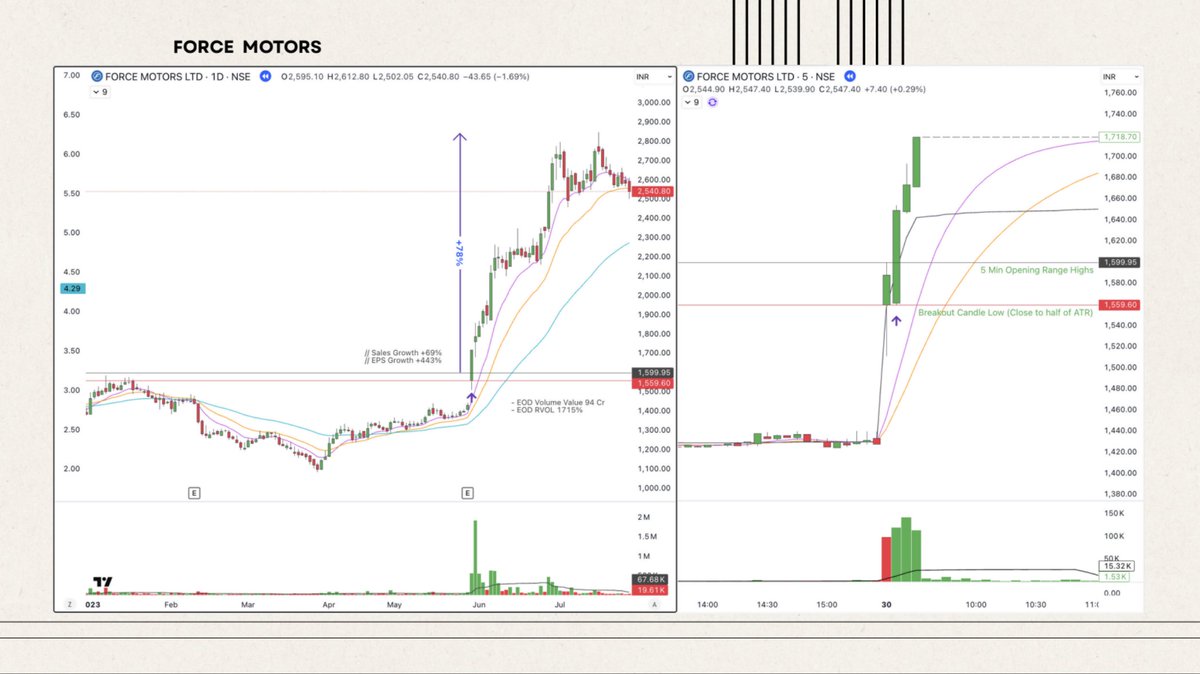
1. Break & Go
The stock opens with a gap-up, sees a powerful start with exceptionally high volumes, and follows through immediately.
It's relatively rare for a stock to break out and sustain strong momentum on the reaction day itself. Stocks that have been consolidating or forming a solid base over the past few months are more likely to deliver a clean, lasting move.
While entering on the reaction day is the core idea behind this setup, its accuracy tends to be lower in Indian markets. Often, the follow-up action is weak - the stock surges on day one but becomes choppy or declines in the sessions that follow.
Reactions can broadly be classified into the following type:
1. Break & Go
The stock opens with a gap-up, sees a powerful start with exceptionally high volumes, and follows through immediately.
It's relatively rare for a stock to break out and sustain strong momentum on the reaction day itself. Stocks that have been consolidating or forming a solid base over the past few months are more likely to deliver a clean, lasting move.
While entering on the reaction day is the core idea behind this setup, its accuracy tends to be lower in Indian markets. Often, the follow-up action is weak - the stock surges on day one but becomes choppy or declines in the sessions that follow.
Weak follow-up action is commonly seen in this type of EP. The stock may perform well on the reaction day but often turns choppy or declines in the days that follow.
Many times, a stock with flat or unimpressive earnings surprises with a strong upside move, while another with stellar growth ends up falling sharply.
Many times, a stock with flat or unimpressive earnings surprises with a strong upside move, while another with stellar growth ends up falling sharply.


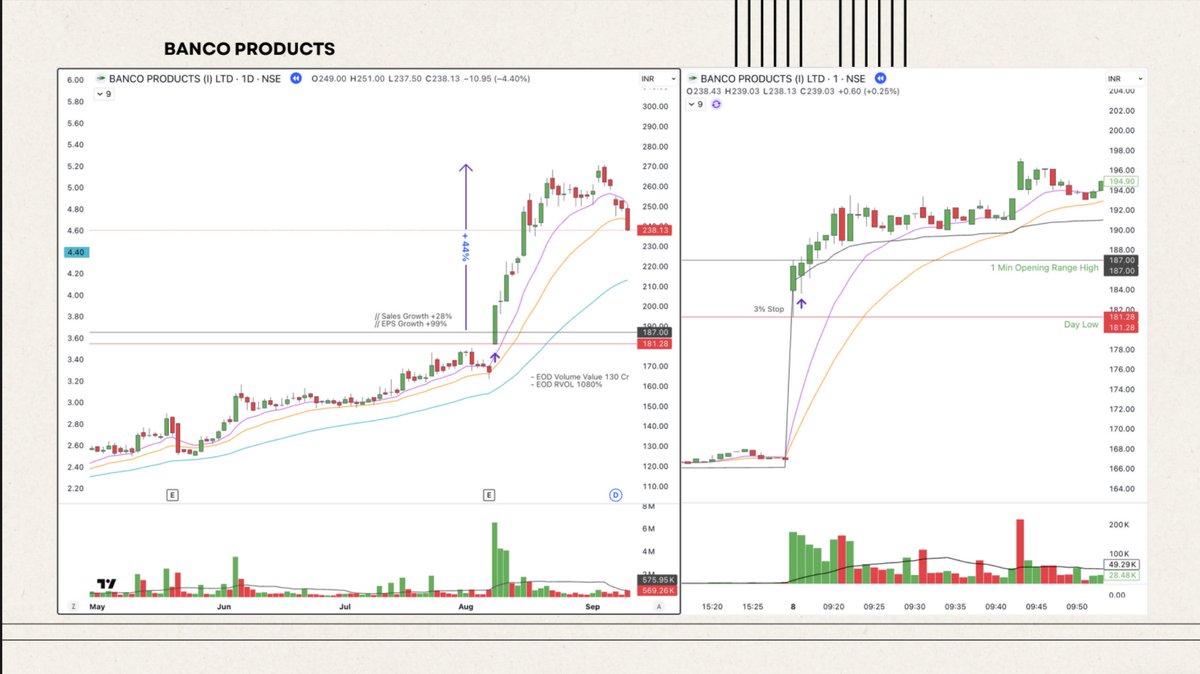
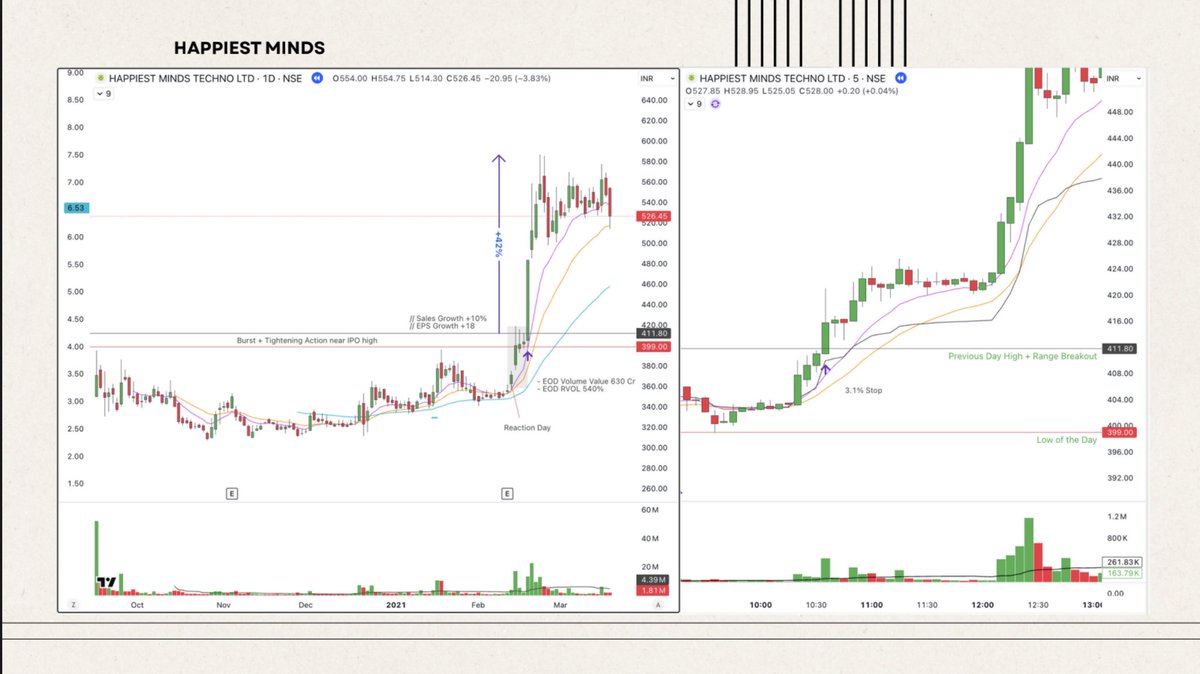
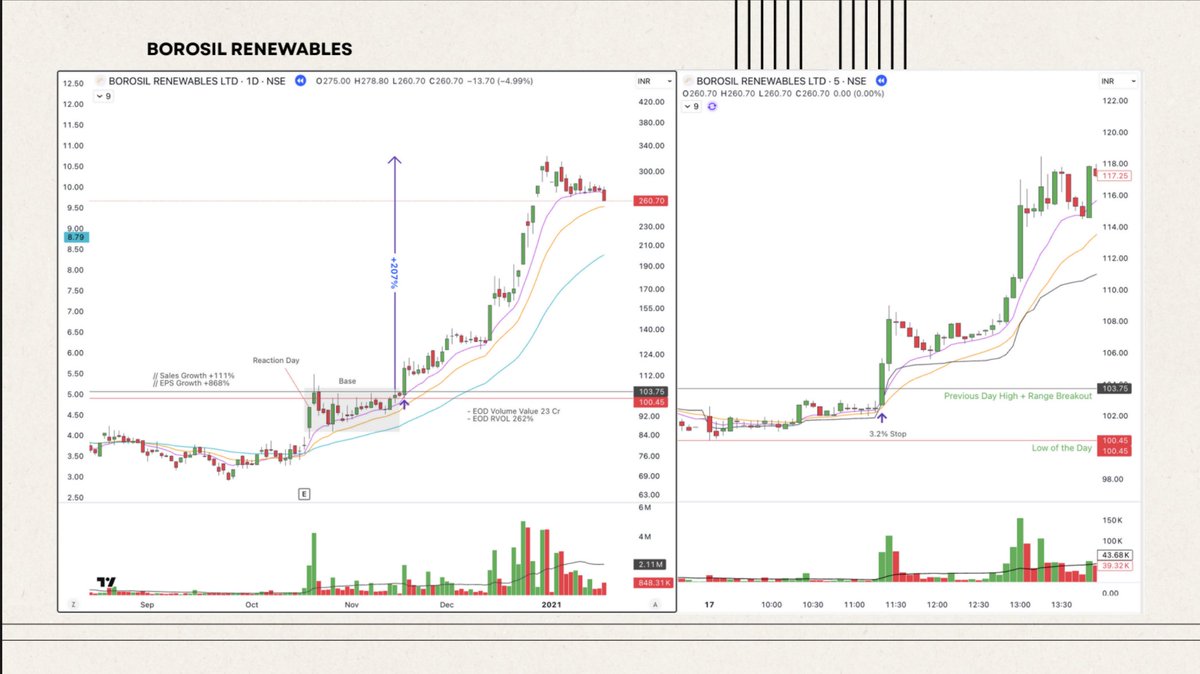
2. Burst & Base (Delayed EP)
The stock surges sharply on the reaction day and then consolidates over the following weeks. If it shoots up immediately, the initial move can often be missed - but the subsequent basing phase attracts fresh demand and sets up a more structured entry.
In some cases, the stock is already in an expansion phase, and the reaction day simply accelerates the move.
More often than not, it forms a flag or tight consolidation, providing a cleaner and more reliable entry.
SIYARAM SILK and NETWEB
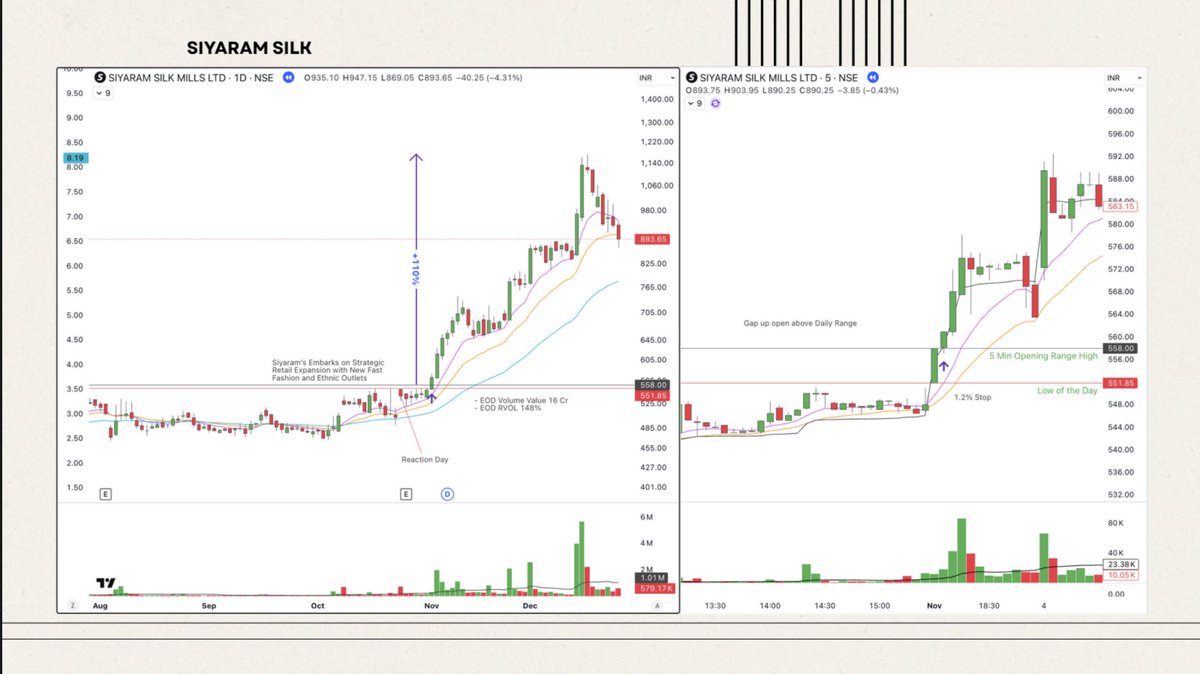
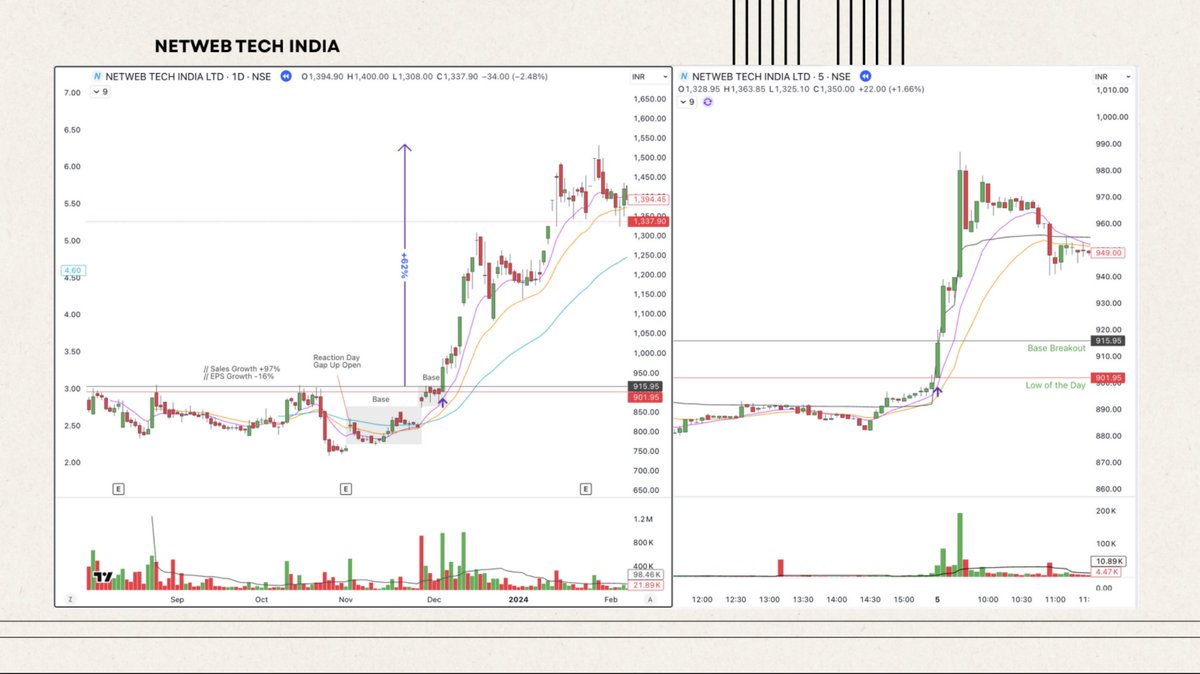
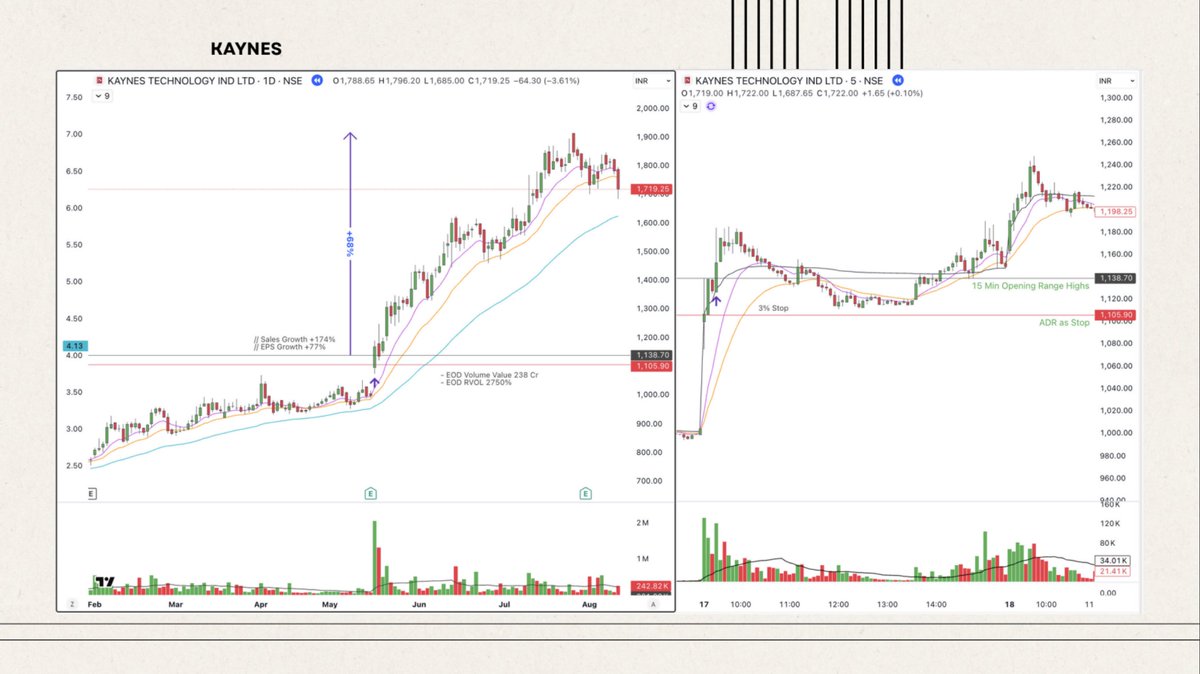
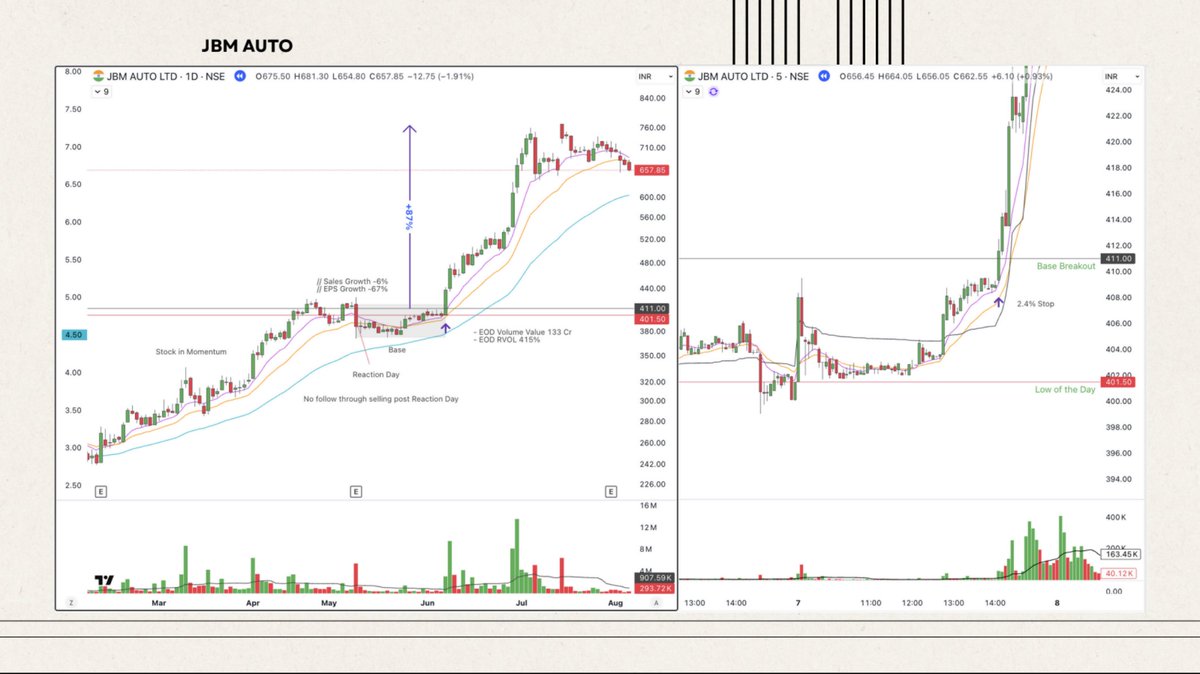
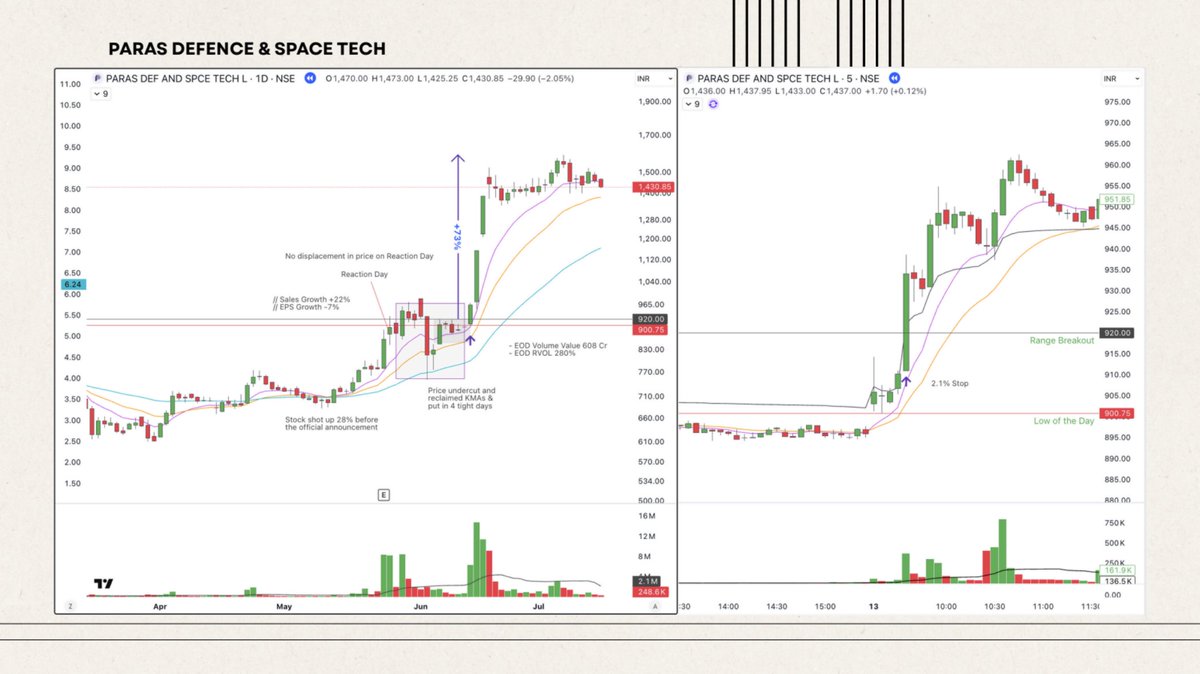
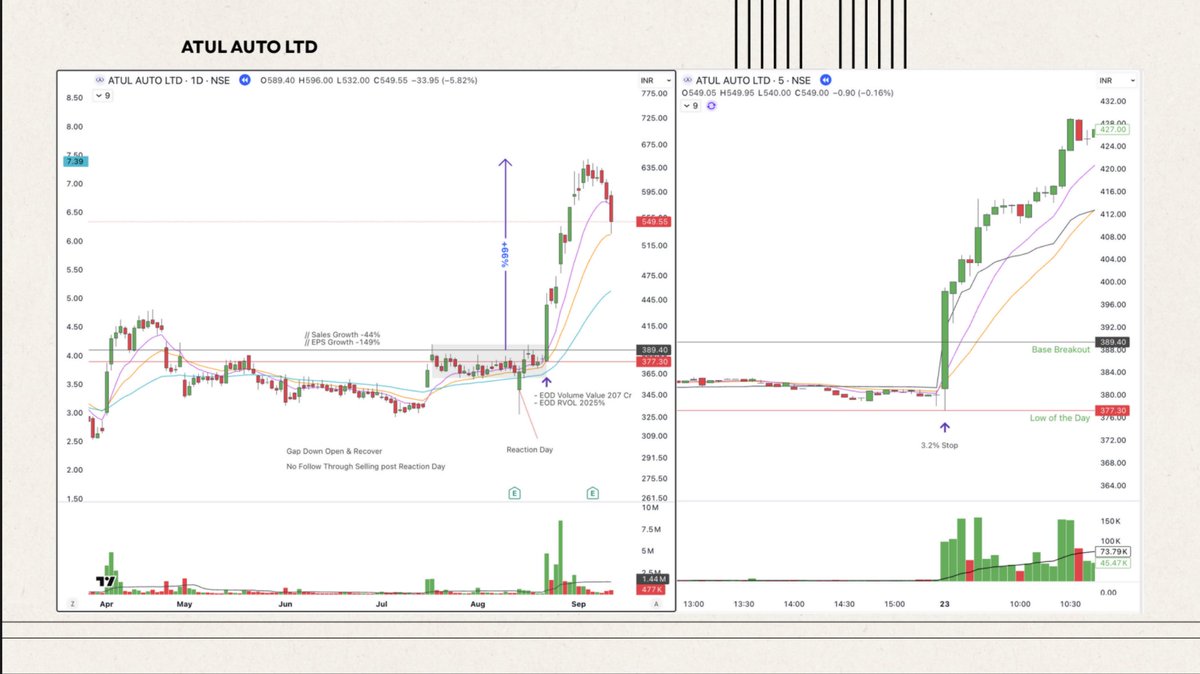
3. Shake & Base (Delayed EP)
On the reaction day, the stock fails to attract fresh buying interest - it may dip or sell off, but without any meaningful follow-through on the downside.
In many cases, the stock might have already priced in the expected earnings by moving up before the announcement, leading to a muted or negative initial reaction. The key opportunity lies in capturing the breakout from the new, reset base that forms afterward.
These subsequent breakout attempts are often stronger and show cleaner follow-through. Having a good understanding of the quality of earnings or the underlying news can significantly improve your conviction in such setups.

Execution Strategy
👉If the stock opens with a gap-up above the contraction zone, consider entering on a break of the 1-min, 3-min, or 15-min high of the day.
👉If there's no gap-up, the high of the contraction zone or base can serve as the breakout pivot.
Stop-Loss Options
👉 Low of the day
👉 Half of the 14-period ATR / a percentage of ADR
👉 VWAP break - suitable for intraday trades.
You can initiate with a tight stop and look to carry the position if the stock closes strong.
All the latest updates about the posts
telegram.me/StockyMind
Follow @StockyMind @DSS_Rajput007 for more exciting content!
Retweet this Post ✉️
x.com/DSS_Rajput007/…
telegram.me/StockyMind
Follow @StockyMind @DSS_Rajput007 for more exciting content!
Retweet this Post ✉️
x.com/DSS_Rajput007/…
• • •
Missing some Tweet in this thread? You can try to
force a refresh


