
HOW TO EVALUATE MOMENTUM🔥🔥
Momentum can make or break your trades... and this thread will teach you how to analyze momentum
🧵👇
Momentum can make or break your trades... and this thread will teach you how to analyze momentum
🧵👇

If you find these threads helpful... please LIKE AND SHARE THE TOP POST🤝
I enjoy posting them, but you guys have to make it worth my time
I enjoy posting them, but you guys have to make it worth my time
Basics
1) Large candles should have large volume
2) Sustained moves should have sustained volume
3) Decreasing volume on a move is a red flag
4) Large volume paired with small candles is a red flag
1) Large candles should have large volume
2) Sustained moves should have sustained volume
3) Decreasing volume on a move is a red flag
4) Large volume paired with small candles is a red flag
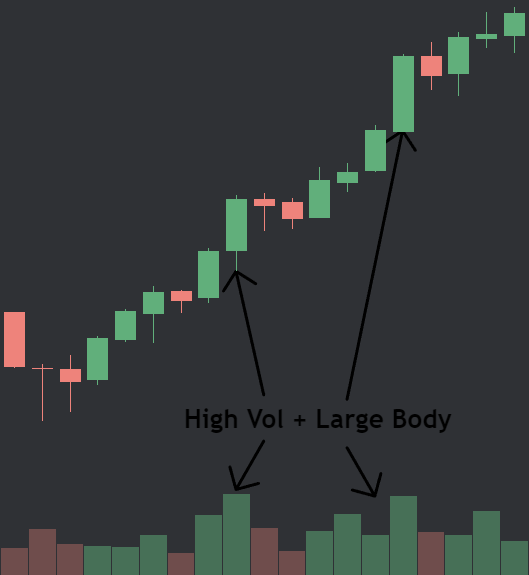
Large Candles + Large Volume
This is the simplest part of momentum evaluation
When momentum is strong, large candles will have large volume. This shows us that buyers have lots of buying power, and they are having success when they deploy their volume
This is the simplest part of momentum evaluation
When momentum is strong, large candles will have large volume. This shows us that buyers have lots of buying power, and they are having success when they deploy their volume
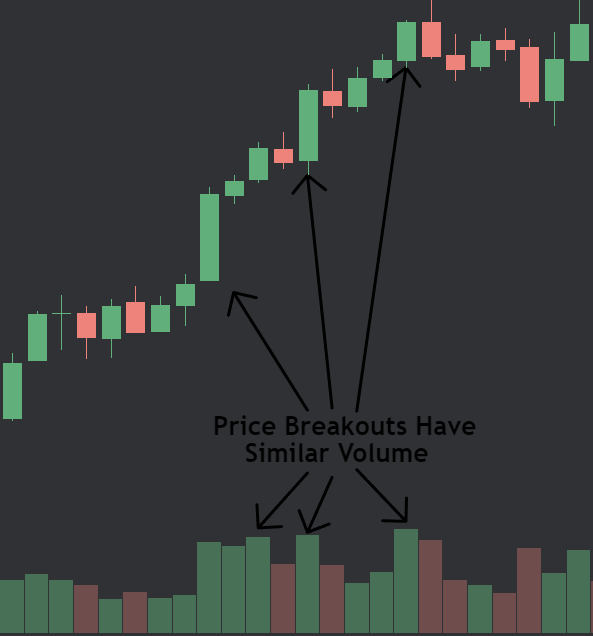
Sustained Moves + Sustained Volume
Making sure that breakouts/momentum moves have sustained volume ensures buyers still have buying power
When momentum is strong, buyers should have sufficient buying power to continue the move using similar volume bars
Making sure that breakouts/momentum moves have sustained volume ensures buyers still have buying power
When momentum is strong, buyers should have sufficient buying power to continue the move using similar volume bars
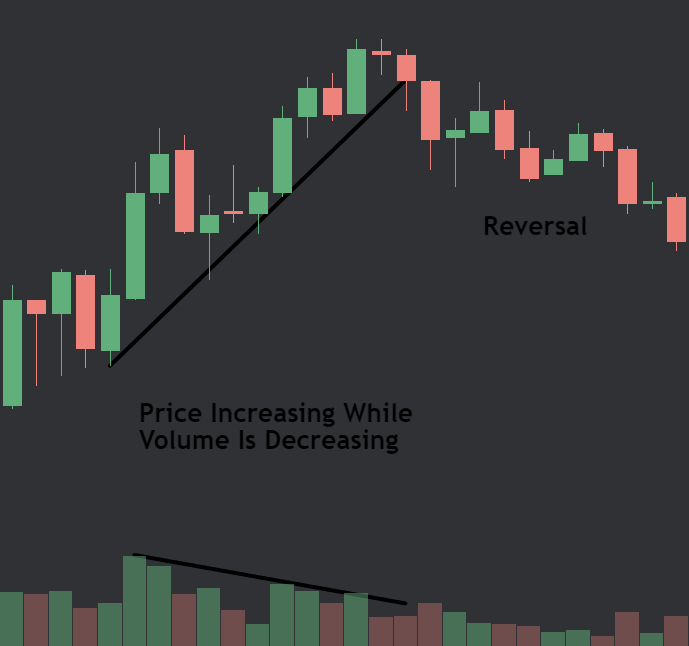
Decreasing Volume Move Is A Red Flag
Decreasing volume shows that buyers do not have the buying power that they previously had
When momentum is weakening, volume will decline which shows a lack of buying power. This is often followed by reversal
Decreasing volume shows that buyers do not have the buying power that they previously had
When momentum is weakening, volume will decline which shows a lack of buying power. This is often followed by reversal
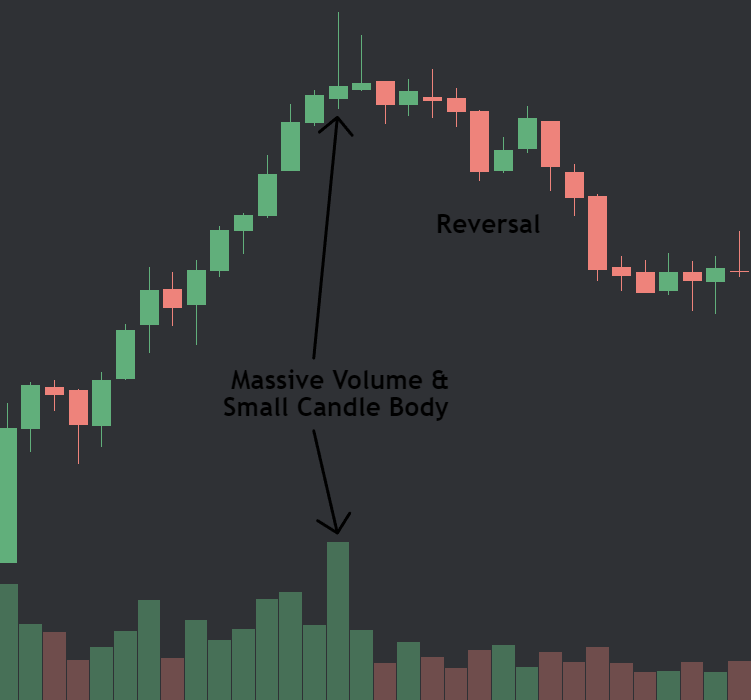
Large Volume Paired With A Small Candle Is A Red Flag
Large volume and a small candle shows indecision, which is not a sign of strong momentum
When momentum is weakening, sellers will step in and deploy their volume in order to potentially reverse the price
Large volume and a small candle shows indecision, which is not a sign of strong momentum
When momentum is weakening, sellers will step in and deploy their volume in order to potentially reverse the price
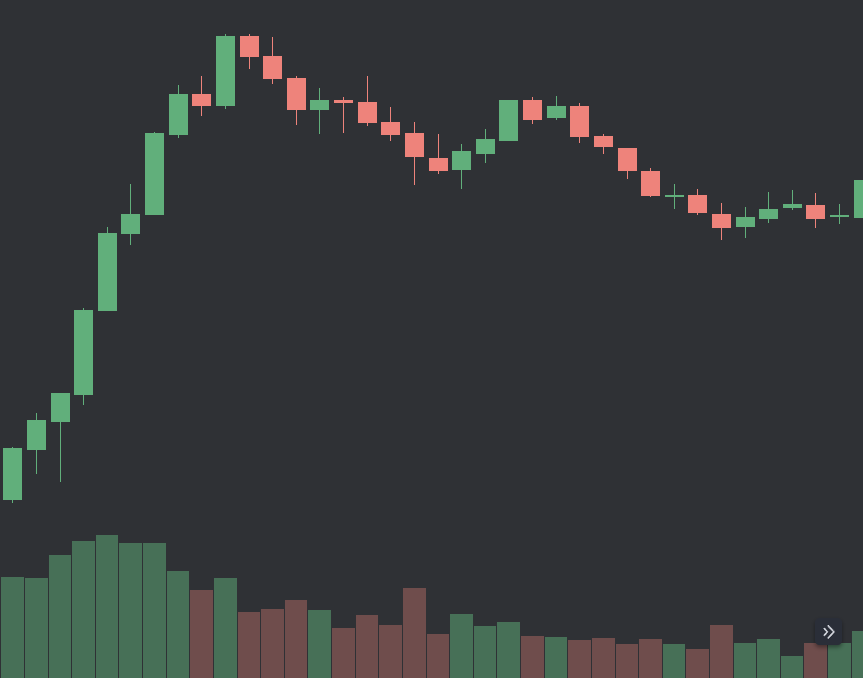
Example 1
1) Increasing volume paired with the initial momentum
2) Volume starts to decline while price continues to rally
3) Shortly after the decline, price reverses and never revisits highs
1) Increasing volume paired with the initial momentum
2) Volume starts to decline while price continues to rally
3) Shortly after the decline, price reverses and never revisits highs
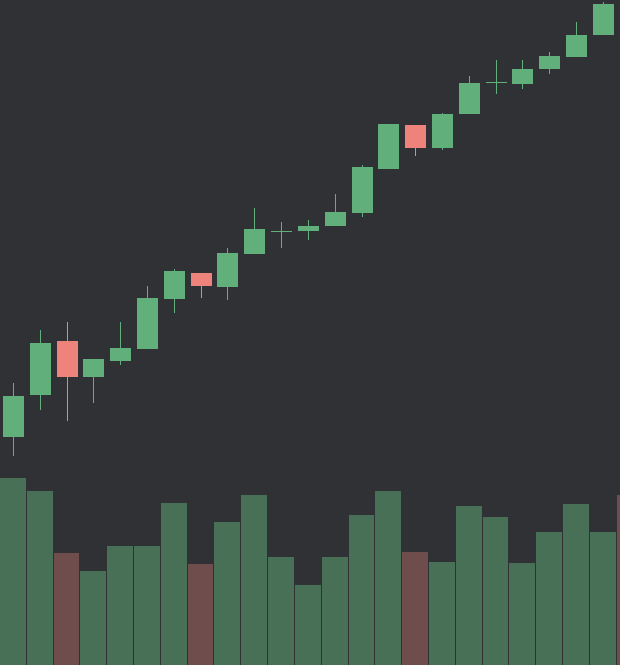
Example 2
1) Volume surges are paired with lower volume red candles
2) Breakout candles pair higher volume with larger candles
3) The volume is consistent and sustained
1) Volume surges are paired with lower volume red candles
2) Breakout candles pair higher volume with larger candles
3) The volume is consistent and sustained
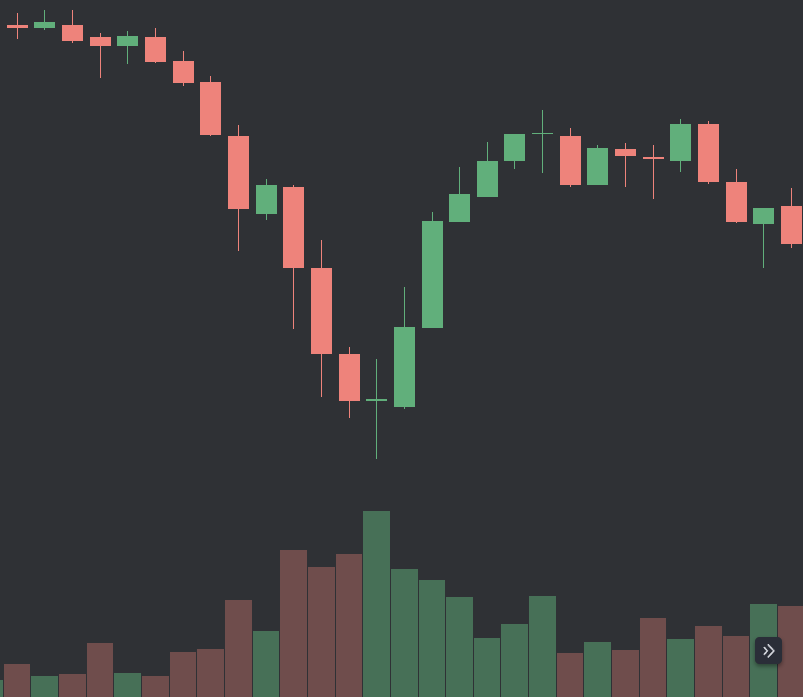
Example 3
1) Sellers have strong momentum
2) Buyers are able to stop the downtrend and create a high volume indecision candle
3) Price reverses
1) Sellers have strong momentum
2) Buyers are able to stop the downtrend and create a high volume indecision candle
3) Price reverses
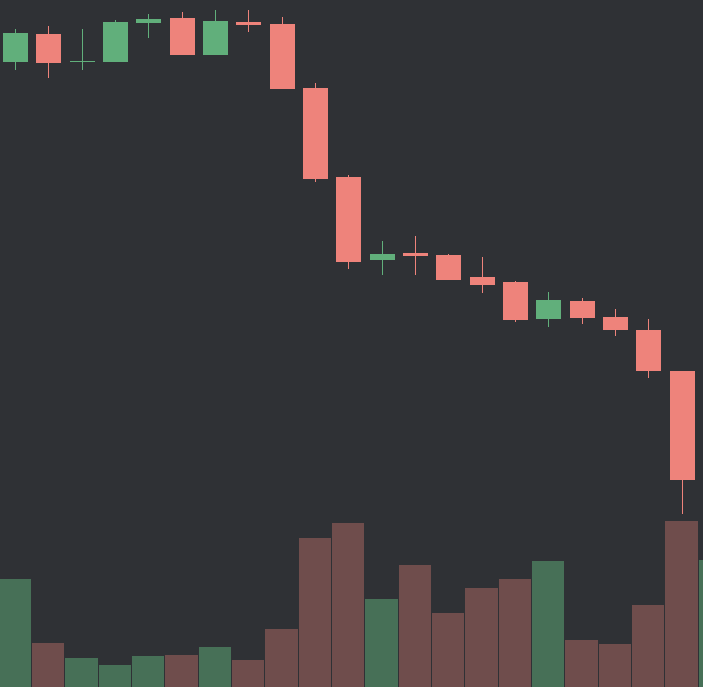
Example 4
1) Sellers have strong momentum with increasing volume large candles
2) Price pauses with lower volume
3) Momentum continues with increasing volume and large candles
1) Sellers have strong momentum with increasing volume large candles
2) Price pauses with lower volume
3) Momentum continues with increasing volume and large candles
4 basic ways to evaluate momentum✅
4 examples✅
Volume Price Analysis✅
4 examples✅
Volume Price Analysis✅
I've been having a lot of success Swing Trading Options in 2025🤑
I've been posting the options trade ideas/setups exclusively for my Subs here on X. It's only 33 cents a day. Well worth it
If you'd like to check it out, go to my profile & click the purple button
I've been posting the options trade ideas/setups exclusively for my Subs here on X. It's only 33 cents a day. Well worth it
If you'd like to check it out, go to my profile & click the purple button

❤️ THIS POST IF YOU MADE IT THROUGH THE ENTIRE THREAD
I wanna see who all the real homies are
Great job reading the entire thing & educating yourself. Keep it up
I wanna see who all the real homies are
Great job reading the entire thing & educating yourself. Keep it up
• • •
Missing some Tweet in this thread? You can try to
force a refresh


