𝗛𝗢𝗪 𝗧𝗢 𝗦𝗣𝗢𝗧 𝗜𝗡𝗗𝗨𝗖𝗘𝗠𝗘𝗡𝗧 𝗕𝗘𝗙𝗢𝗥𝗘 𝗜𝗧 𝗦𝗧𝗢𝗣𝗦 𝗬𝗢𝗨 𝗢𝗨𝗧
Ever wondered why your SL gets hit and price runs straight to TP?
In this thread, I'll show you the simplest way to identify INDUCEMENT and how it can increase your win rate as a trader🧵⤵️
Ever wondered why your SL gets hit and price runs straight to TP?
In this thread, I'll show you the simplest way to identify INDUCEMENT and how it can increase your win rate as a trader🧵⤵️
NOTE:
This thread might be a bit lengthy because I’m breaking everything down clearly so you fully get it.
Please read it all the way through!
But before we jump in
Kindly repost the first tweet above so more traders can benefit from it too.
This thread might be a bit lengthy because I’m breaking everything down clearly so you fully get it.
Please read it all the way through!
But before we jump in
Kindly repost the first tweet above so more traders can benefit from it too.
Done that? You’re amazing, thank you! 💙
Alright, let’s get into it
Alright, let’s get into it

The most profitable traders deeply understand Inducement & how it functions
They know that spotting inducement near a Key level or POI (Point Of Interest) can significantly increase the chances of that POI playing out
But what's exactly this Inducement they keep talking about?
They know that spotting inducement near a Key level or POI (Point Of Interest) can significantly increase the chances of that POI playing out
But what's exactly this Inducement they keep talking about?

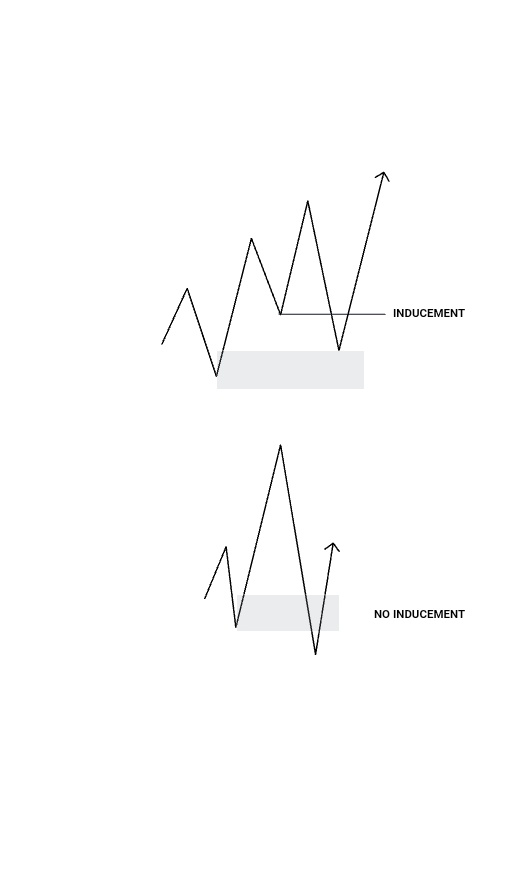
INDUCEMENT is a trap.
It’s the liquidity the market creates to lure traders into the market early, hereby stopping them out just before a real move begins.
It’s the liquidity the market creates to lure traders into the market early, hereby stopping them out just before a real move begins.
It's essentially an internal range liquidity, located near a point of interest (POI)
A POI can be an order block, fair value gap, breaker block e.t.c
Inducement increases the probability of your setups playing out.
It can appear in many different forms, such as:
A POI can be an order block, fair value gap, breaker block e.t.c
Inducement increases the probability of your setups playing out.
It can appear in many different forms, such as:
- A demand zone that forms just before the actual, more significant demand zone.
- A supply zone that appears ahead of the true, higher-probability supply zone.
- The initial pullback that occurs right after a break of structure.
- A supply zone that appears ahead of the true, higher-probability supply zone.
- The initial pullback that occurs right after a break of structure.
It can also be in form of;
➣ Trendline liquidity
➣ Equal highs or lows
➣ Previous swing highs or lows e.t.c
Check out the examples below 👇
➣ Trendline liquidity
➣ Equal highs or lows
➣ Previous swing highs or lows e.t.c
Check out the examples below 👇
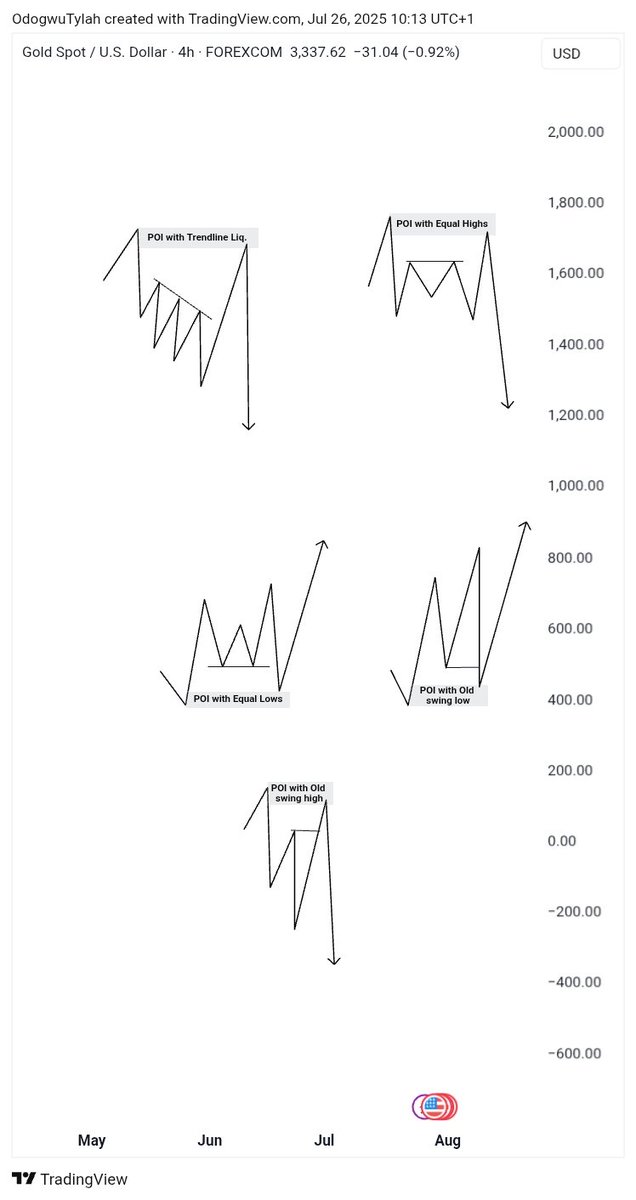
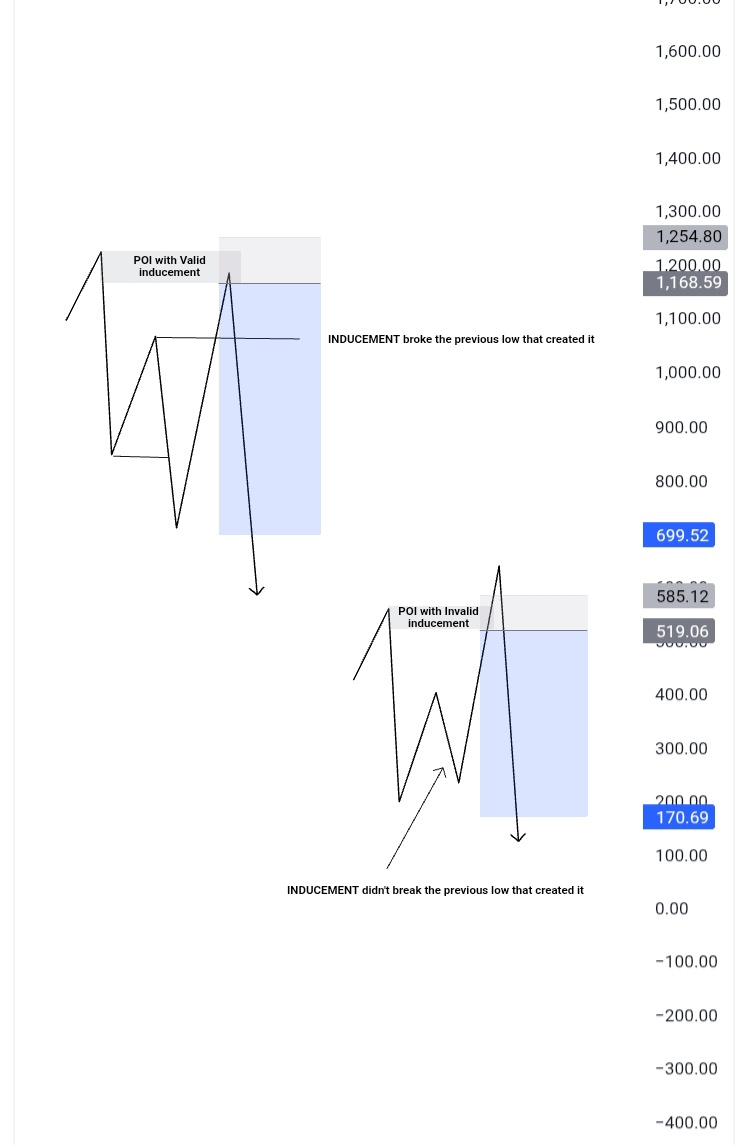
Always ensure that any POI or zone you're planning to trade from has an inducement just before it, the market typically needs to clear that liquidity to drive the actual move.
If a POI doesn't have inducement, consider it a warning sign. It’s likely invalid and best avoided.
If a POI doesn't have inducement, consider it a warning sign. It’s likely invalid and best avoided.
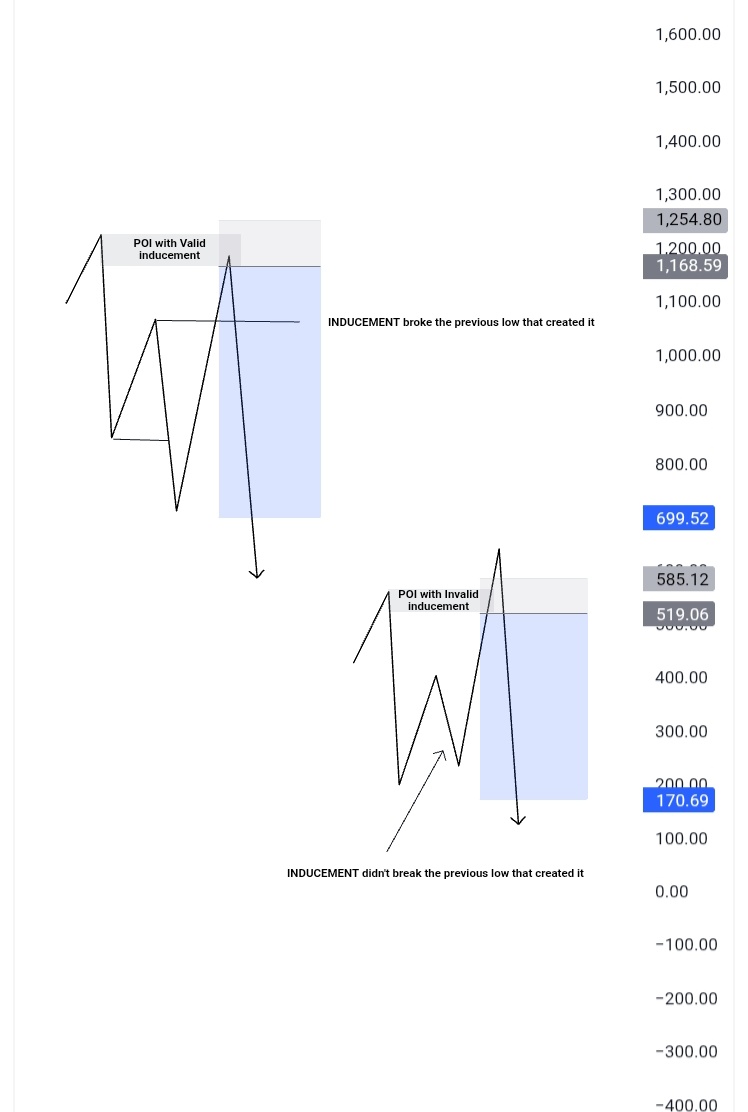
For an inducement to be valid, it must break the previous high or low that formed it and be located near a point of interest.
If there’s no POI nearby, it’s simply regular buy-side or sell-side liquidity but when a POI is close, that’s when it becomes an inducement.
If there’s no POI nearby, it’s simply regular buy-side or sell-side liquidity but when a POI is close, that’s when it becomes an inducement.
Here are some live chart examples from the trades I took earlier this month on
$AUDUSD
$GBPJPY
$USDJPY
$EURNZD
Let's dive in ⤵️
$AUDUSD
$GBPJPY
$USDJPY
$EURNZD
Let's dive in ⤵️
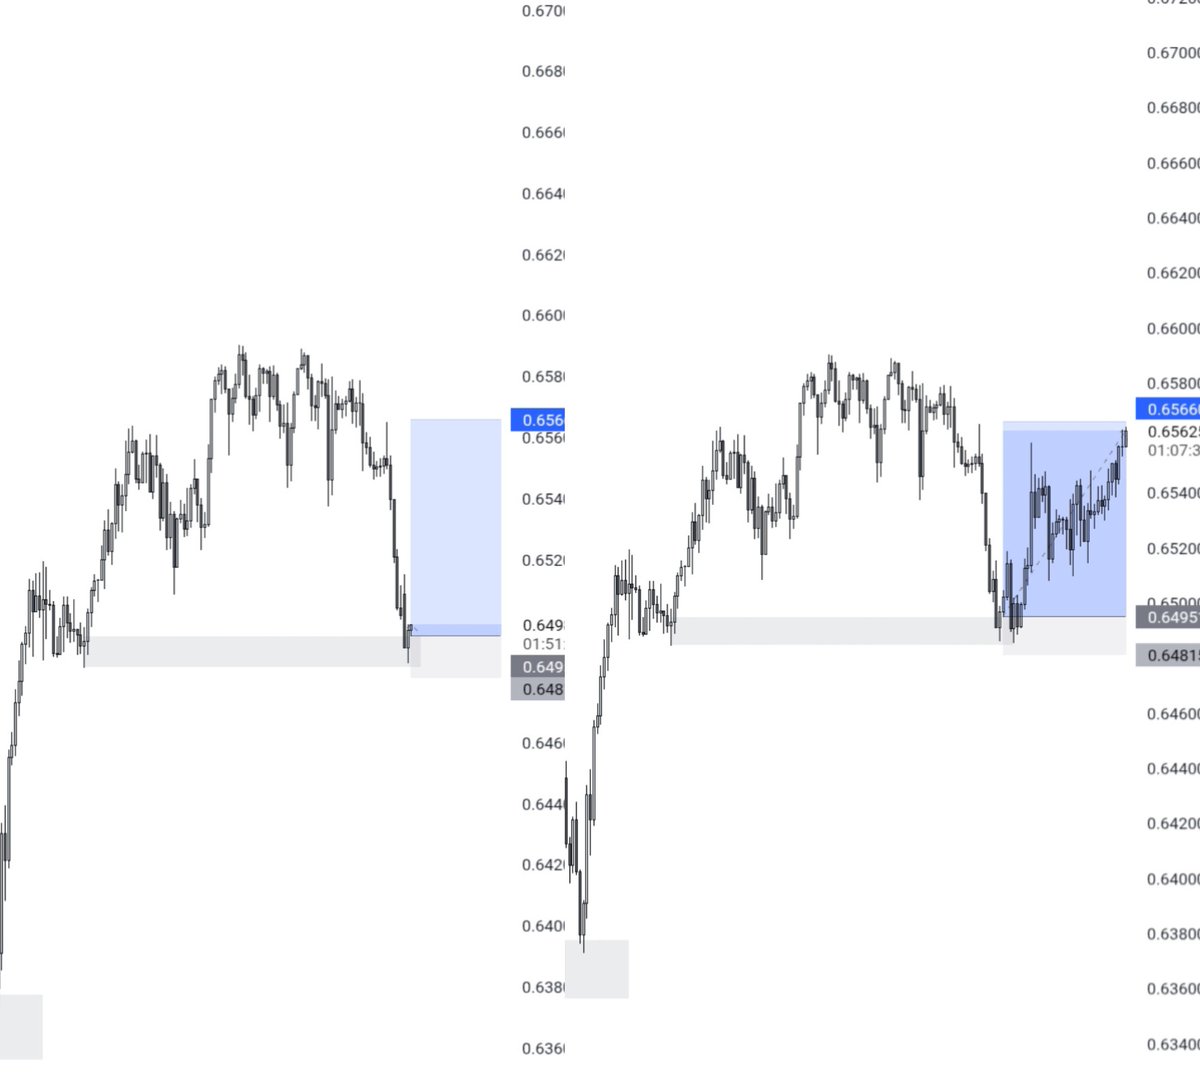
A live chart example on $AUDUSD
Notice how the old swing low was taken out before the actual move happened ⤵️
Notice how the old swing low was taken out before the actual move happened ⤵️


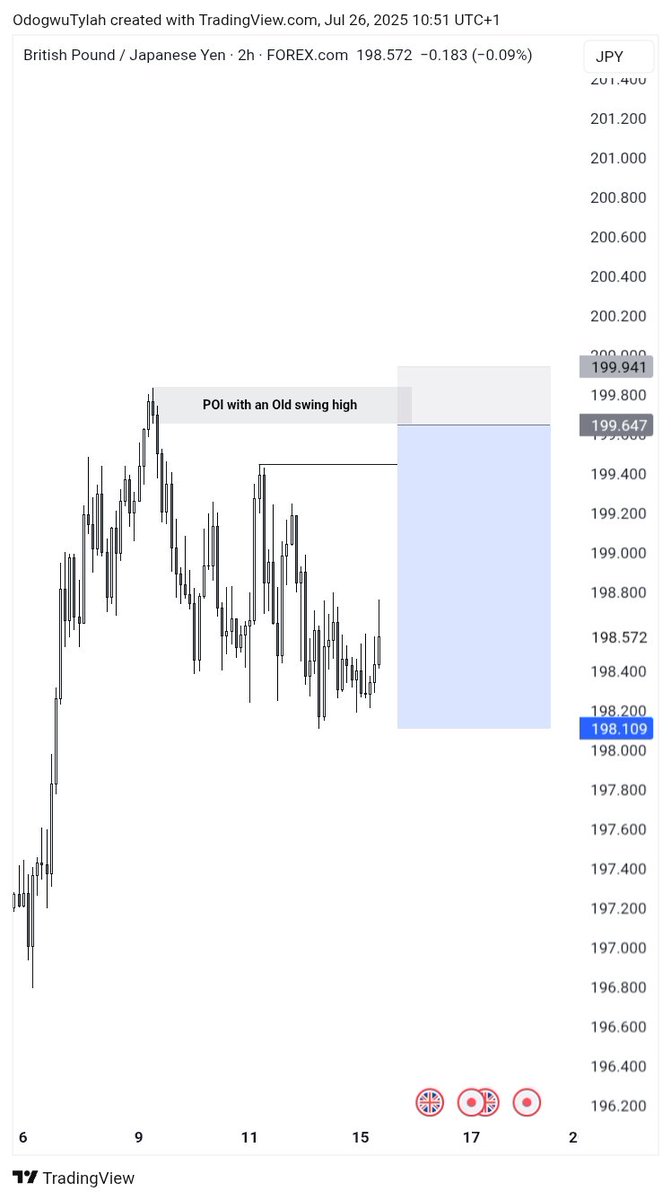
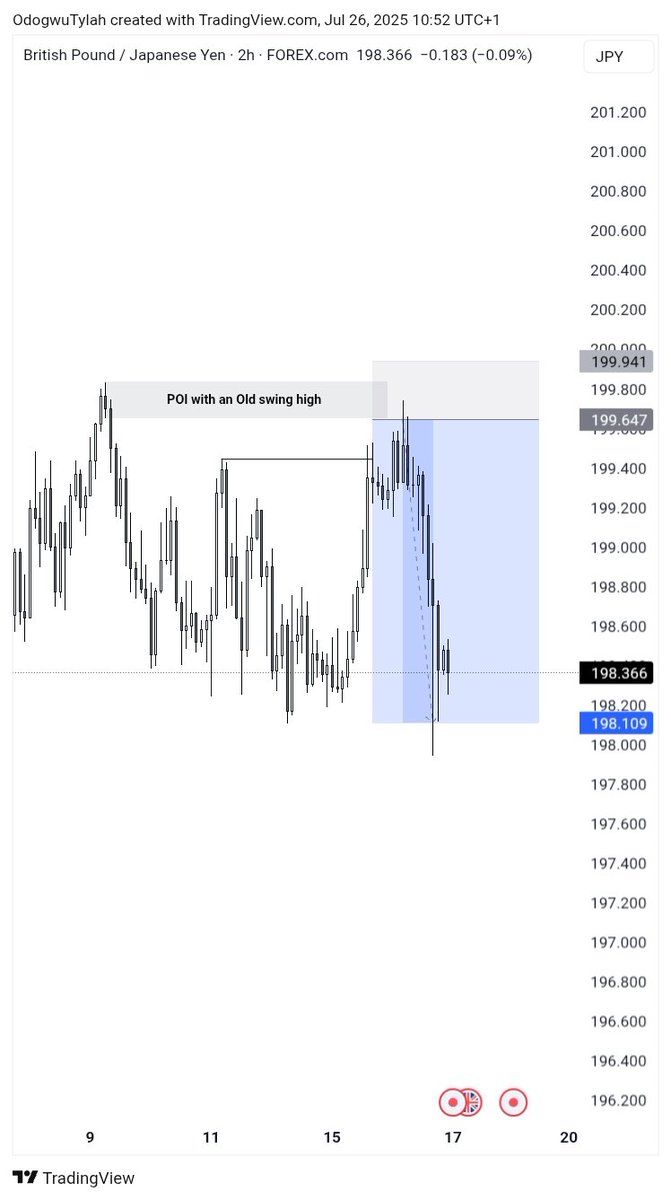
A live chart example on $GBPJPY
Many sellers selling from the old swing high before the actual POI were taken out before the actual move happened ⤵️
Many sellers selling from the old swing high before the actual POI were taken out before the actual move happened ⤵️
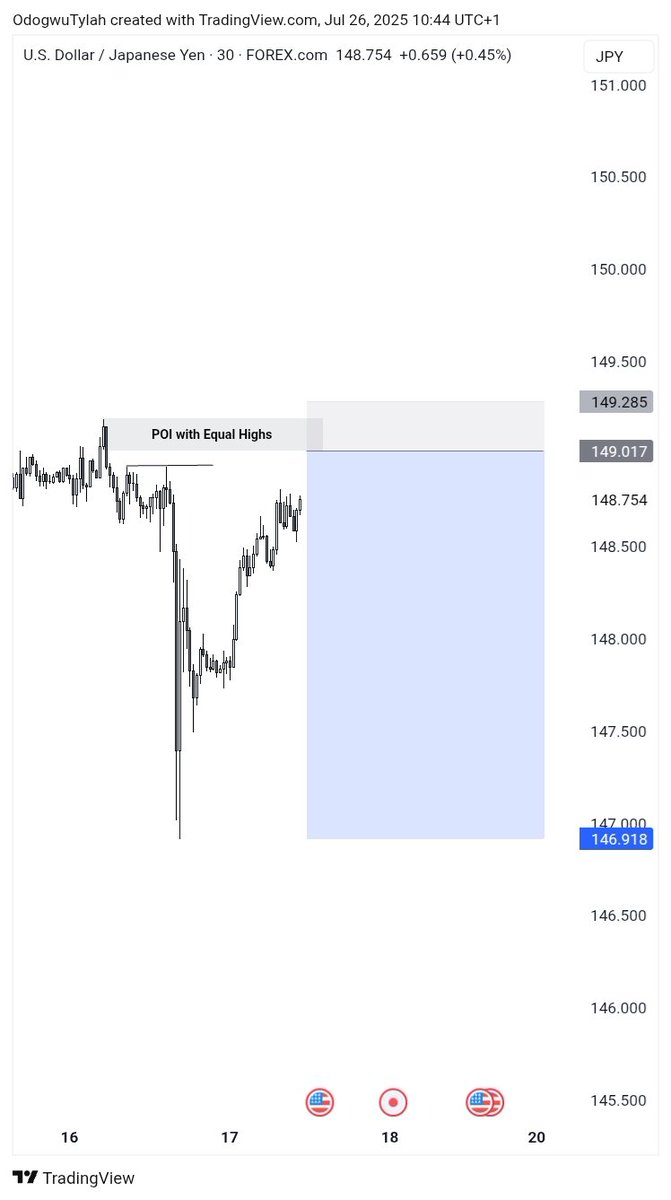
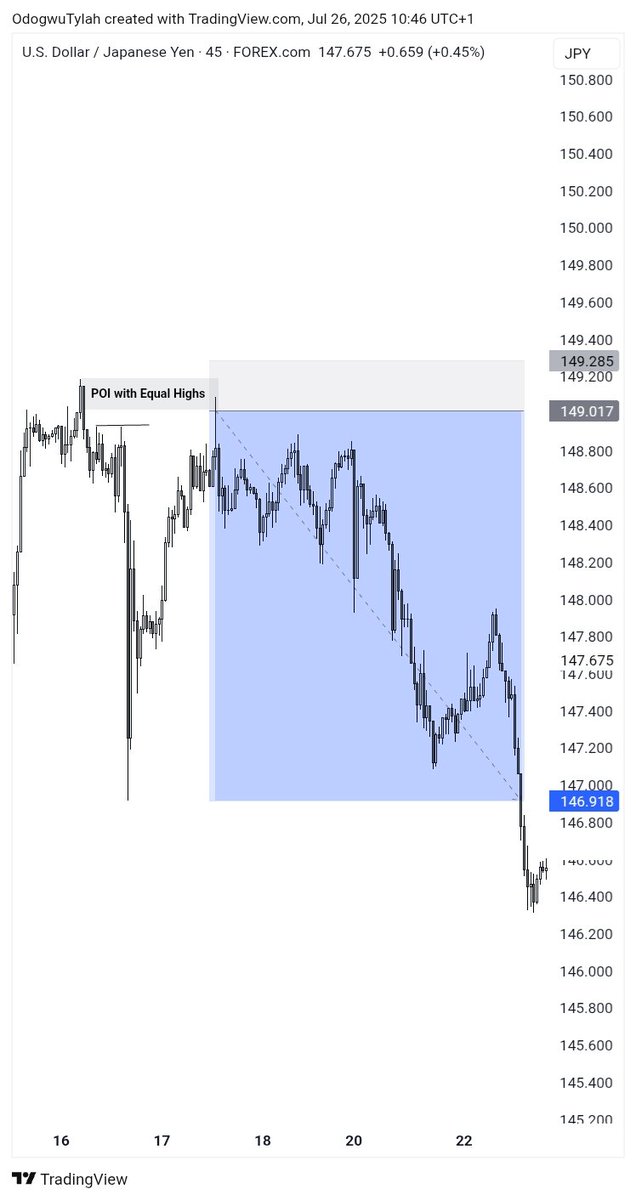
A live chart example on $USDJPY
Notice how that equal highs before the actual supply zone was swept aggressively before the main move ⤵️
Notice how that equal highs before the actual supply zone was swept aggressively before the main move ⤵️
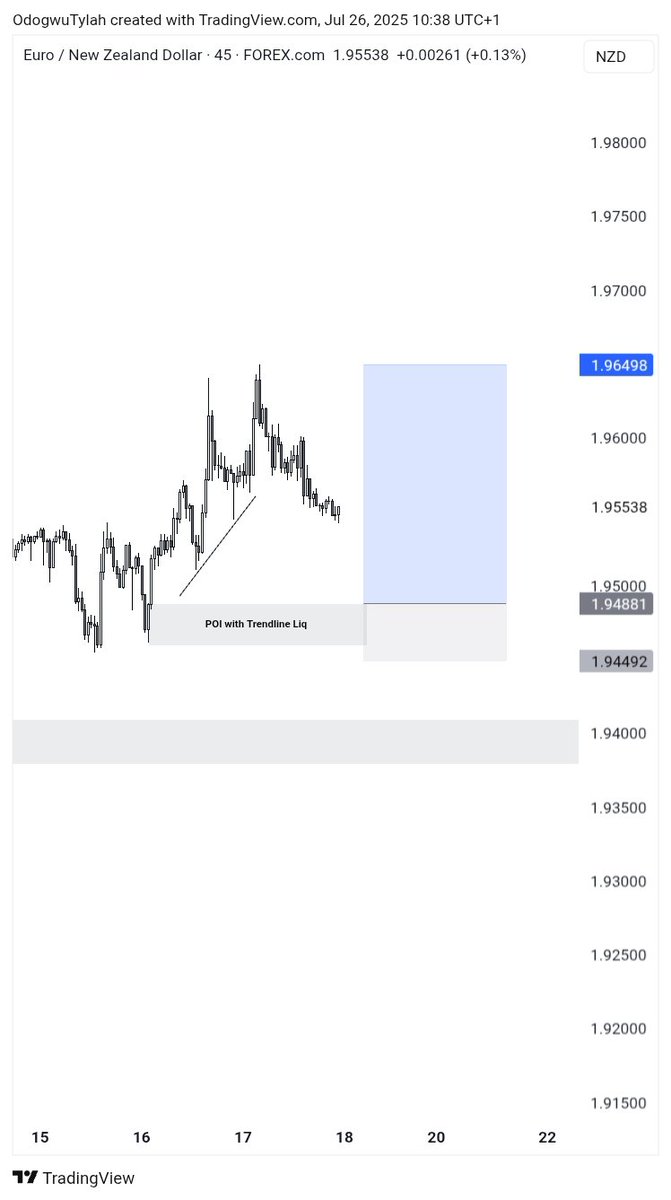
A live chart example on $EURNZD
A Trendline liquidity was formed before the high probability demand, many Trendline support and resistance traders would be taken out in this particular scenario ⤵️
A Trendline liquidity was formed before the high probability demand, many Trendline support and resistance traders would be taken out in this particular scenario ⤵️

𝗤𝗨𝗜𝗖𝗞 𝗥𝗘𝗖𝗔𝗣 𝗢𝗙 𝗠𝗬 𝗜𝗡𝗗𝗨𝗖𝗘𝗠𝗘𝗡𝗧 𝗧𝗛𝗥𝗘𝗔𝗗
- A POI needs nearby inducement/liquidity to be considered valid.
- A strong inducement should break structure to support a high-probability setup.
- No inducement near your POI? That’s a major red flag 🚩
- A POI needs nearby inducement/liquidity to be considered valid.
- A strong inducement should break structure to support a high-probability setup.
- No inducement near your POI? That’s a major red flag 🚩
VERY IMPORTANT: When choosing any POI, always prioritize market structure, it comes before liquidity or anything else
Focus on trading from POIs that have clear inducements aligned with the structure, and you'll see a noticeable boost in your win rate.
That's a wrap for now 💙
Focus on trading from POIs that have clear inducements aligned with the structure, and you'll see a noticeable boost in your win rate.
That's a wrap for now 💙
Thanks for reading 🙏🏽💙
To learn more about how to pick high probability POIs, visit this thread 👇
To learn more about how to pick high probability POIs, visit this thread 👇
https://x.com/Tylah_Ikechukwu/status/1946668282930516033?t=SykUQTBPoYcleAeam6WfNA&s=19
If you found this thread valuable
❤️ Like and Comment
🔁 Repost to help other struggling traders
📍Follow me @Tylah_Ikechukwu for more educational threads & trading gems
Also join me on WhatsApp, use the link in my Bio, send a DM and I'll save up immediately.
❤️ Like and Comment
🔁 Repost to help other struggling traders
📍Follow me @Tylah_Ikechukwu for more educational threads & trading gems
Also join me on WhatsApp, use the link in my Bio, send a DM and I'll save up immediately.
For more educative threads like this
Follow @Techriztm @KelvinCassie3 @TraderRozay @E_TRADES01 @neehyeehwah @Starr_gael @Kelvintalent_ @Onlyonecurrency @Fznation01 @TpwithPolarity @CyrusOlogun @AartTheTrader @midrizzy1 @Joshify001
#forextrading #forex #forextip #tradingstrategy
Follow @Techriztm @KelvinCassie3 @TraderRozay @E_TRADES01 @neehyeehwah @Starr_gael @Kelvintalent_ @Onlyonecurrency @Fznation01 @TpwithPolarity @CyrusOlogun @AartTheTrader @midrizzy1 @Joshify001
#forextrading #forex #forextip #tradingstrategy
• • •
Missing some Tweet in this thread? You can try to
force a refresh