
I’ve been working with an IVF startup, @herasight, that has already screened hundreds of embryos. Today we come out of stealth with a paper showing that our predictors for 17 diseases — validated within-family — beat the competition, with improved performance in non-Europeans🧵 

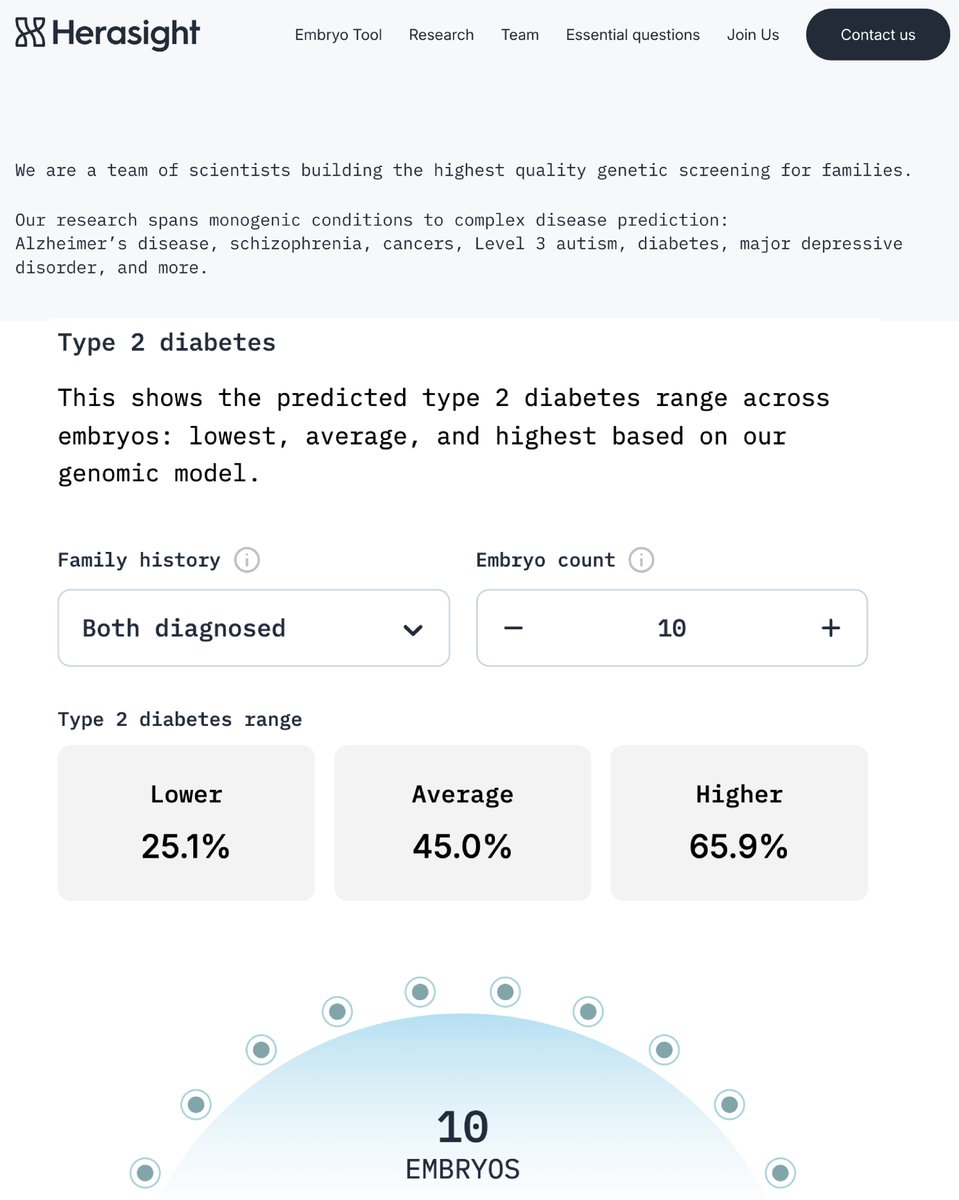
Check out our website where you can play with our widget and download our white paper: herasight.com
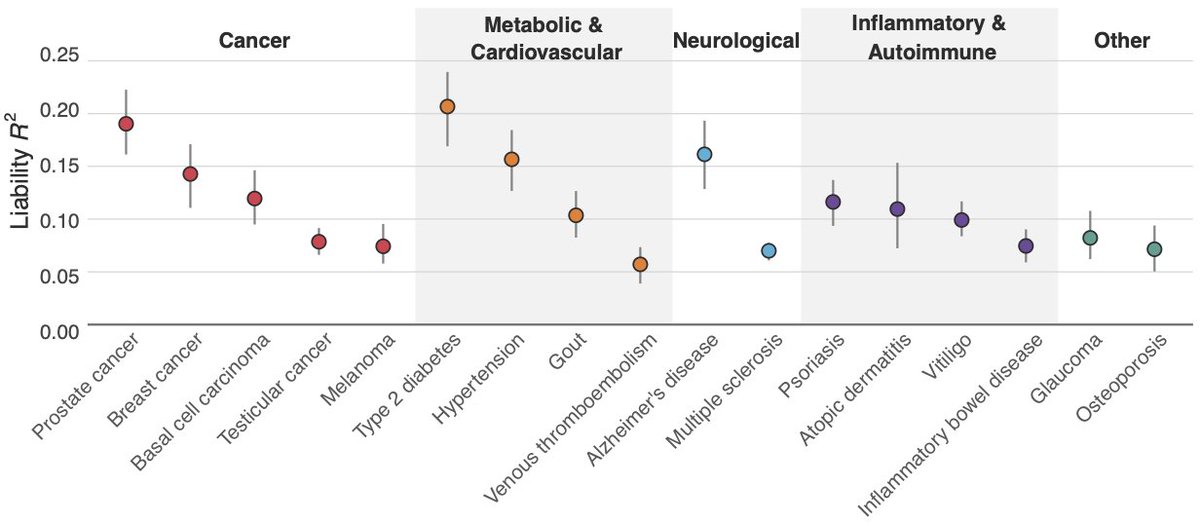
In our paper, we detail our polygenic scores (PGS) for 17 diseases using a custom meta-analysis. We used state-of-the-art methods to create PGSs based on 7.3M SNPs. Our most predictive PGSs explained ~20% of the variance in liability for prostate cancer and type-II diabetes.
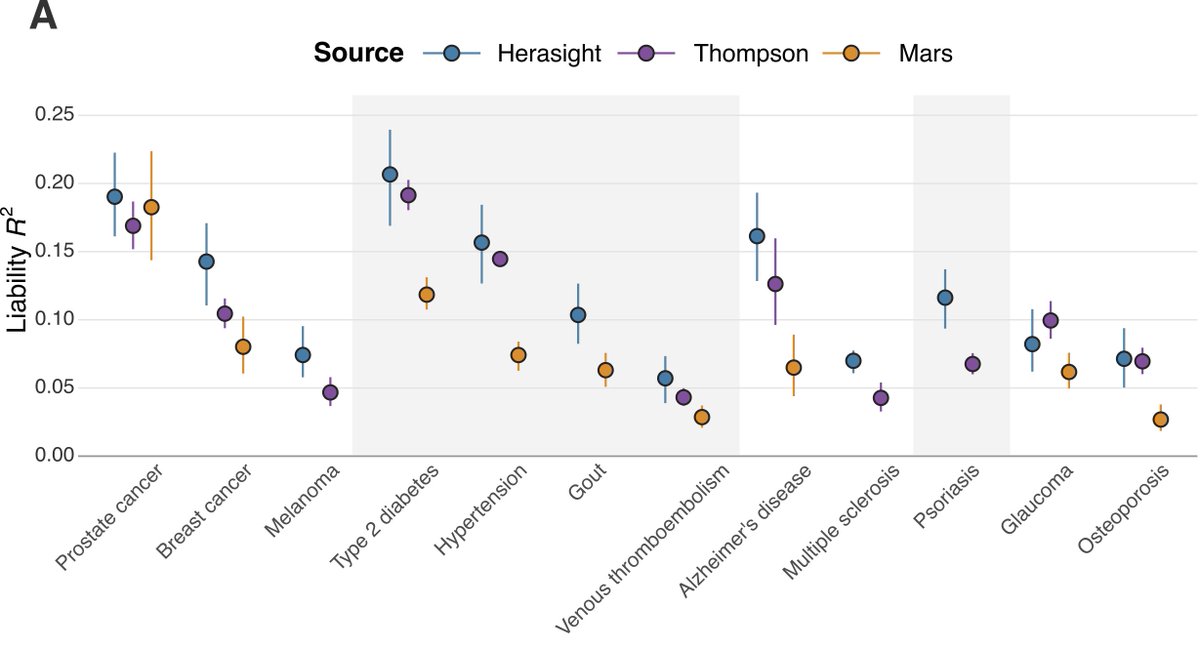
We compared our PGSs to the best published academic efforts. Our scores explained 28% and 87% more liability variance on average than those of Thompson et al. and Mars et al., respectively, with substantial improvements for breast cancer, melanoma, coronary artery disease, gout, and multiple sclerosis.
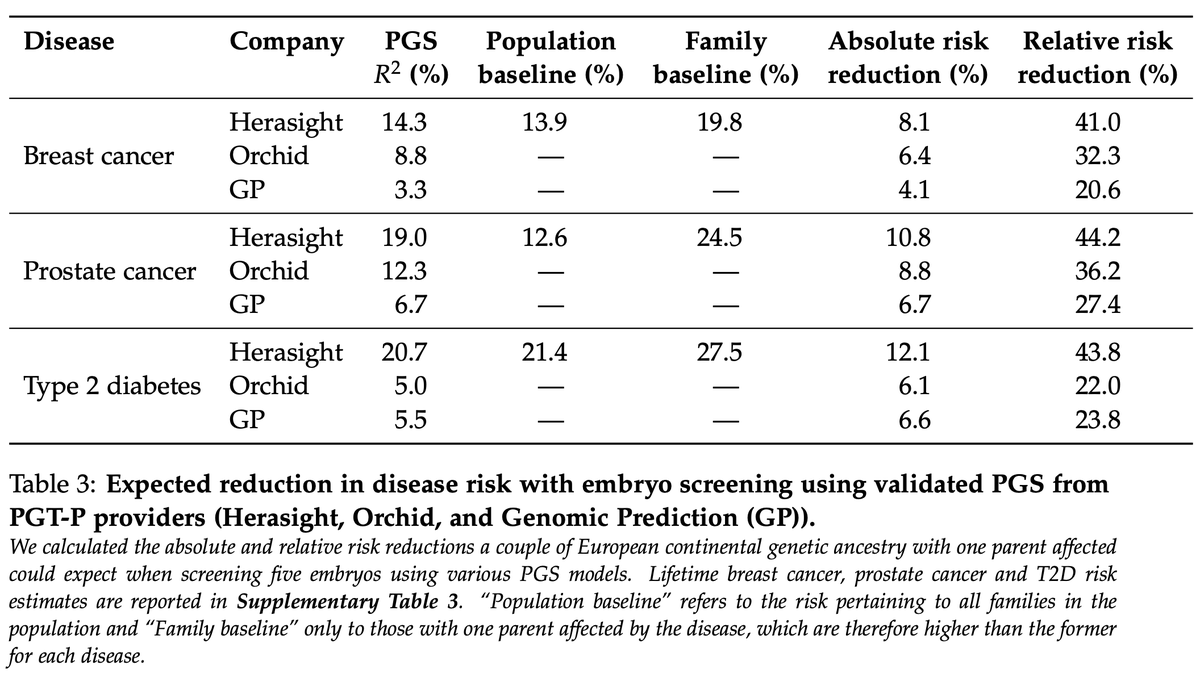
We compared our scores to published data from embryo screening companies Orchid and Genomic Prediction. Our scores explained 122% (Orchid) and 193% (GP) more liability variance, translating to greater absolute and relative risk reductions (table below).
For example, for a European ancestry couple with one parent affected by type-II diabetes, our PGS would give an expected absolute risk reduction of 12%, double the 6% expected from Orchid and GP.
We found a relative risk calculator on GP's website (lifeview.com/ehs) that appears to give different numbers to those in their published validation paper. On closer inspection, they state these results are from "...selecting among unrelated individuals of European descent", which does not account for the reduced genetic variation within-family. Thus, these numbers give inflated estimates of what could be achieved through embryo screening using their scores.
Orchid provided validations for only 6 out of the 12 traits offered, and we were unable to determine appropriate confidence intervals for their reported performance metrics.
If the prediction ability of a PGS is smaller within-family — as I’ve shown for some traits in my own research — it won’t work as well for embryo screening. We therefore validated our PGS within-family, with only osteoporosis showing a significant reduction of its effect.
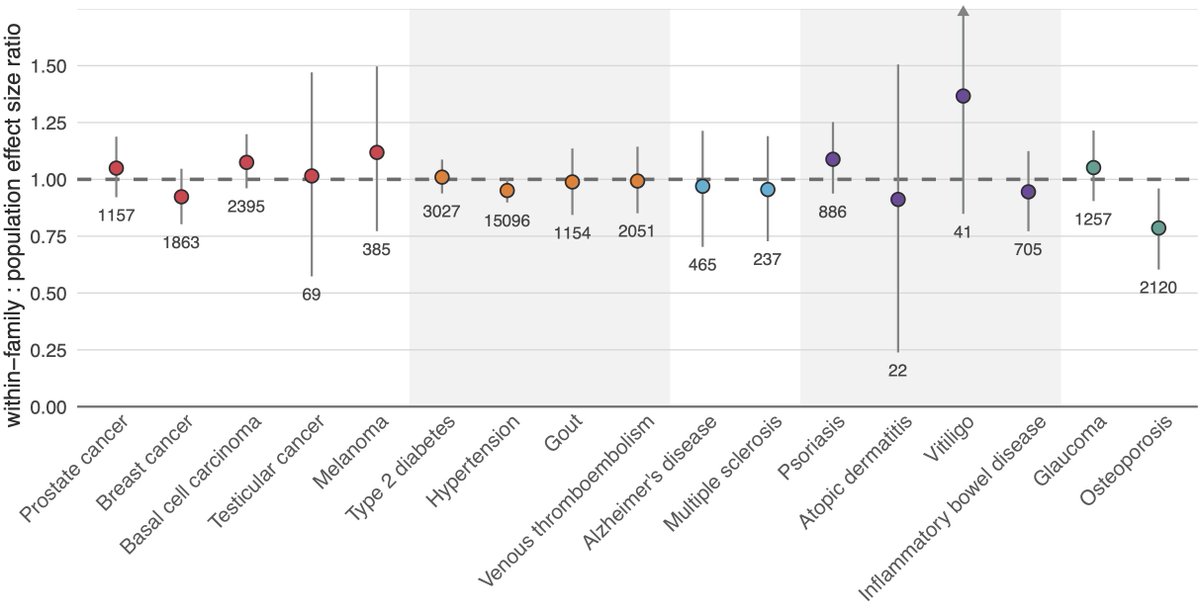
PGS being offered for embryo screening should undergo within-family validation. While our analysis shows that most disease PGS predict about as well within-family as in the population, osteoporosis shows that this can't be assumed and should be checked.
If the performance is lower within-family, the PGS can still be used for embryo screening, but the lower predictive ability needs to be accounted for when calibrating risk predictions.
If the performance is lower within-family, the PGS can still be used for embryo screening, but the lower predictive ability needs to be accounted for when calibrating risk predictions.
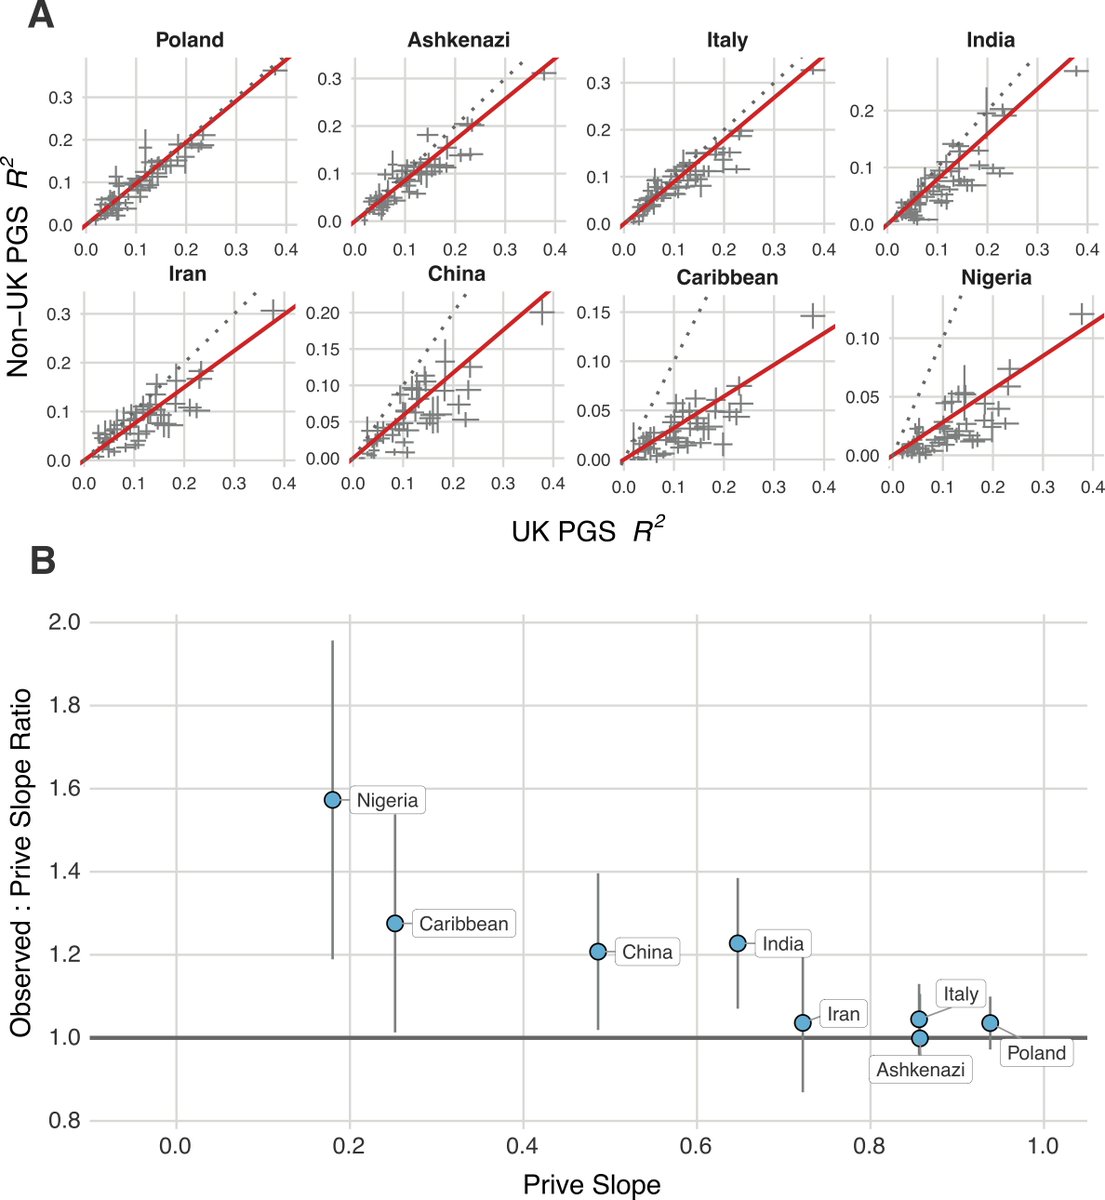
PGS prediction accuracy declines with genetic distance from the training sample. We assessed this for our PGS to calibrate our predictions for different ancestries, finding improved prediction ability for non-Europeans compared to previously published results (Prive et al.).
The improvements are likely due to applying SBayesRC to 7.3M SNPs with functional annotations, enabling some degree of fine-mapping of causal variants shared across ancestries.
The improvements are likely due to applying SBayesRC to 7.3M SNPs with functional annotations, enabling some degree of fine-mapping of causal variants shared across ancestries.
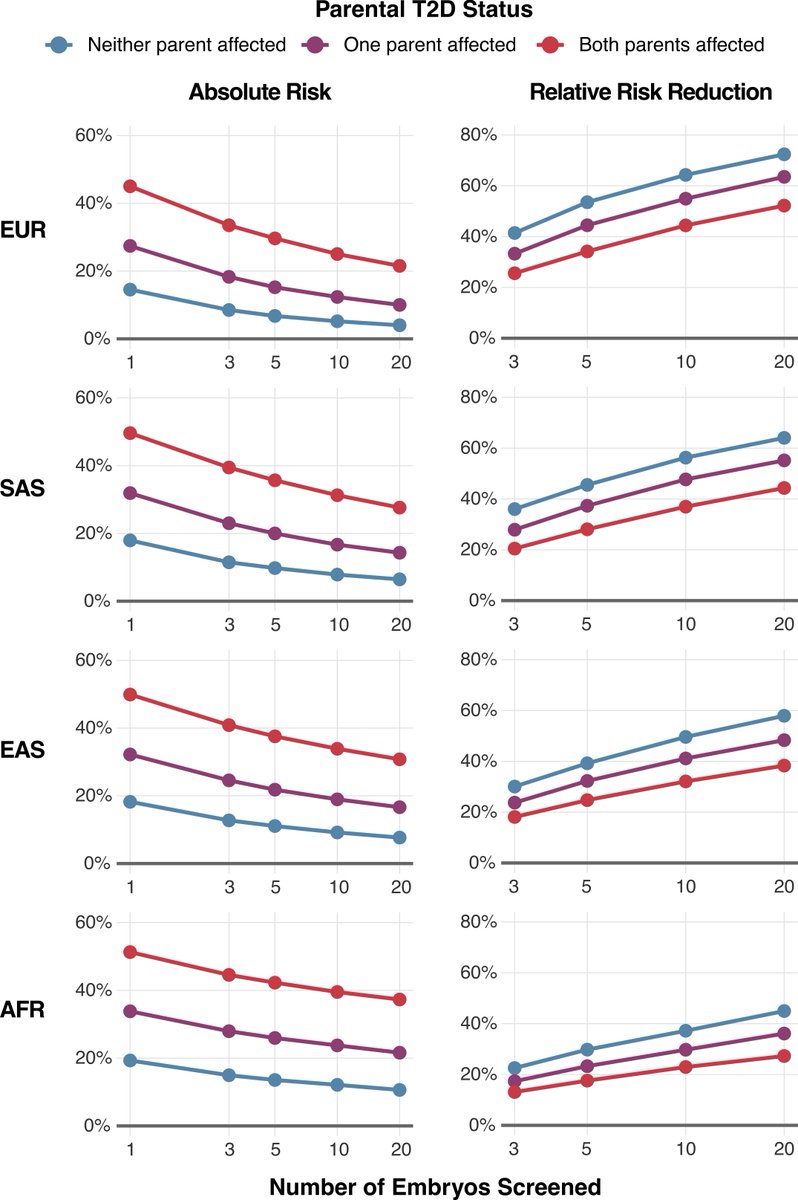
We use type-II diabetes to illustrate the utility of our scores for embryo screening. Even with 5 embryos, the absolute risk reduction ranges from 5% to 15% depending on parental ancestries and disease status, with relative risk reductions of ~50% expected in some scenarios — e.g. two EUR ancestry parents without type-II diabetes and 5 embryos to screen.
Thanks to @_twolfram for leading this effort and the rest of the team (@SponceyM @jeremyli__ @JonathanAnomaly) at @herasight! Check out our website () and sign up to keep informed. Even more exciting science is coming soon!herasight.com
@_twolfram @SponceyM @jeremyli__ @JonathanAnomaly @herasight Check out our accessible article here:
https://x.com/herasight/status/1950575297058807952
@_twolfram @SponceyM @jeremyli__ @JonathanAnomaly @herasight And thanks to our advisors @joe_pickrell and @timothycbates
And @sebastian_gero
• • •
Missing some Tweet in this thread? You can try to
force a refresh


