At @herasight, we wanted to compare our genetic predictors (PGS) to those from @nucleusgenomics. However, in many cases, we couldn’t reconcile plausible performance of their PGSs with customer risk reports we saw — this may have misled customers about their disease risks. 

Nine of their PGSs appeared to be open-source models from PGS catalog. Many (see table) relied on small numbers of variants despite being for polygenic diseases. State of the art PGS typically use thousands or millions of variants to maximize predictive ability.
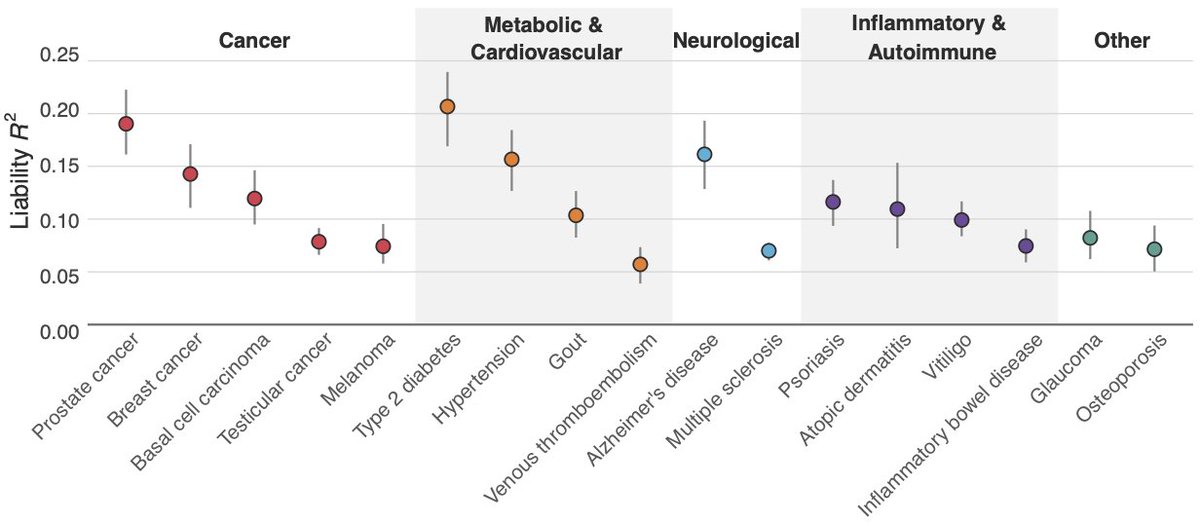
The table gives our liability scale R^2 (a measure of PGS prediction performance) back-engineered from customer reports, along with the number of variants used in the PGS, and the R^2 we achieved in our independent validation in UKBB.
The table gives our liability scale R^2 (a measure of PGS prediction performance) back-engineered from customer reports, along with the number of variants used in the PGS, and the R^2 we achieved in our independent validation in UKBB.

We back-engineered the implied liability R^2 (a measure of PGS prediction ability) from Nucleus’ customer reports. We compared this to our own validation in UKBB using the SNPs/PGS Nucleus claims to be using, and we found much lower prediction accuracy in almost all cases.

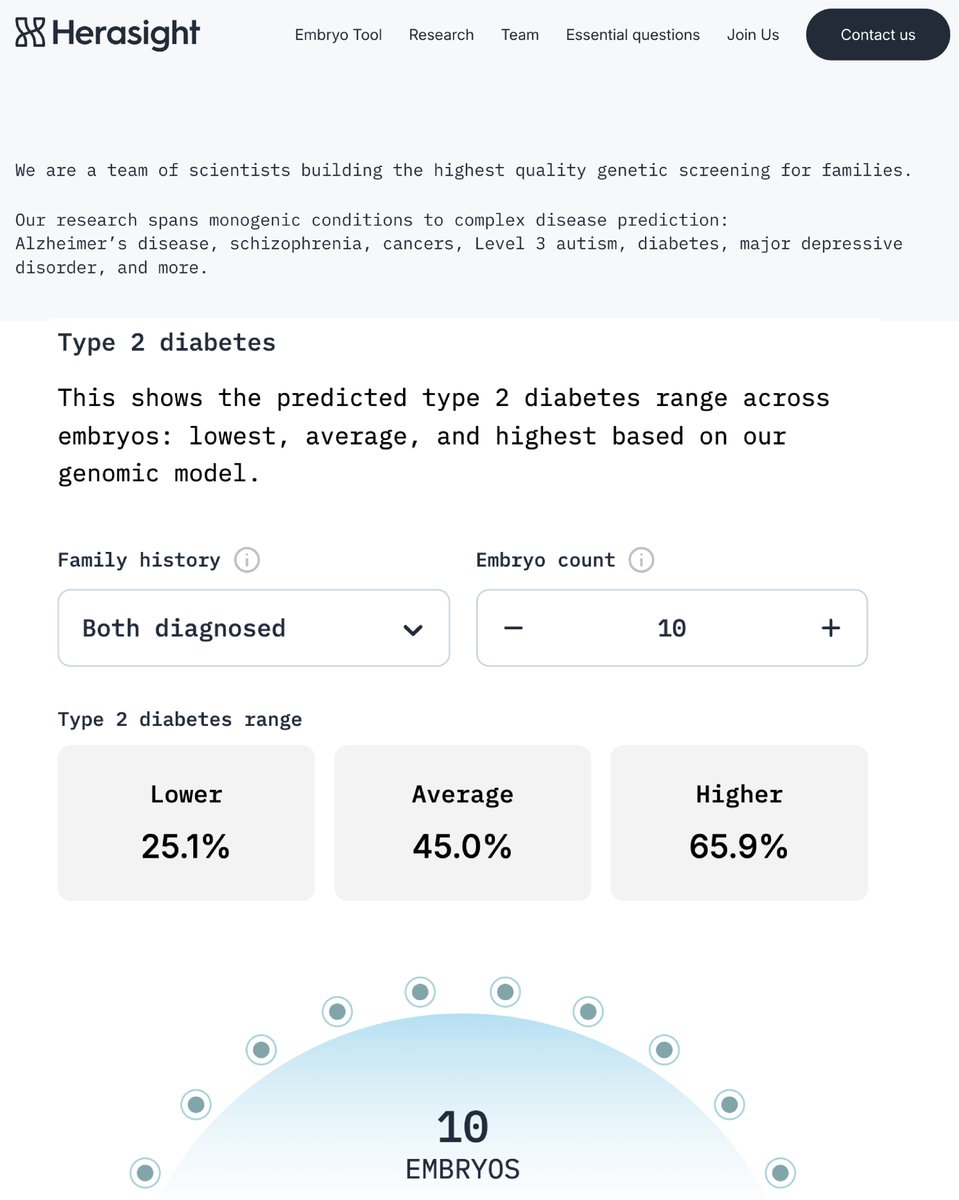
These issues can mislead people about their disease risks. For example, someone whose hypertension PGS was in the top 5% would be told they have a 71% risk of hypertension. But in actuality, their risk based on this PGS would be 54%, close to the average, around 49%.
This is based on a liability threshold model with a liability R^2 of 11.7%, as we back-engineered from Nucleus’ consumer reports (see our white paper on our website: herasight.com), a population prevalence of 48.5%, and the R^2 we obtained from our UKBB validation, 0.6%.
This is based on a liability threshold model with a liability R^2 of 11.7%, as we back-engineered from Nucleus’ consumer reports (see our white paper on our website: herasight.com), a population prevalence of 48.5%, and the R^2 we obtained from our UKBB validation, 0.6%.
We also found evidence of non-standard statistical/epidemiological practices in their reports. We found multiple reports where someone had a positive PGS (usually indicating above average risk) but their risk report was below average (see below).
This appears to be contradicted by what Nucleus state on their own website: “... it’s critical to standardize the results to a common scale. Nucleus delivers common genetic scores on a bell curve with an average of 0 and a standard deviation of 1. The distance between someone’s risk and the average risk of a person with their genetic ancestry is known as a Z-score…” (Source: archive.md/VFmCf)
Also, disease prevalence rates were assumed to be the same across ancestries in the reports we saw.

Reports gave age-stratified risk estimates, but don’t seem to differentiate between age and cohort effects. For example, ADHD risk appears to go down with age, but risk of ever being diagnosed with ADHD can only go up with age. This is likely because diagnosis rates differ with year-of-birth, a cohort effect.

We also found that Nucleus’ carrier screening does not appear to be as comprehensive as advertised. A particularly notable case is the exclusion of the SMN1 gene from their carrier screening.
Pathogenic variation in this gene is the primary cause of spinal muscular atrophy (SMA), a severe progressive neuromuscular disorder with high mortality and limited therapeutic interventions. This omission is in conflict with professional guidelines. The American College of Obstetricians and Gynecologists (ACOG) explicitly recommends that “All patients who are considering pregnancy or are already pregnant, regardless of screening strategy and ethnicity, should be offered carrier screening for cystic fibrosis and spinal muscular atrophy…”. The American College of Medical Genetics and Genomics (ACMG) recommends reporting SMN1. While Nucleus does screen for UBA1, another gene responsible for SMA, neglecting SMN1 is a particularly notable oversight because around 2% of people are carriers, and this gene is the cause of disease for approximately 95% of SMA cases.
However, Nucleus' customer-facing website emphasizes the critical importance of screening for rare genetic conditions, prominently featuring SMA alongside six other conditions, yet their carrier screening product doesn’t actually test for the crucial gene SMN1 as far as one can assess at time of writing.

A note of caution for people considering genetic testing: check that the company you are considering has published validation of their genetic tests. We compiled a list of ‘infrequently asked questions’ that you should ask any company you’re considering for embryo screening on herasight.com. You can also find our white paper whose supplementary note has details on our analysis of Nucleus. And check out our accessible article here: x.com/herasight/stat…
I am enthusiastic about the potential for embryo selection, but much of my research has focused on how polygenic scores can be affected by confounding that reduces their performance in within-family prediction, highlighting the methodological complexity of this area. Without methodological rigor, it is easy to mislead people, with real consequences in the context of embryo screening.
@herasight @nucleusgenomics @ShaiCarmi @nunorgcarvalho @SashaGusevPosts
• • •
Missing some Tweet in this thread? You can try to
force a refresh