In Switzerland, 1 in 7 adults is a millionaire.
This is 5 times more than in the US.
So, I wanted to learn their wealth-building habits.
Here are 7 ways the Swiss approach money to become richer than you:
This is 5 times more than in the US.
So, I wanted to learn their wealth-building habits.
Here are 7 ways the Swiss approach money to become richer than you:

Switzerland has the world's largest percentage of millionaires.
AND they have 1 billionaire for every 80,000 people.
What's the Swiss secret – is it all about banking and neutrality?
To start answering this question, here's an interview with some locals:
AND they have 1 billionaire for every 80,000 people.
What's the Swiss secret – is it all about banking and neutrality?
To start answering this question, here's an interview with some locals:
Before we dive in, here's the low-down:
• 14.9% of Swiss adults are millionaires
• That's nearly double the rate of the US (8.8%)
• Yet Switzerland isn't even in the top 10 for average income
So how do they do it?
It's all about some key mindset shifts – here's a clue:
• 14.9% of Swiss adults are millionaires
• That's nearly double the rate of the US (8.8%)
• Yet Switzerland isn't even in the top 10 for average income
So how do they do it?
It's all about some key mindset shifts – here's a clue:
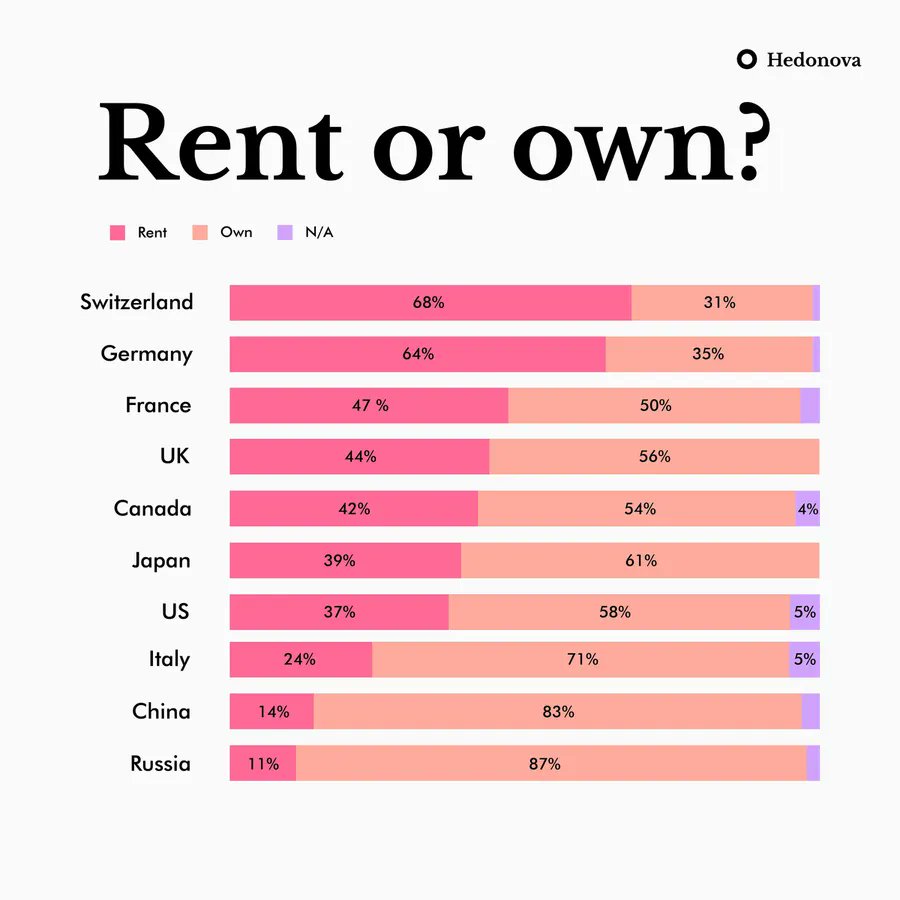
They Rent for Life (& They Love It)
Shocking fact: Only 41% of Swiss own their homes.
In the US? It's 65%.
Swiss millennials aren't obsessed with buying houses.
Why? They invest the difference in high-yield assets instead. Meanwhile...
Shocking fact: Only 41% of Swiss own their homes.
In the US? It's 65%.
Swiss millennials aren't obsessed with buying houses.
Why? They invest the difference in high-yield assets instead. Meanwhile...
They Treat Saving Like a Bill
Most people save what's left after spending. The Swiss? They spend what's left after saving.
They automate 20-30% of their income into savings BEFORE touching it.
It's not about willpower. It's about systems.
But saving alone won't make you rich:
Most people save what's left after spending. The Swiss? They spend what's left after saving.
They automate 20-30% of their income into savings BEFORE touching it.
It's not about willpower. It's about systems.
But saving alone won't make you rich:
Swiss People Invest in Themselves
The average Swiss spends 5-10% of their income on education and skills.
Every year. They're not chasing degrees. They're after specific, high-value skills.
Think languages, tech skills & financial literacy.
Speaking of finances:
The average Swiss spends 5-10% of their income on education and skills.
Every year. They're not chasing degrees. They're after specific, high-value skills.
Think languages, tech skills & financial literacy.
Speaking of finances:
The "Multi-Bank Strategy"
Swiss millionaires don't put all their eggs in one basket.
They typically use 3-5 different banks for various purposes:
• Local bank for daily transactions
• Private bank for wealth management
• International bank for foreign exchange
Why do this?
Swiss millionaires don't put all their eggs in one basket.
They typically use 3-5 different banks for various purposes:
• Local bank for daily transactions
• Private bank for wealth management
• International bank for foreign exchange
Why do this?
Risk Mitigation & Opportunity Maximization
Different banks = different strengths and offerings.
For example, one might offer better rates for real estate investments, while another excels in international trades.
It's about leveraging each bank's unique advantages.
Different banks = different strengths and offerings.
For example, one might offer better rates for real estate investments, while another excels in international trades.
It's about leveraging each bank's unique advantages.

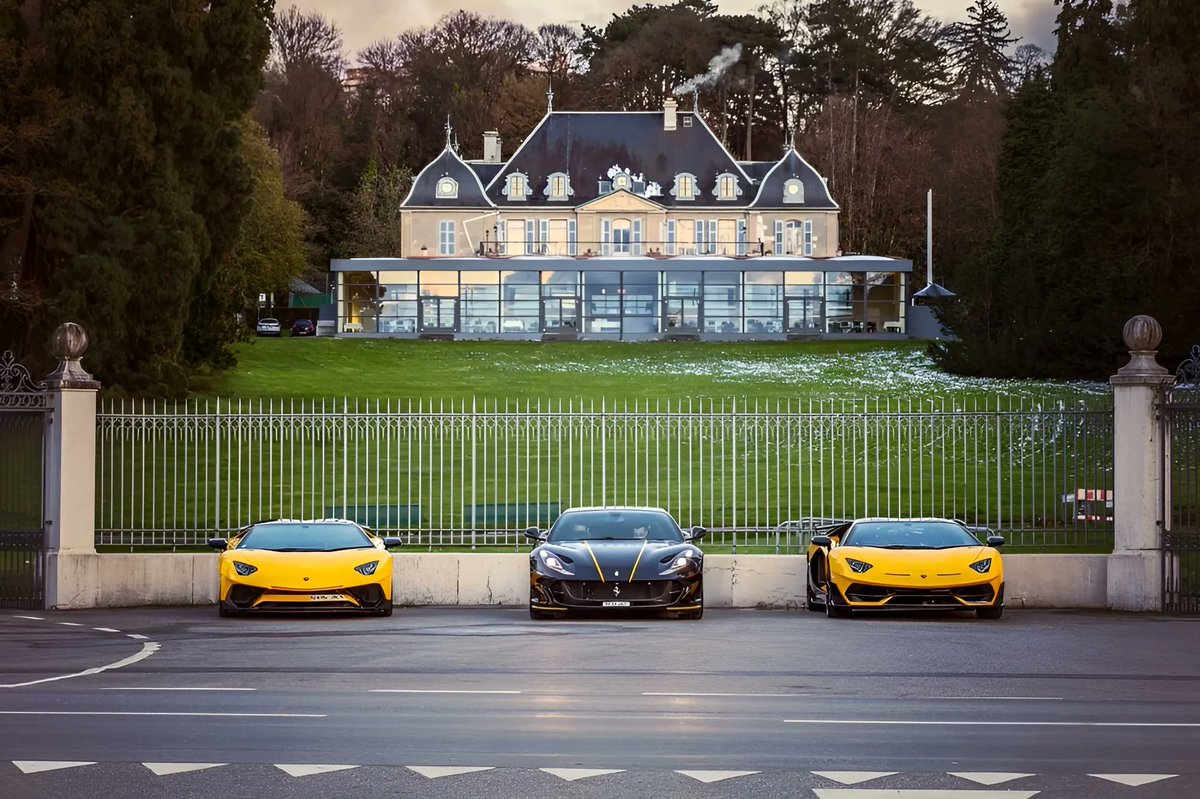
Master "Stealth Wealth"
You won't see Swiss millionaires flaunting designer logos or exotic cars.
They live below their means and reinvest the difference.
It's not about deprivation. It's about delayed gratification.
But the real game-changer?
You won't see Swiss millionaires flaunting designer logos or exotic cars.
They live below their means and reinvest the difference.
It's not about deprivation. It's about delayed gratification.
But the real game-changer?
The "Global Citizen" Approach
Swiss investors think beyond borders.
They diversify globally, not just in assets, but in residency and citizenship.
Many have second passports or residencies in other countries because it opens more financial opportunities & tax optimizations.
Swiss investors think beyond borders.
They diversify globally, not just in assets, but in residency and citizenship.
Many have second passports or residencies in other countries because it opens more financial opportunities & tax optimizations.
These strategies require patience and a long-term mindset.
The Swiss aren't after get-rich-quick schemes.
They're building generational wealth.
And that's perhaps the biggest lesson of all:
True wealth isn't about making money. It's about keeping and growing it.
The Swiss aren't after get-rich-quick schemes.
They're building generational wealth.
And that's perhaps the biggest lesson of all:
True wealth isn't about making money. It's about keeping and growing it.
So, what can we learn from the Swiss millionaire mindset?
• Automate your savings
• Live below your means
• Invest in high-value skills
• Think long-term and globally
• Diversify across banks and borders
The path to wealth is a marathon. Are you ready to run it?
• Automate your savings
• Live below your means
• Invest in high-value skills
• Think long-term and globally
• Diversify across banks and borders
The path to wealth is a marathon. Are you ready to run it?
That's wrap
If you found this thread helpful:
1. Follow me more such content.
2. RT the tweet below to share with your audience.
If you found this thread helpful:
1. Follow me more such content.
2. RT the tweet below to share with your audience.
https://twitter.com/1134445195863437314/status/1951162091316060245
• • •
Missing some Tweet in this thread? You can try to
force a refresh