Thread:
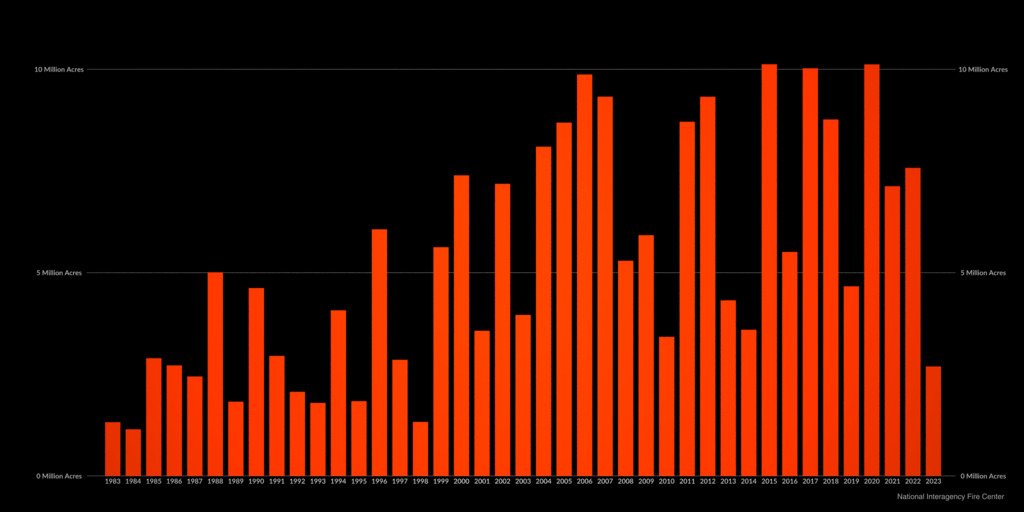
Bad climate science and NASA is at the forefront of it. Here, NASA discusses how the burned area in the US appears to be increasing since 1983.
Why does NASA stop at 1983? Because the government is jiggering the results to amplify the fear. Let me explain.
Bad climate science and NASA is at the forefront of it. Here, NASA discusses how the burned area in the US appears to be increasing since 1983.
Why does NASA stop at 1983? Because the government is jiggering the results to amplify the fear. Let me explain.

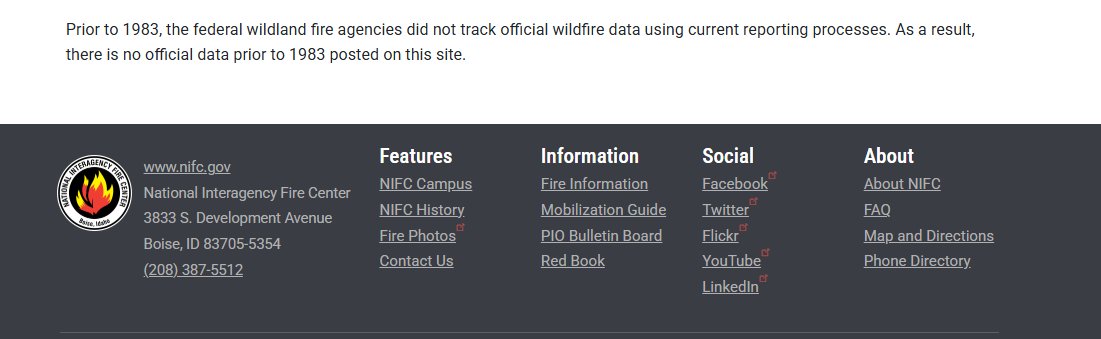
The National Interagency Fire Center keeps the official records for forest fires and area burned. According to the NIFC, there are no official records for forest fire area burned before 1983 and it won't provide that data.
Weird, huh?
Weird, huh?
I mean, one would think that there is information regarding area burned prior to 1983. Well, there is. Bjorn Lomborg did a fantastic job four years ago going through the data.
This, of course, caused the media and climate scientists to throw a hissy fit.
This, of course, caused the media and climate scientists to throw a hissy fit.

Indeed, PolitiProgressiveOpinionConfirmer rated the claim "mostly false." It reached this opinion because "federal officials have known for some time that their data was unreliable, and this year, they took most of it off their website."
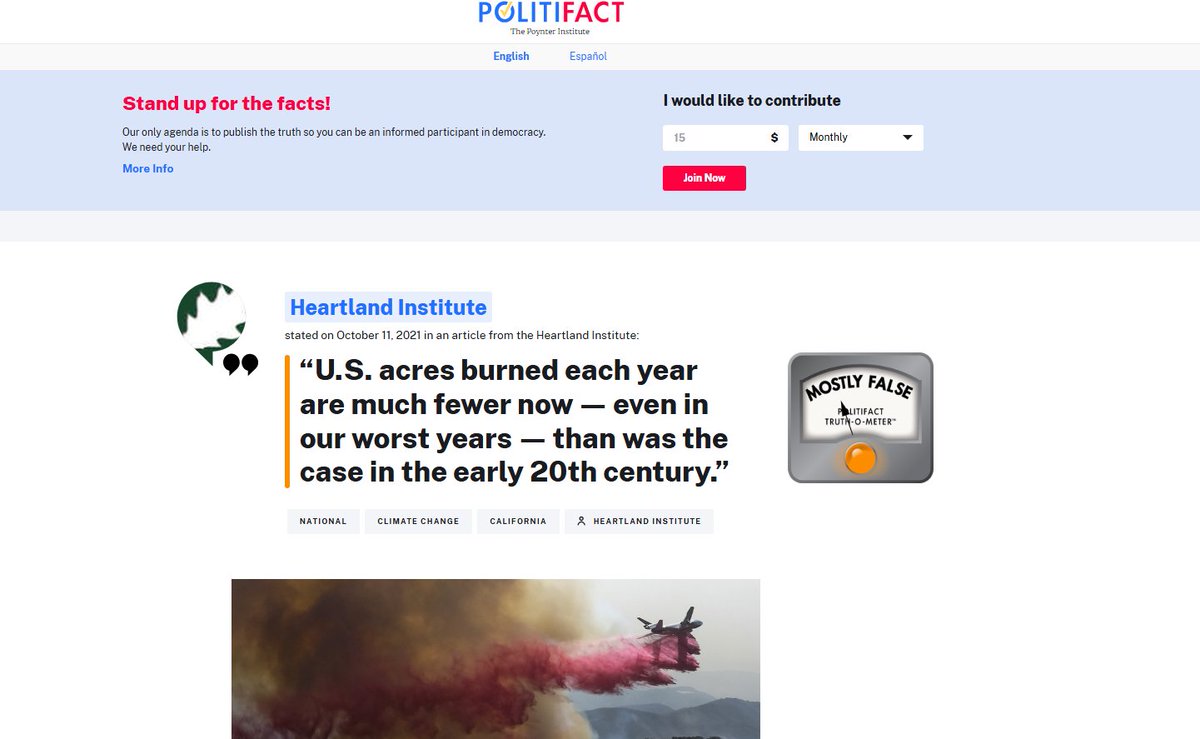
According to government sources, millions of acres were burned with intent. In addition, there was double counting and potentially undercounting. Therefore, the data is hopelessly ambiguous and no one can sort it out.
Of course, this is the same government that believes it can determine the average global temperature in 1900 down to the tenth of a degree. Why can't they disambiguate data to account for intentional burns and double counting?
The answer is that they can. Indeed, it's far more reliable than determining what average global temperatures are. They have the records, and they can get a good approximation.
The government refuses to report the data because the data appears to show that the 1960s, 70s, and 80s were an unusually calm period in North America. Anyone looking at the long view of the data sees a clear cycle. Like the temperature cycle in North America.
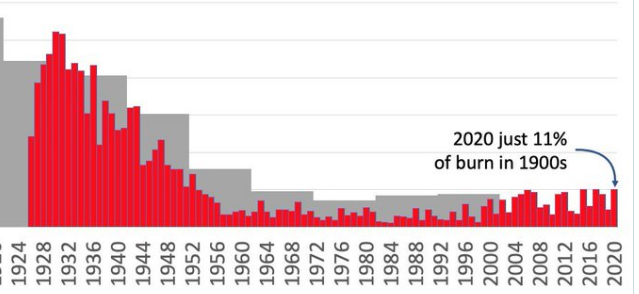
Even if there was a lot of double counting and one eliminated 10 million intentionally burned acres per year in the 20s and 30s, that era would still have a lot of acreage burned.
By the way, I don't know why one would eliminate the intentional burns. It's still acreage burned.
By the way, I don't know why one would eliminate the intentional burns. It's still acreage burned.
Regarding the intentional burns that the government argues occurred in the 20s and 30s that makes the data "unreliable," the 10 million acres per year would be the same as the two worst recorded years by the NIFC since 1983.
IOW, the government admits that every year, there was what the media and government today calls a "catastrophic" fire year. Let that sink in for just a moment. What we call catastrophic today, people in the early 20th century called a normal year.
Returning to the point, the only reason to stop at 1983 is because the government doesn't like the long-term results. The results look much worse if one begins during a quiet period and then shows a rapid ramp up, which is what the NIFC and NASA graphs do.
It is also laughable that anyone could possibly take a 40-year snapshot and argue that it means the world is falling apart. Any legitimate scientist would tell you that it could be a cycle, normal within a range, abnormally low, or abnormally high.
They would not know.
They would not know.
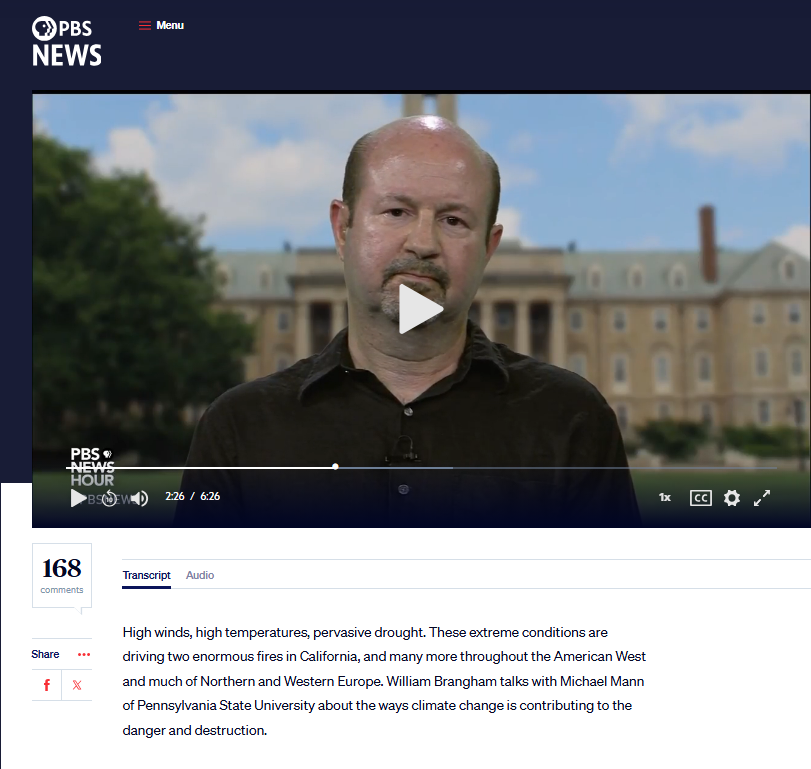
But climate scientists are not legitimate scientists. They are propagandists. Michael Mann is one of the leading climate alarmists masquerading as a scientist. Everything that he touches is suspect.
Don't trust government data on anything. Too often, it is manipulated to serve a government interest or goal. The fire data is no different.
The government is simply burying fire data because it destroys its narrative. That says something about the narrative and it isn't good.
The government is simply burying fire data because it destroys its narrative. That says something about the narrative and it isn't good.
• • •
Missing some Tweet in this thread? You can try to
force a refresh