I tried using orbs
I tried Supply and Demand.
I even tried using Elliott Waves.
but trading did not click for me until I started studying the best traders and noticed 1 simple pattern...
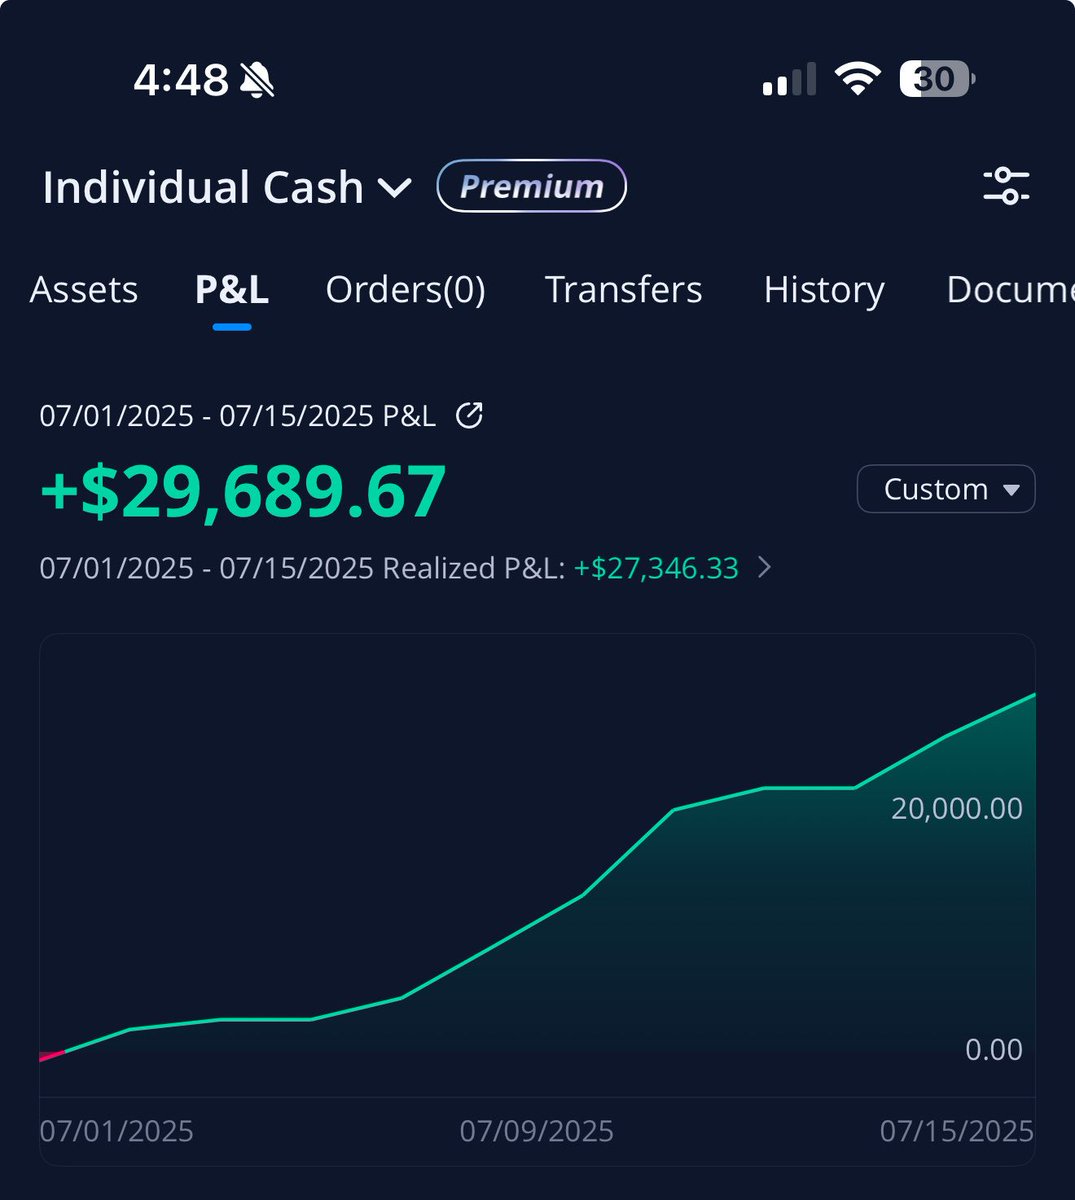
Below you can steal the exact strategy that makes me 50/k month:🧵
I tried Supply and Demand.
I even tried using Elliott Waves.
but trading did not click for me until I started studying the best traders and noticed 1 simple pattern...
Below you can steal the exact strategy that makes me 50/k month:🧵

To start off, we most understand the point of this strategy..
The goal is to simplify trading and look for repeatable patterns to trade
We want to take advantage of strong market trends & use the leverage of options for a low risk high reward approach
Using big momentum swings in the markets we can catch the biggest moves to either side
The goal is to ride the trend.
studying some of the trading greats I realized all of them have 1 thing in common...
They don't take a million different trades on the lower time frames.
The patiently wait for the best opportunities in the markets coming out of the bigger time frames
Massive basses, these are where the account changing moves are.
They don't take a million different trades on the lower time frames.
The patiently wait for the best opportunities in the markets coming out of the bigger time frames
Massive basses, these are where the account changing moves are.
1. Finding the trend
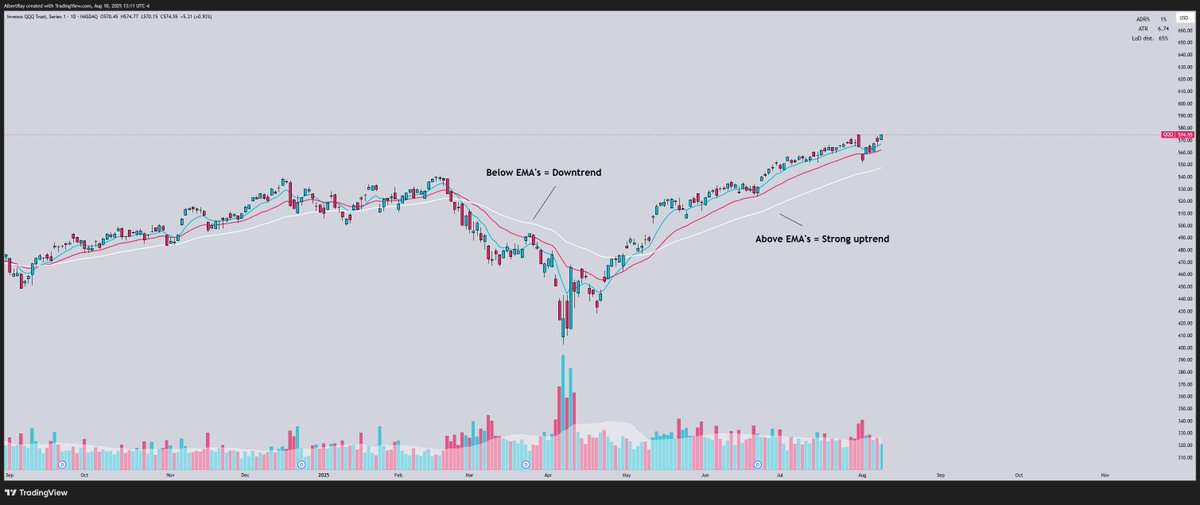
The easiest way to figure out the trend of the markets is to use EMA's
Pull up a chart on
and add the 8, 21, 50 EMA's
EMA's can be used as a momentum gauge for when the markets are stronger and will trend higher tradingview.com
The easiest way to figure out the trend of the markets is to use EMA's
Pull up a chart on
and add the 8, 21, 50 EMA's
EMA's can be used as a momentum gauge for when the markets are stronger and will trend higher tradingview.com
2. Framework
Now that we have the EMA's on the chart, we can make some rules for when we want to be active in the markets.
Use $SPY / $QQQ
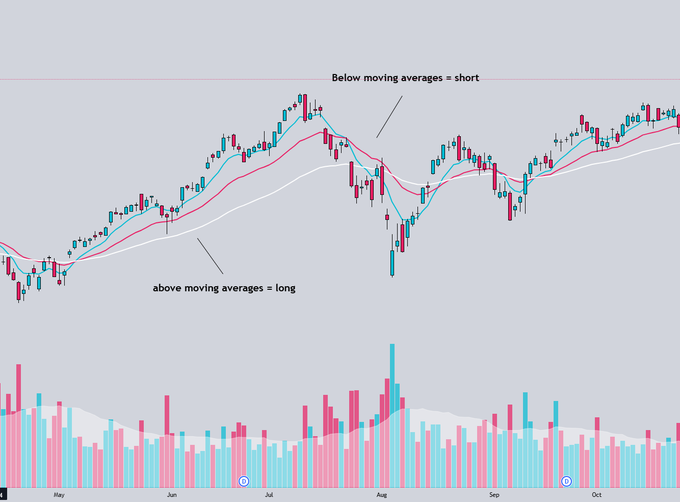
1) Whenever $SPY / $QQQ are above the 8/21/50 EMA's, we want to be long with full size/conviction
2) Whenever $SPY / $QQQ are below the 8/21/50 EMA's, we want to trade stocks to the downside--or avoid trading
We can also use this on the individual names we are trading to narrow down our criteria.
Now that we have the EMA's on the chart, we can make some rules for when we want to be active in the markets.
Use $SPY / $QQQ
1) Whenever $SPY / $QQQ are above the 8/21/50 EMA's, we want to be long with full size/conviction
2) Whenever $SPY / $QQQ are below the 8/21/50 EMA's, we want to trade stocks to the downside--or avoid trading
We can also use this on the individual names we are trading to narrow down our criteria.
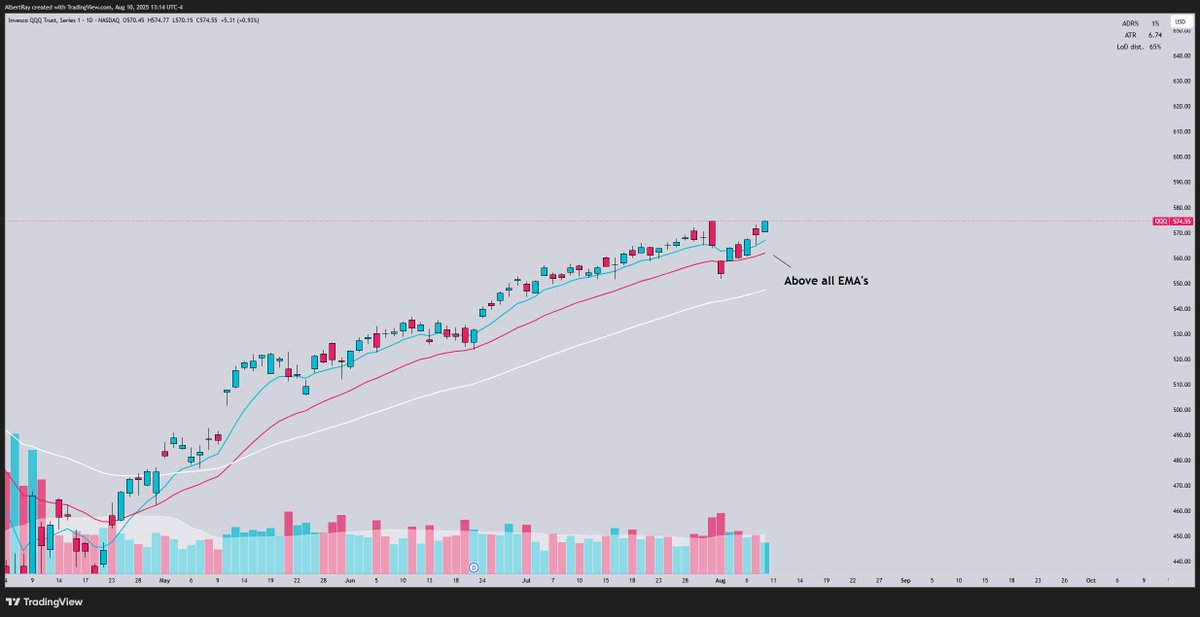
once we establish which way the market is trending, we can start to scan for the strongest stocks(in an uptrend).
The market has been in a strong trend so we want to look for the stocks leading the markets higher
The true market liquid leaders... these are the stocks you want to be in
You don't have to be in every single stock to make a fortune, you just have to be in the right ones.
The market has been in a strong trend so we want to look for the stocks leading the markets higher
The true market liquid leaders... these are the stocks you want to be in
You don't have to be in every single stock to make a fortune, you just have to be in the right ones.
3. Scanning for leading stocks
Easiest way to scan for liquid leaders is to use: tradingview.com
Click on screener section
We want to narrow it down to search for liquid stocks that are leading the market higher on volume
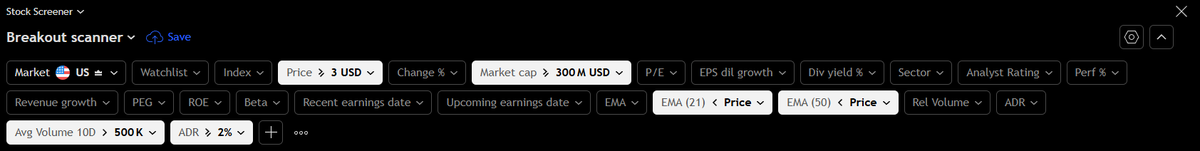
Here are the parameters I use in my scan:
Price: Over $3
Market cap: Over $300m+
Volume: Over 500k
ADR over 2%
And most importantly the 21 and 50 EMA's set to below price
Easiest way to scan for liquid leaders is to use: tradingview.com
Click on screener section
We want to narrow it down to search for liquid stocks that are leading the market higher on volume
Here are the parameters I use in my scan:
Price: Over $3
Market cap: Over $300m+
Volume: Over 500k
ADR over 2%
And most importantly the 21 and 50 EMA's set to below price
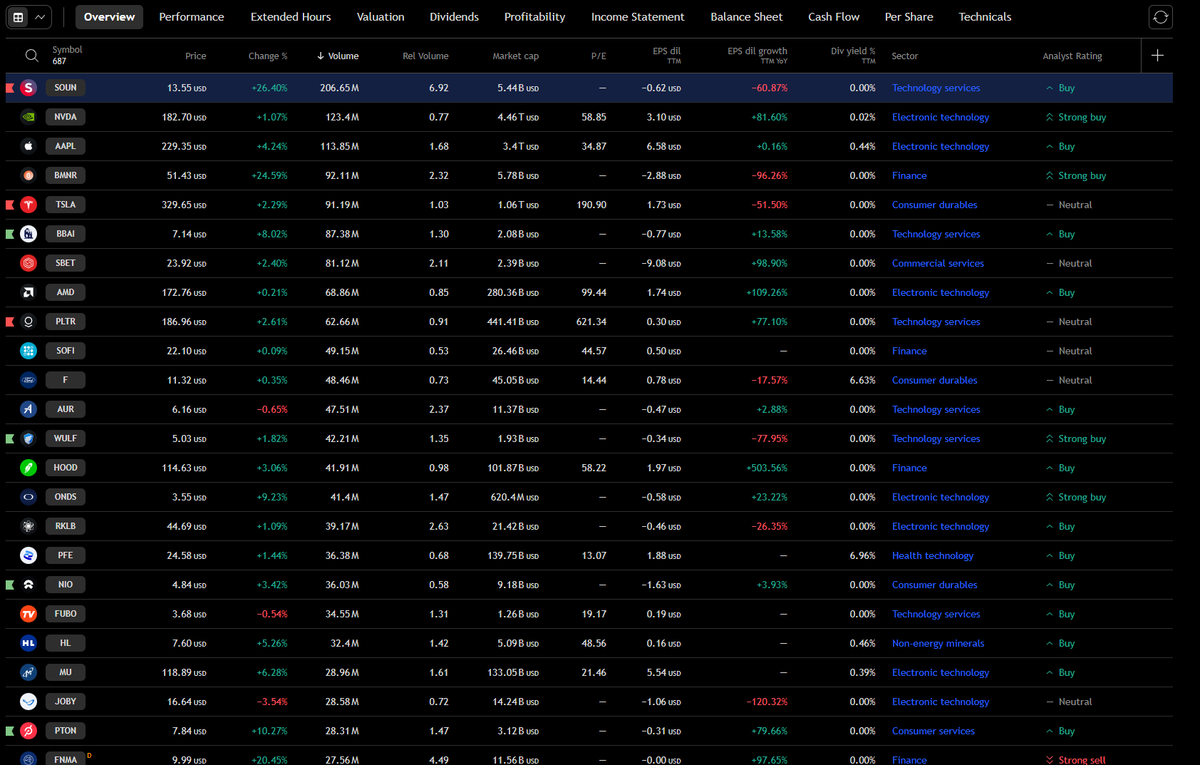
Now we have a list of the strongest stocks in the market
Sort the list by volume descending
What I love about this scan is that you only get about 200-300 stocks so you can narrow it down to the best setups pretty quickly.
Sort the list by volume descending
What I love about this scan is that you only get about 200-300 stocks so you can narrow it down to the best setups pretty quickly.
4. Setup
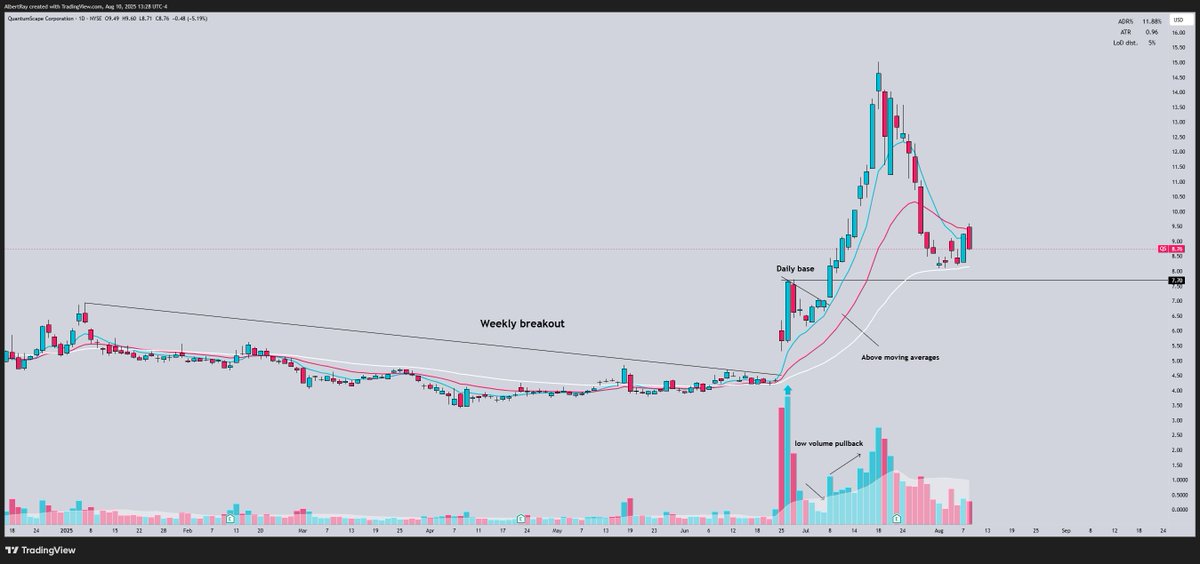
You are now looking for a chart that is setting up in a tight base with a tight pattern forming
The goal is to find names that are either just breaking out or about to break out of tight bases
Use this checklist
1. Tight pattern or base
2. Low volume pullbacks
3. Consolidating near the highs of the base
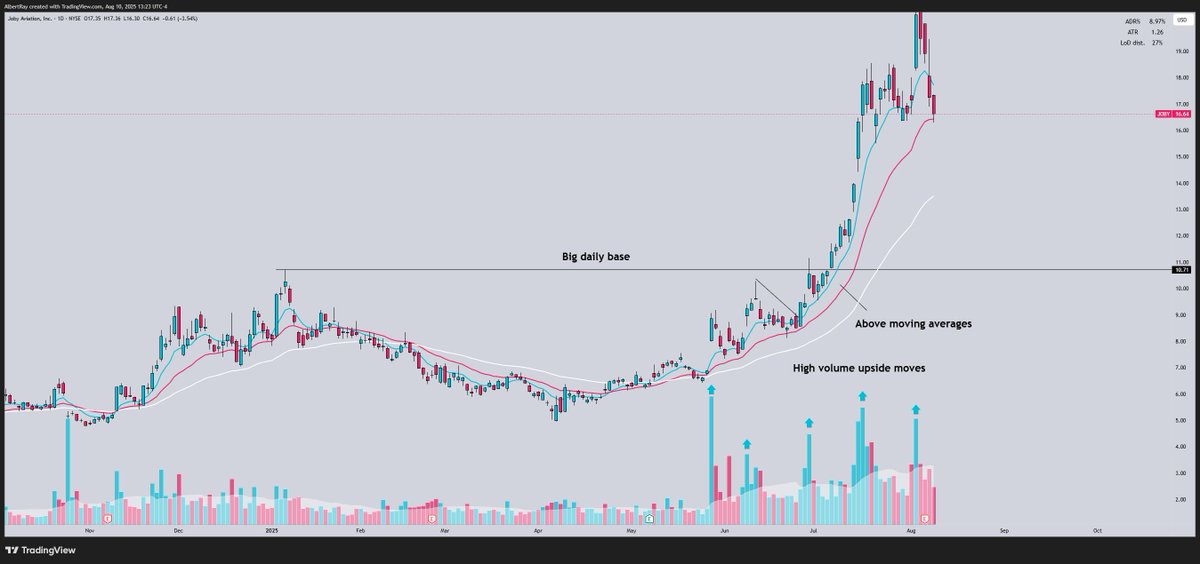
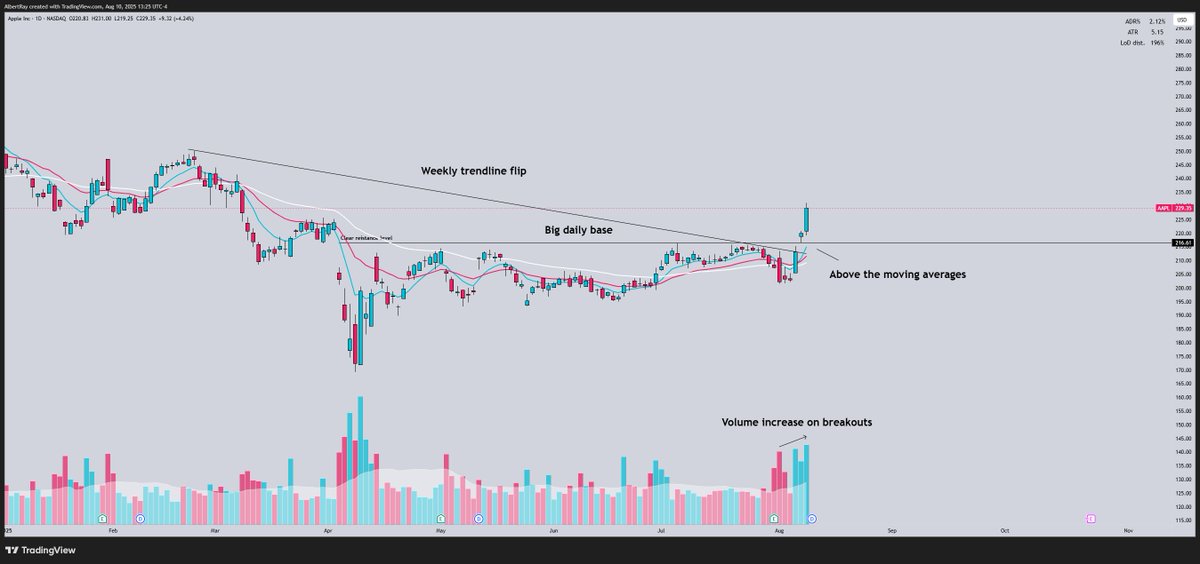
Here are a few examples of setups I look for:
You are now looking for a chart that is setting up in a tight base with a tight pattern forming
The goal is to find names that are either just breaking out or about to break out of tight bases
Use this checklist
1. Tight pattern or base
2. Low volume pullbacks
3. Consolidating near the highs of the base
Here are a few examples of setups I look for:
The goal is to scan through all these stocks and look for setups that match our criteria
we want to find 4-5 of the best looking setups and create something called a focus list:
a focus list is a more in depth watchlist consisting of a few of the best looking charts in the market.
by focusing on only a few of the best setups in the markets we can stop ourselves from overtrading and focus on executing our plan.
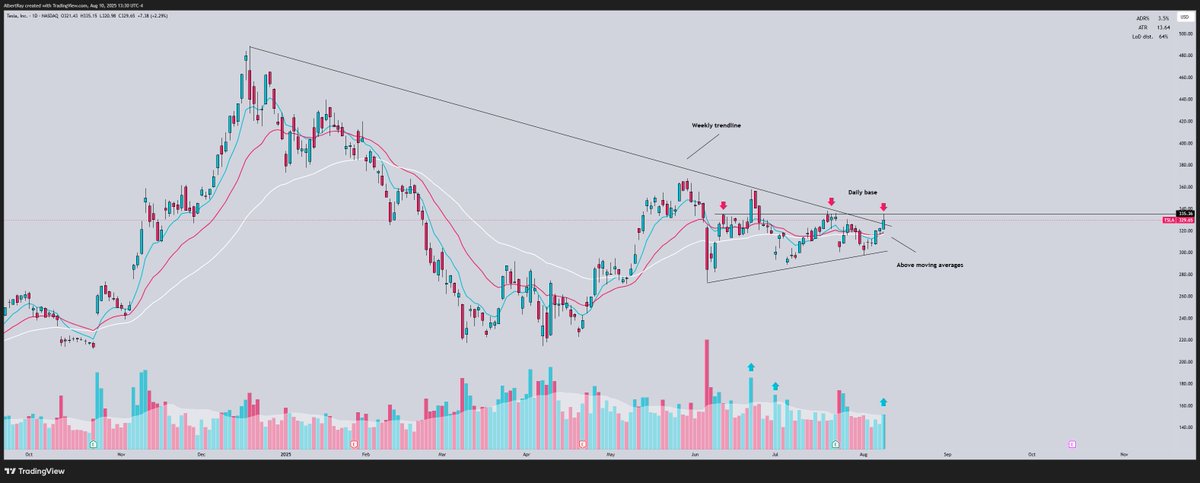
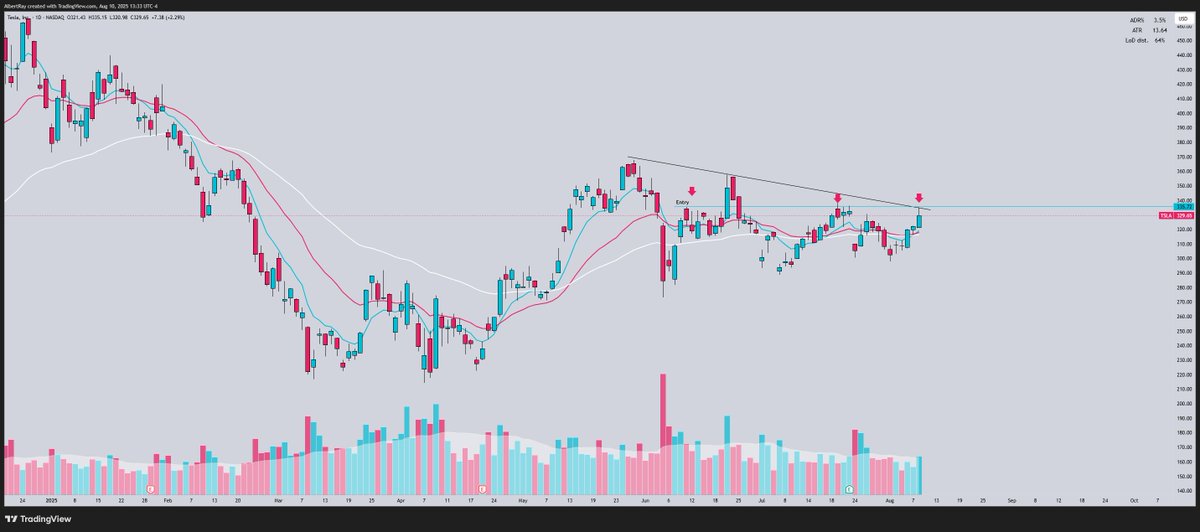
A setup that caught my attention on my scan: $TSLA
The stock is consolidating in a massive daily base
Volume is starting to increase into the right side of the base
It has a clear trigger level to use
Its in a strong theme of AI and Robotics
The stock is consolidating in a massive daily base
Volume is starting to increase into the right side of the base
It has a clear trigger level to use
Its in a strong theme of AI and Robotics
5. Entry
The easiest way to enter is to find a trigger level for the breakout
What i look for is the high of the base
breaking that level will trigger a big move
In this example, you can see the $336 price level has held multiple times
If price breaks above that level, then we can assume a daily breakout will occur
We want to confirm the breakout with lots of volume
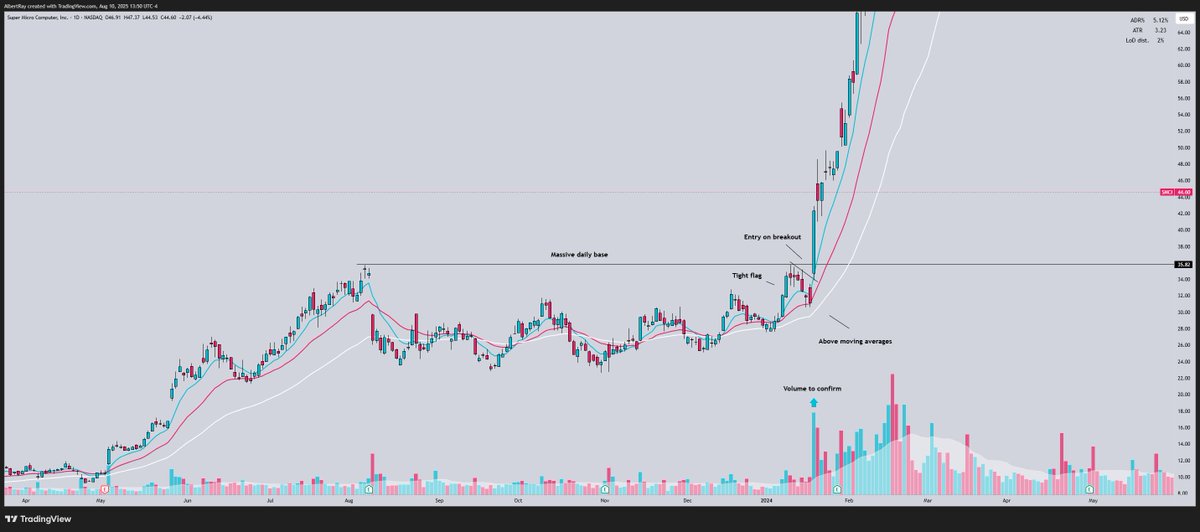
Entry is taken on a break above the trigger
For confirmation, we want to see high volume on a break out of the base.
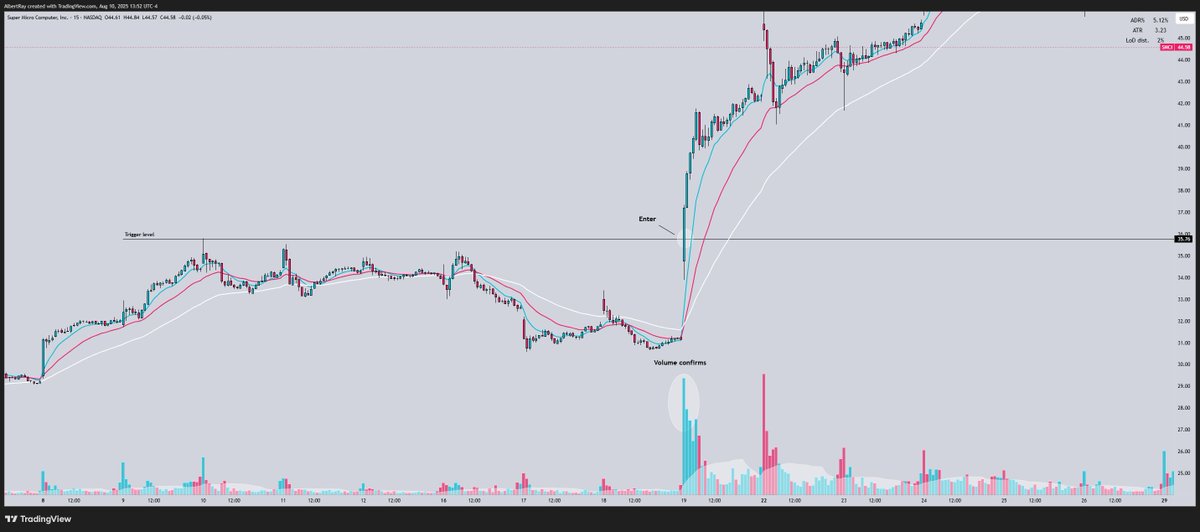
For example $SMCI base breakout:
-Leading sector (Semi conductors)
-Massive daily and weekly base
-Ton of volume on the breakout
Enter calls at the break above the trigger level
For confirmation, we want to see high volume on a break out of the base.
For example $SMCI base breakout:
-Leading sector (Semi conductors)
-Massive daily and weekly base
-Ton of volume on the breakout
Enter calls at the break above the trigger level
We can use the 5m time frame to confirm our entry.
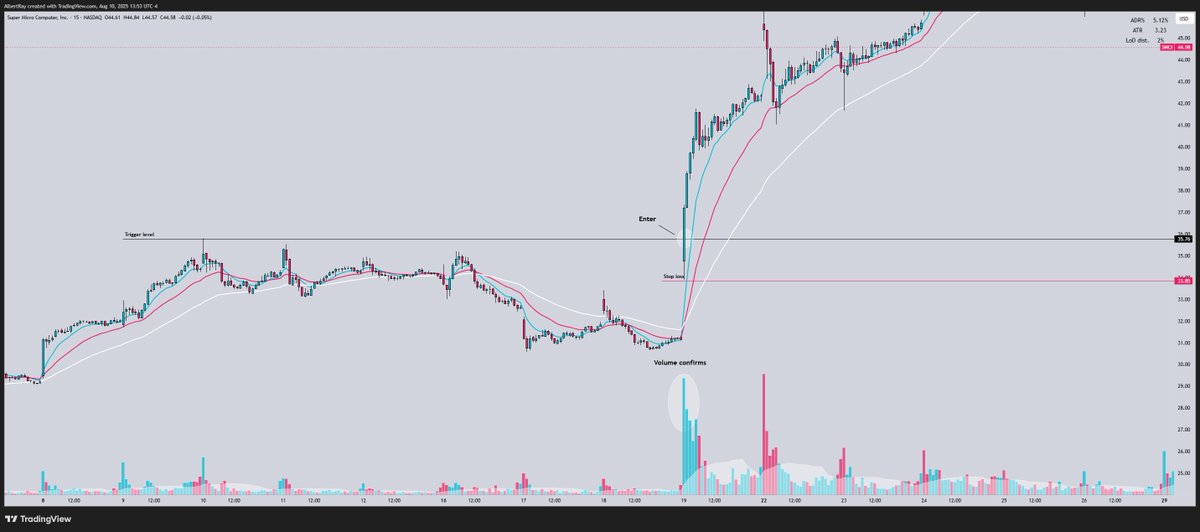
Stop loss is placed at the low of the daily candle that broke trigger
to make sure that we manage our risk in case of a failed breakout
to make sure that we manage our risk in case of a failed breakout
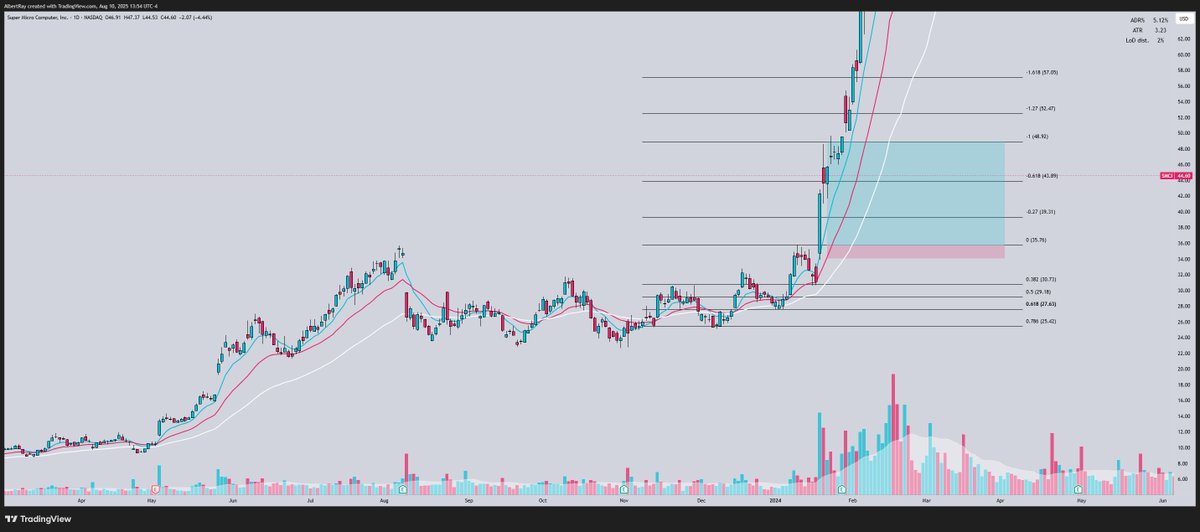
7. Targets
Take profits at previous resistance levels
If the stock is at all time highs you can use fib targets and measured moves to calculate targets(Example below)
My scale out strategy is 25% of the position at a time and moving up stop to break even after first trim.
after third trim you leave runners with a trailing stop If markets aren't following through, I trim 50% on the first target.
This sets you up for a huge r/r trade
for breakouts we do not want the stock to comeback to our entry level
the strongest moves will lockout traders and keep running
this is why my scale strategy works so well to hold winners
BIG WINNERS / Small Losers is the goal
(You will have losses like any other strategy so risk management is the most important thing)
Like any other strategy this is not a holy grail strategy but there's a reason why some of the best traders in the world swing strong names, and buy leading stocks in leading sectors.
I've personally used this strategy to catch huge trades this year:
$MSTR +1500%
$JOBY +1000%
$TSLA +500%
$HOOD +500%
$QBTS +450%
$SMR +300%
I've personally used this strategy to catch huge trades this year:
$MSTR +1500%
$JOBY +1000%
$TSLA +500%
$HOOD +500%
$QBTS +450%
$SMR +300%
I post these setups every night on my twitter with trigger levels, option contracts, and targets.
So you can follow along, and learn the strategy.
If you enjoyed and learned something from this thread LIKE+RT❤️for more trade plans and educational threads.
So you can follow along, and learn the strategy.
If you enjoyed and learned something from this thread LIKE+RT❤️for more trade plans and educational threads.
Tonight at 7pm EST I'm hosting a 100% FREE webinar covering this exact strategy
If you want to master momentum trading and change the trajectory of your trading into 2026
Don't miss this:
theoptionscartel.com/free-options-t…
If you want to master momentum trading and change the trajectory of your trading into 2026
Don't miss this:
theoptionscartel.com/free-options-t…
• • •
Missing some Tweet in this thread? You can try to
force a refresh