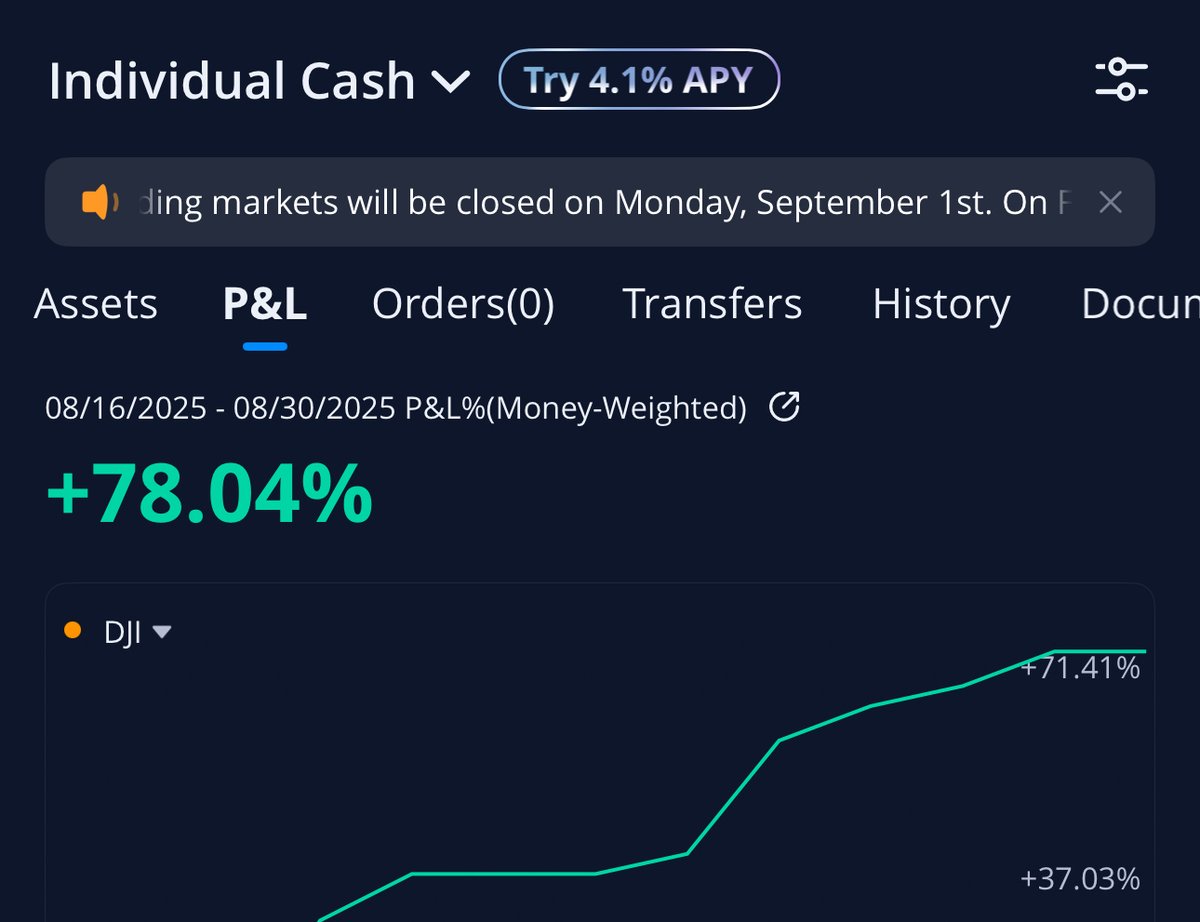
$SPY We had some tough price action to navigate during this 2nd half of August!
Here are a few tips and tricks I used to not just survive it, but come out with a 78% profit 🧵
Here are a few tips and tricks I used to not just survive it, but come out with a 78% profit 🧵
First is recognizing that not all areas on the chart justify a full size position. And some areas are just flat out not worth trading at all.
I made this guide to show you the blueprint I follow every single day.
Its a loose guide of how I want to approach sizing 👇
I made this guide to show you the blueprint I follow every single day.
Its a loose guide of how I want to approach sizing 👇

I can't tell you how many times that guide has saved me from over sizing and over trading in price action just like this 👇

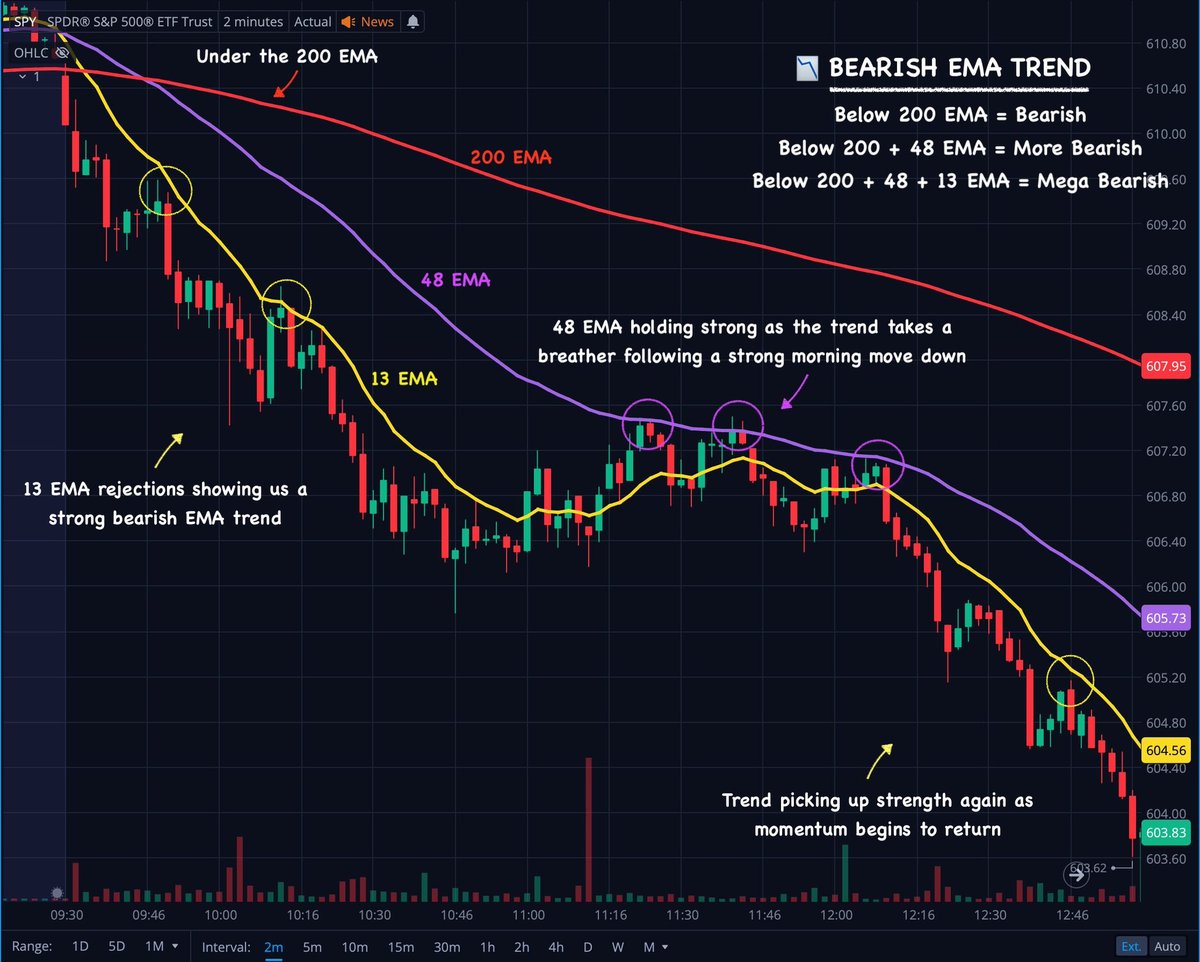
Now here's my guide for direction...
Couple it with the chart above and I have both which direction I want to trade, and how heavy I want to trade it.
Guides like these give me a game plan to follow, and force me to be a little more patient for my setups 👇
Couple it with the chart above and I have both which direction I want to trade, and how heavy I want to trade it.
Guides like these give me a game plan to follow, and force me to be a little more patient for my setups 👇
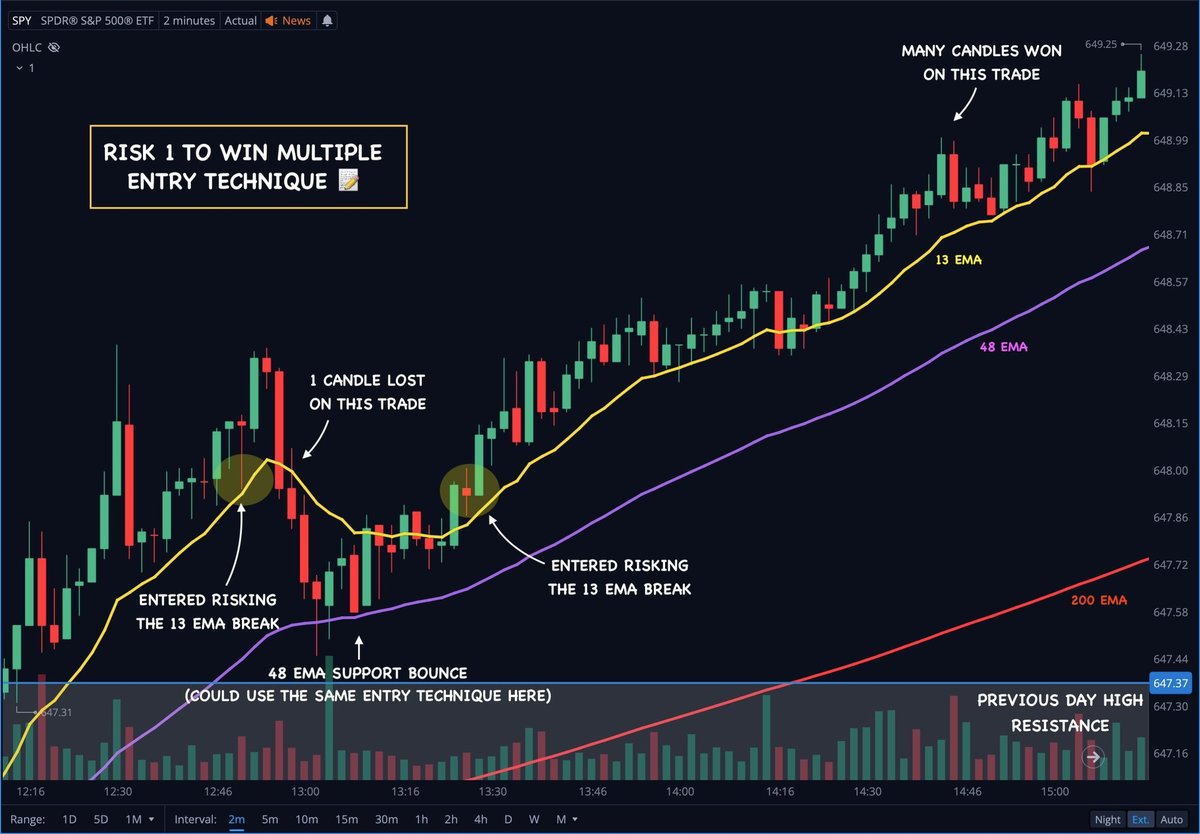
Next is keeping my stop losses fairly tight on trades.
Typically I'm using a level or EMA as my stop. I will enter at the level or EMA, then only risk a candle or 2 beyond that level before I cut the trade.
It's a simple way to keep wins bigger than losses. Here's an example of 2 trades I took this week and how shows how even a 50% win rate can produce a nice return for the day👇
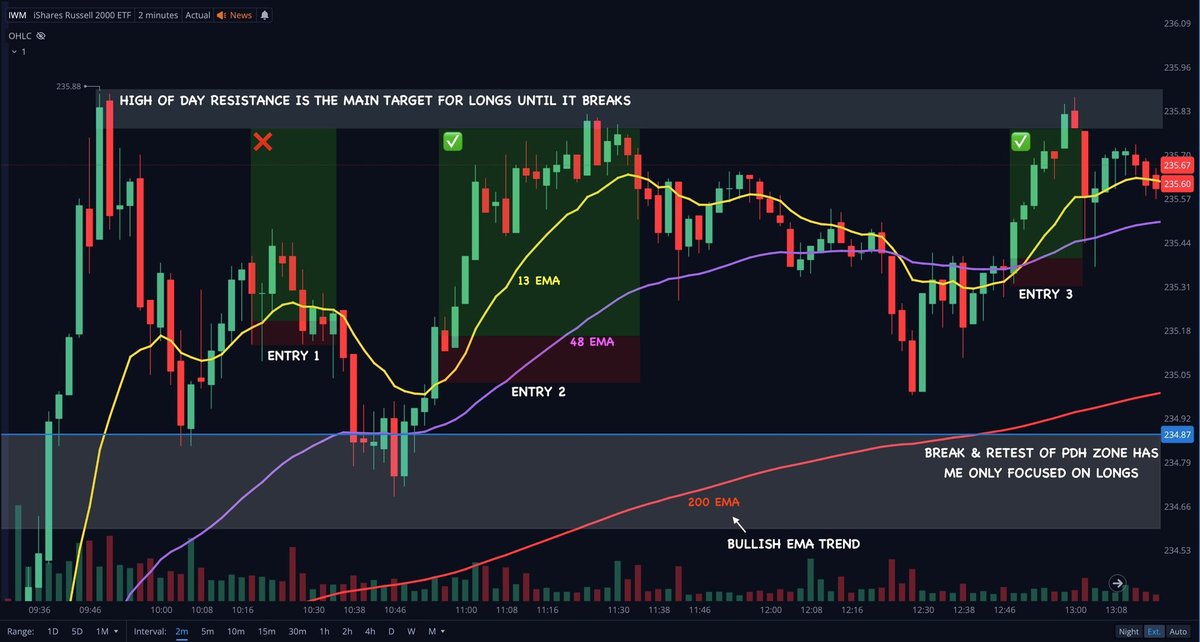
Another example of my stop loss technique on 3 trades I took on $IWM last week 👇
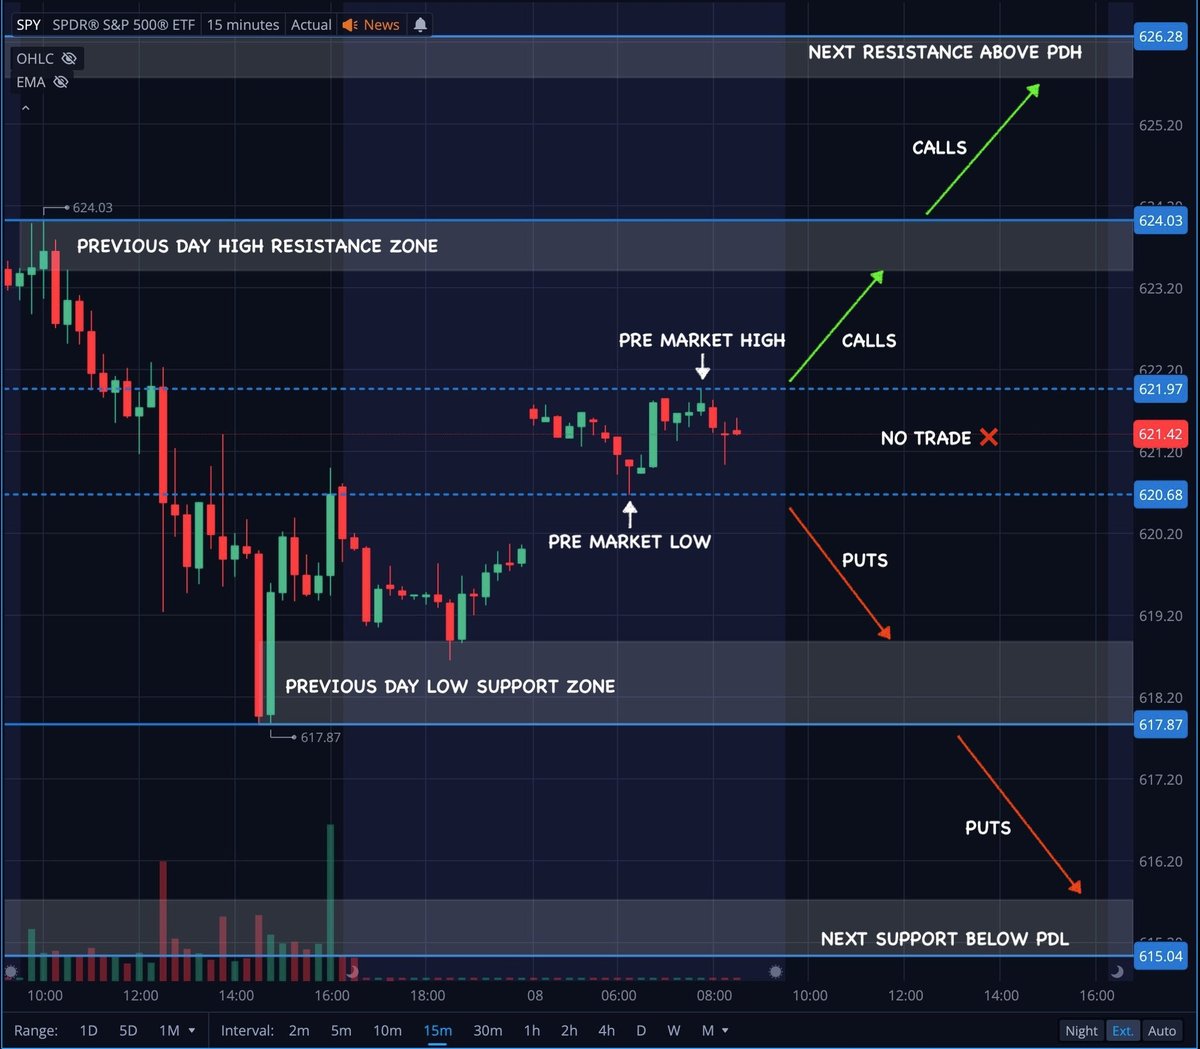
The 15 minute chart 📝
I keep it up at all times. It can help give you clear visual of what is happening when those lower timeframes are getting a little noisy.
15 minute chart confirms direction! Then the lower timeframes help me find an entry 👇
I keep it up at all times. It can help give you clear visual of what is happening when those lower timeframes are getting a little noisy.
15 minute chart confirms direction! Then the lower timeframes help me find an entry 👇


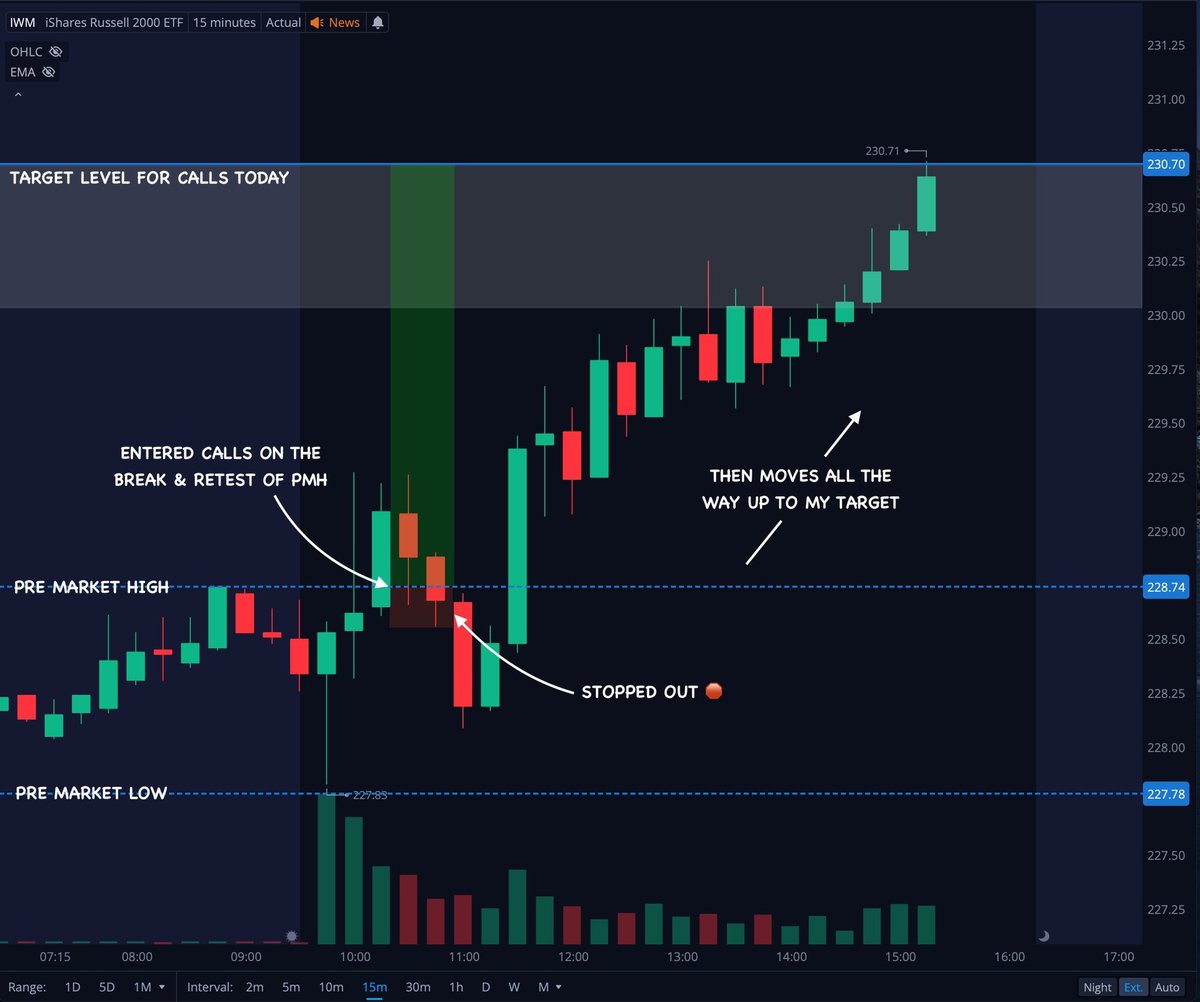
Win and loss trade examples.
Refer to the guides above...
Break & retest of PMH.
Moderate postion sizing.
Aim for that PDH resistance.
Faked out on 1, got the move on the other. It is what it is. The plan is to follow the plan 👇
Refer to the guides above...
Break & retest of PMH.
Moderate postion sizing.
Aim for that PDH resistance.
Faked out on 1, got the move on the other. It is what it is. The plan is to follow the plan 👇
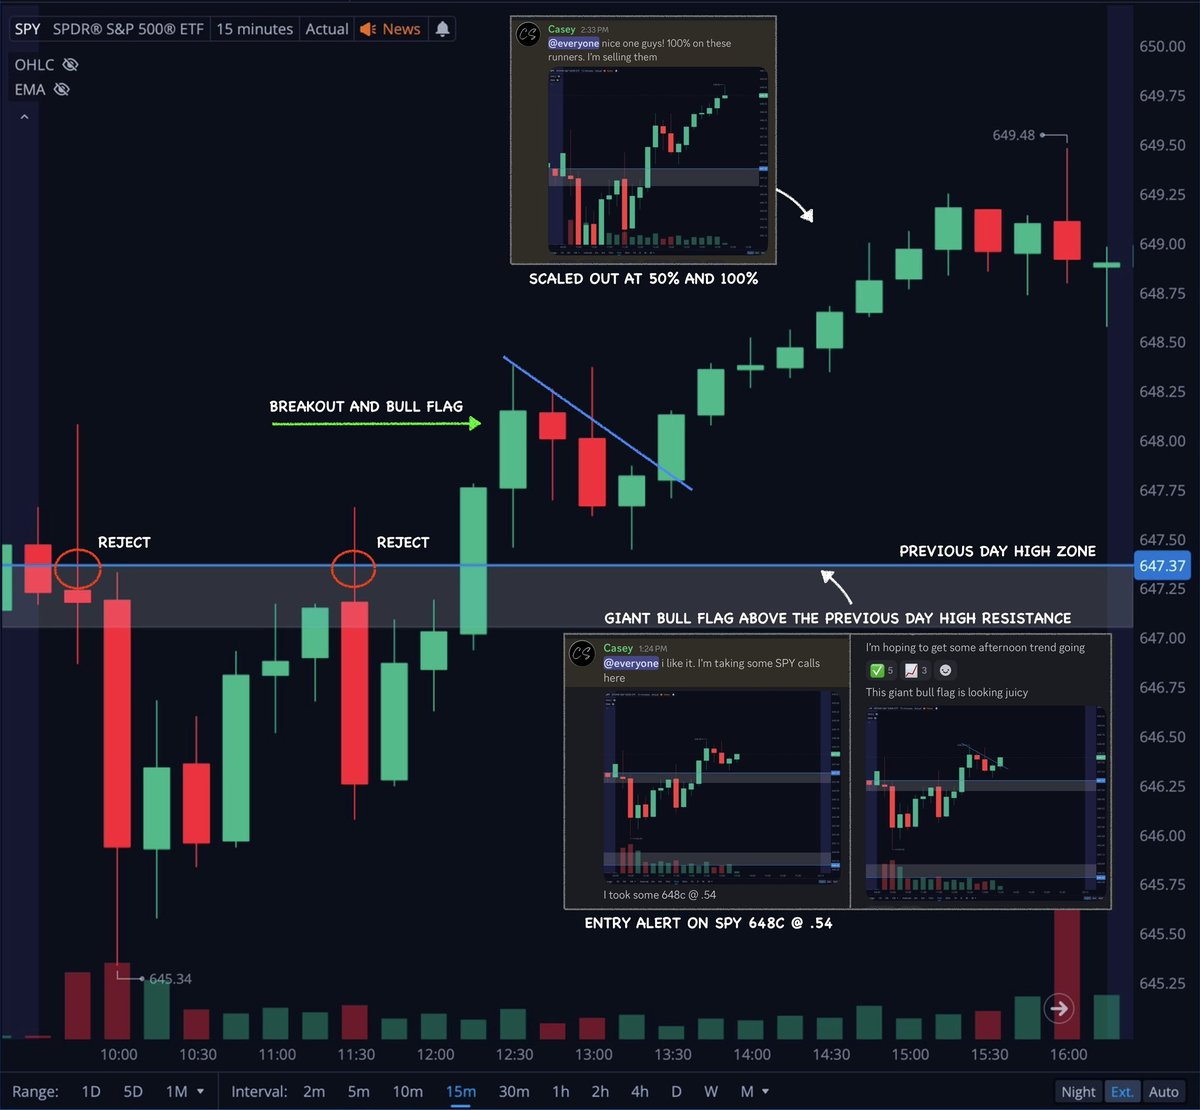
Another trade example,
Break and Bull Flag above PDH resistance.
Refer to the guides above...
Favor longs for a full size position. Got a nice win. Again, it is what it is. My only plan is to follow my plan.
Break and Bull Flag above PDH resistance.
Refer to the guides above...
Favor longs for a full size position. Got a nice win. Again, it is what it is. My only plan is to follow my plan.
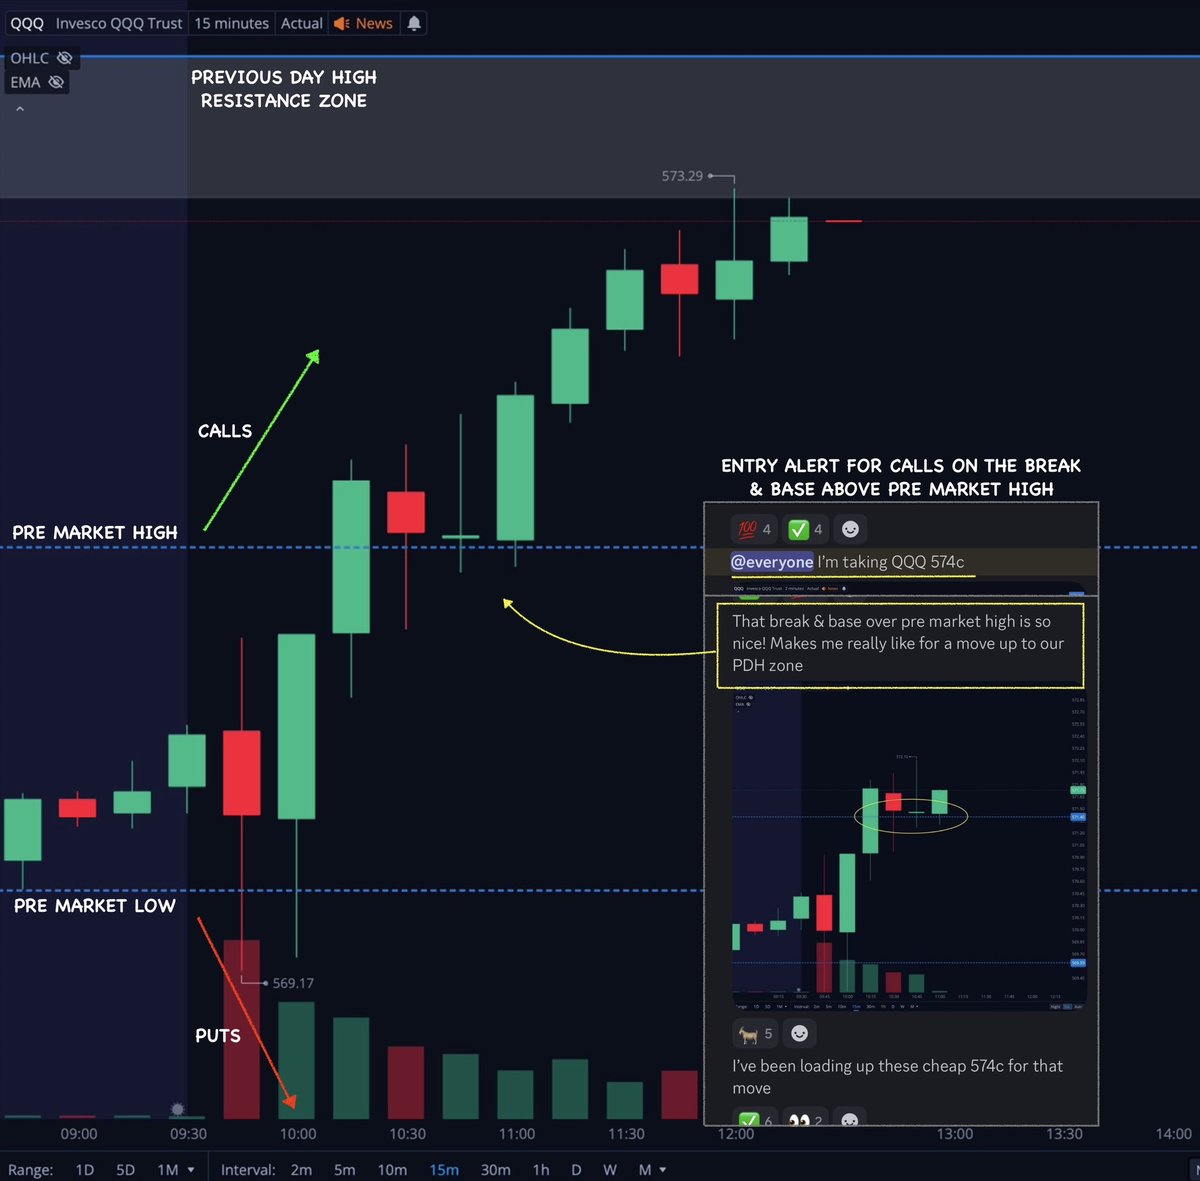
Another trade example...
$QQQ break & retest of PMH
You know the drill 👇
$QQQ break & retest of PMH
You know the drill 👇
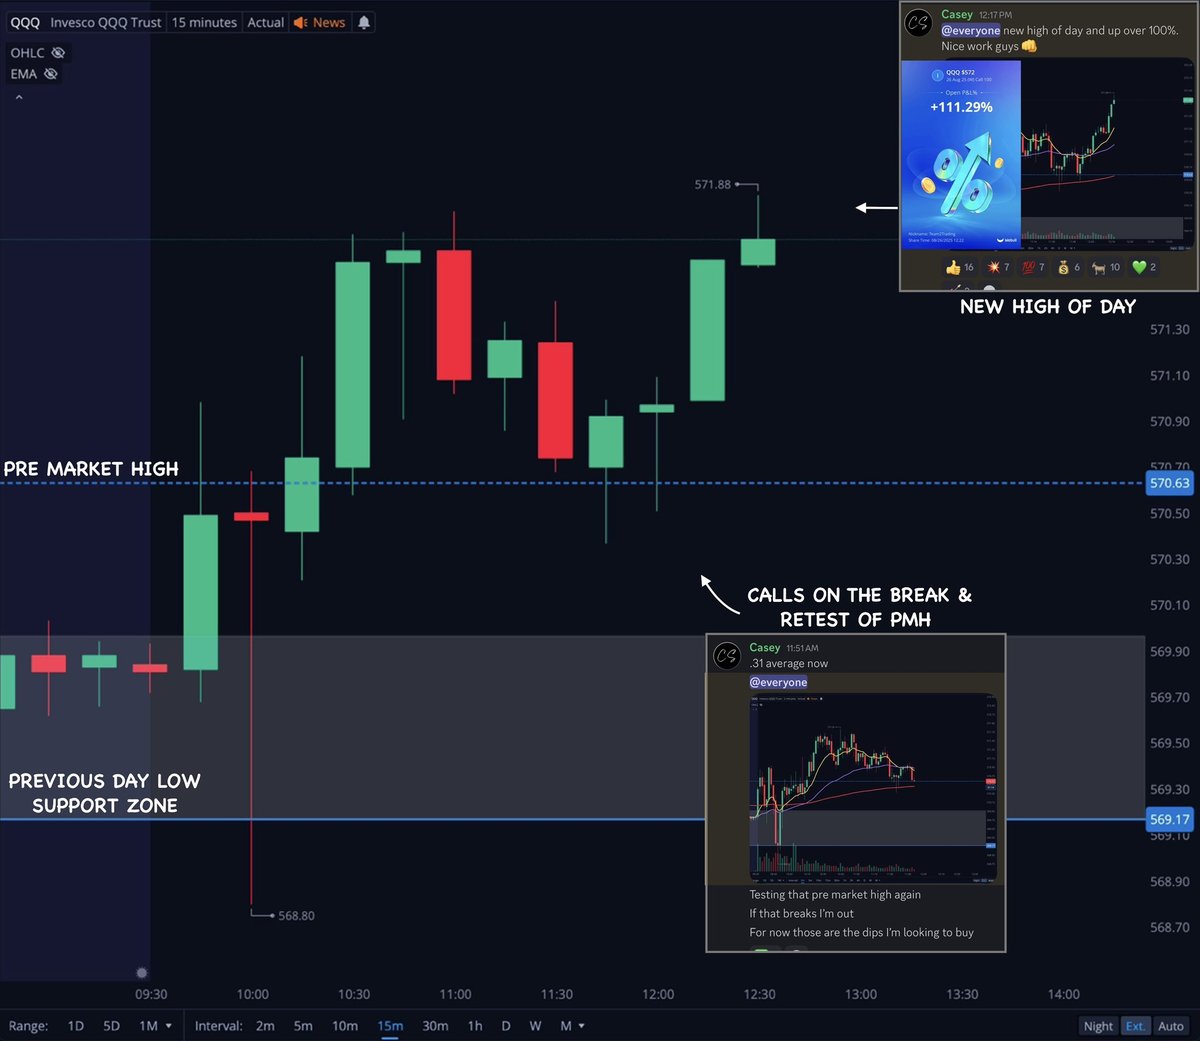
The examples above are 15 minute charts to highlight the direction and sizing.
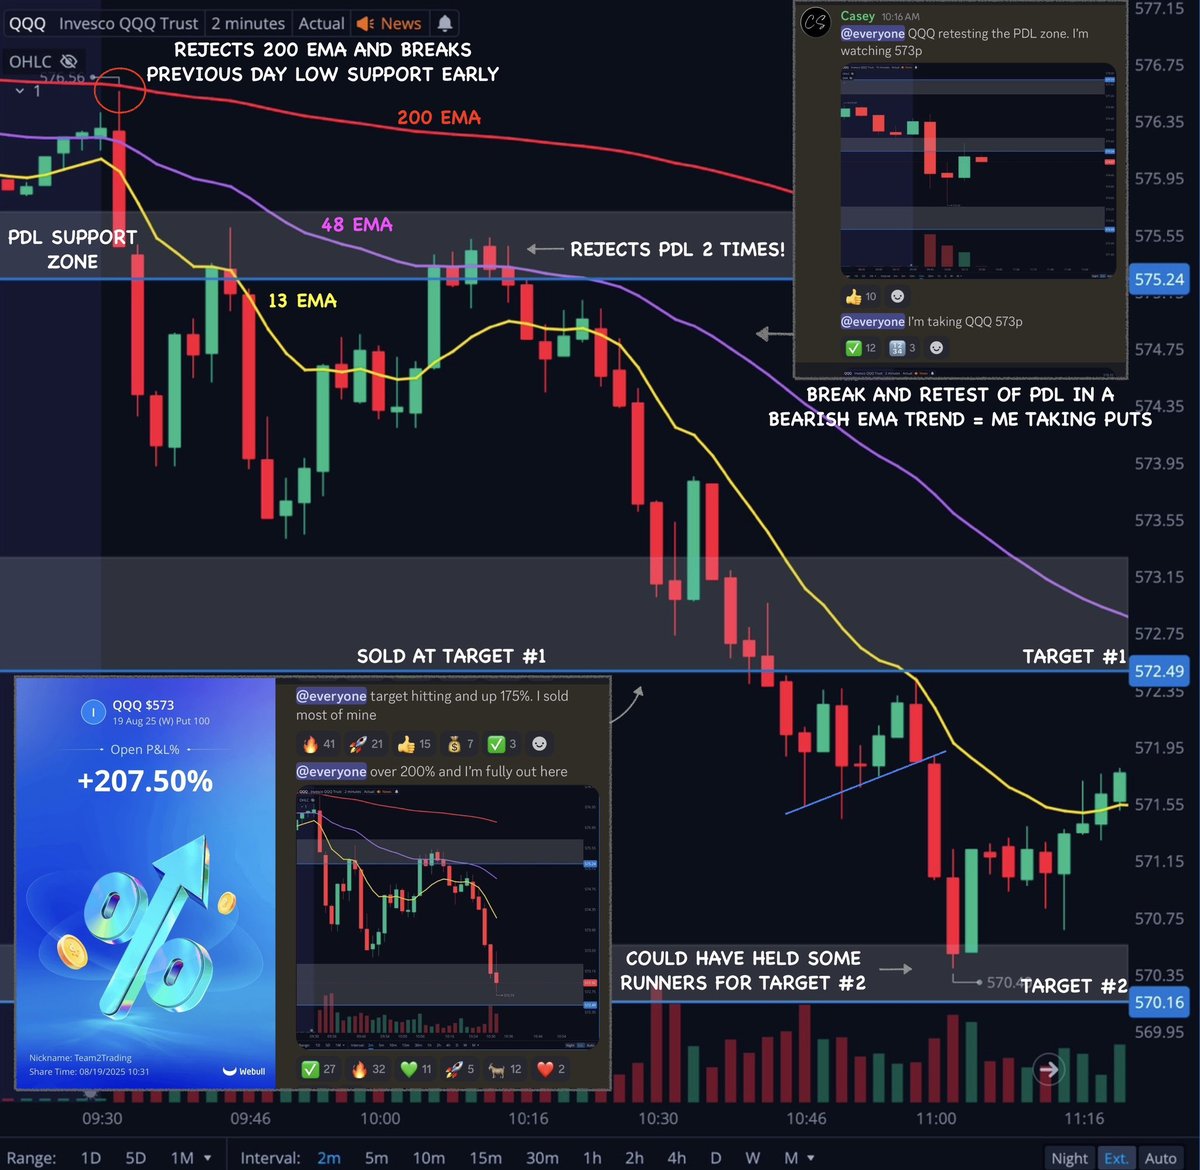
Here is an example of what I am looking at on the 2 minute chart with my EMA system.
Again, refer to the guides above. Below PDL in a bearish EMA trend = Full size on puts 👇
Here is an example of what I am looking at on the 2 minute chart with my EMA system.
Again, refer to the guides above. Below PDL in a bearish EMA trend = Full size on puts 👇
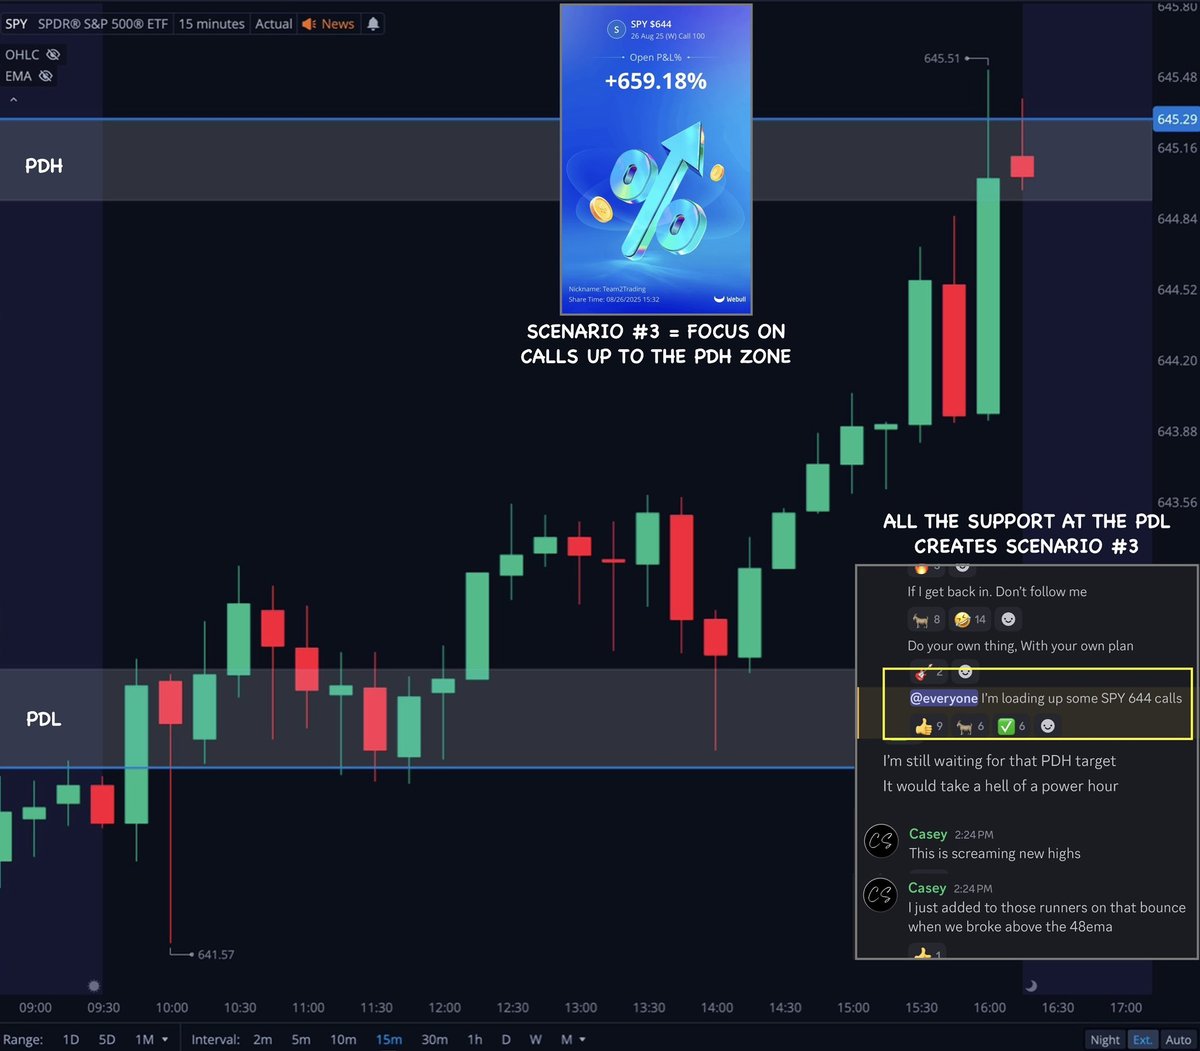
This chart highlights what I am looking for on a day to day basis👇
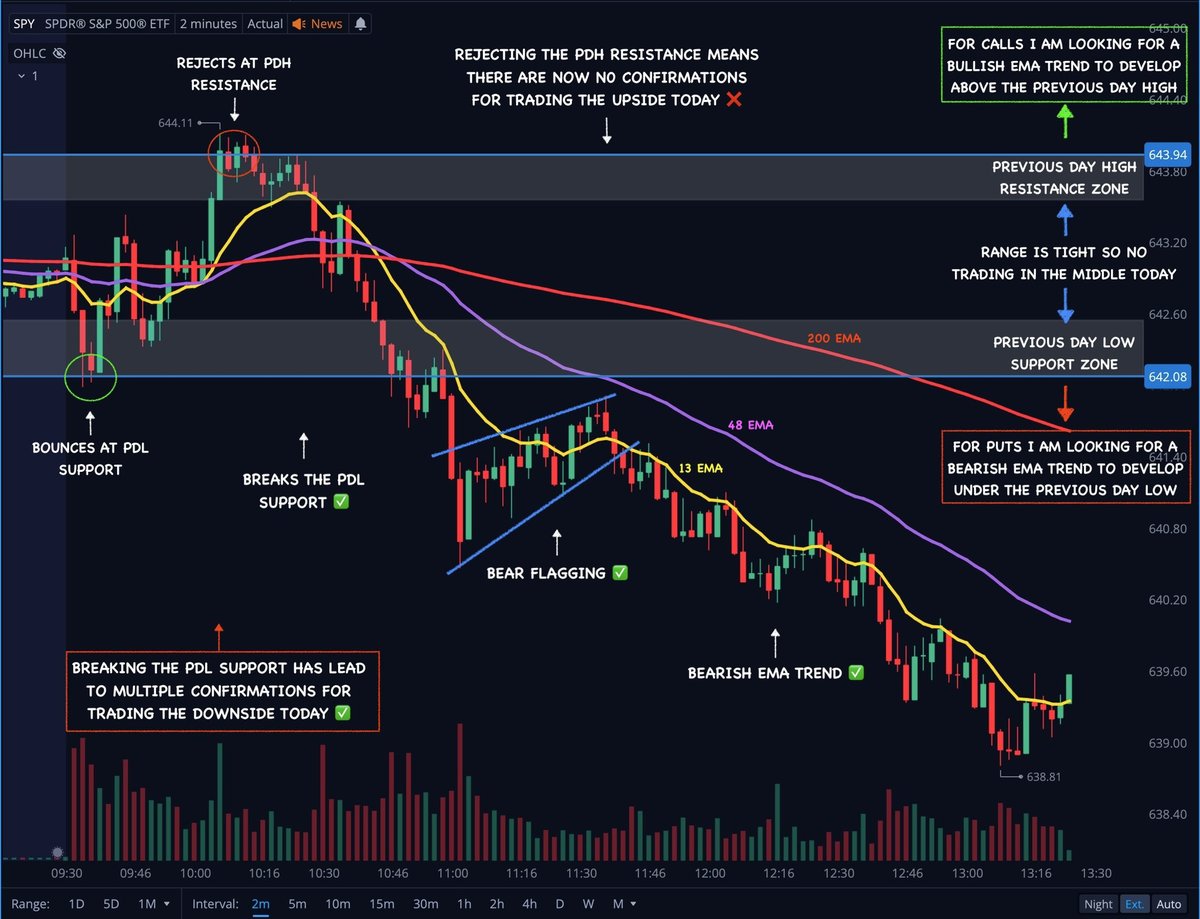
One last directional chart to study before I wrap this up. You'll be amazed at how well this works 👇
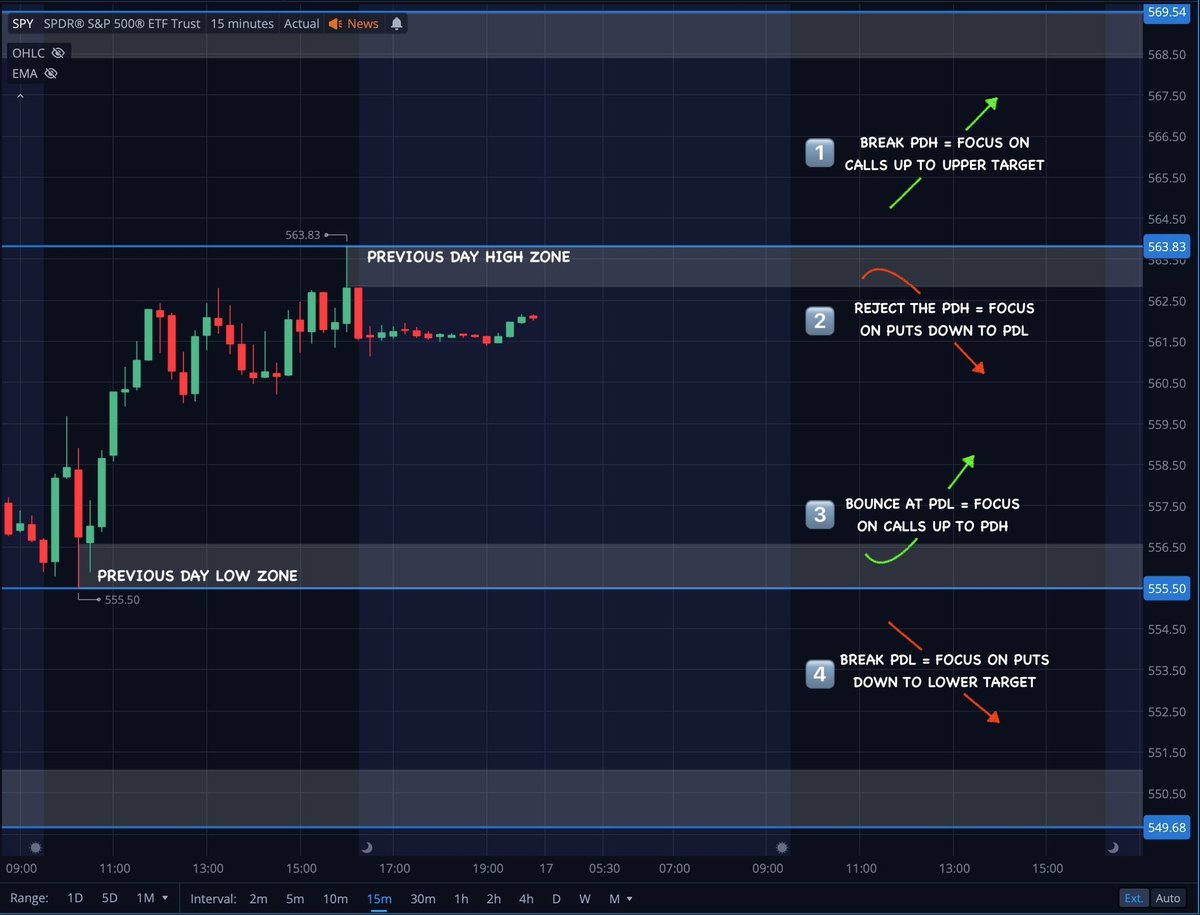
Those are the 4 most common scenarios that play on a day to day basis. Watch the 15 minute chart for them 👇

Alright everyone! Just wanted to post a couple tips that have helped me tremendously in the tough price action these past couple weeks!
Enjoy your holiday weekend! Lets make September one to remember 💚
Enjoy your holiday weekend! Lets make September one to remember 💚
• • •
Missing some Tweet in this thread? You can try to
force a refresh