I'm obsessed with building trading strategies.
I've spent 10,000+ hours testing breakouts, reversals, and trends – This is the most profitable one I've found.
If I were an unprofitable trader, here's the exact strategy I would use to make money trading crypto🧵:
I've spent 10,000+ hours testing breakouts, reversals, and trends – This is the most profitable one I've found.
If I were an unprofitable trader, here's the exact strategy I would use to make money trading crypto🧵:

Most people think they can just Long Support or Short Resistance, and they’ll make money…
But this is NOT a trading strategy.
In this guide, I’ll break down the EXACT steps you need to follow to make money trading this strategy
But this is NOT a trading strategy.
In this guide, I’ll break down the EXACT steps you need to follow to make money trading this strategy
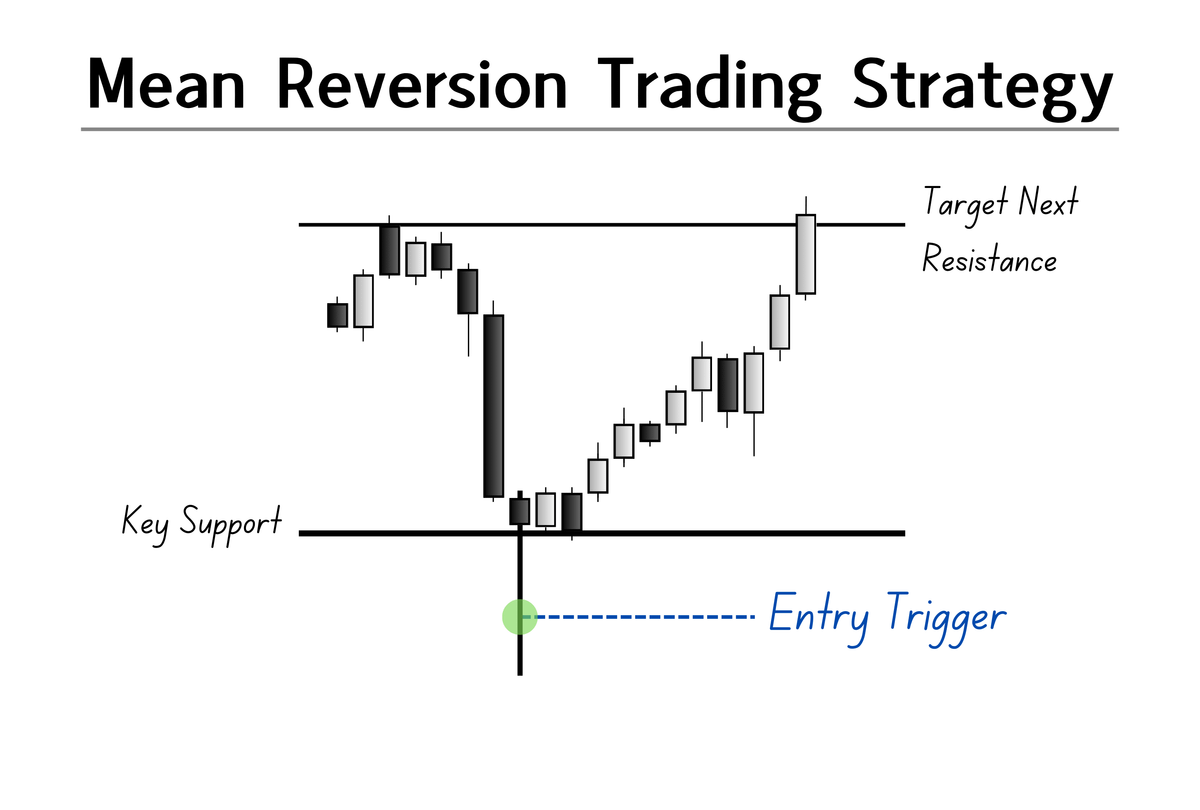
This is my Mean Reversion Strategy.
But to make money from it, you need 4 things:
-Optimal Trading Environment
-Strategy Logic
-Environmental Specifics
-Technical Specifics
Let's start with the first:
But to make money from it, you need 4 things:
-Optimal Trading Environment
-Strategy Logic
-Environmental Specifics
-Technical Specifics
Let's start with the first:
Optimal Trade Environment
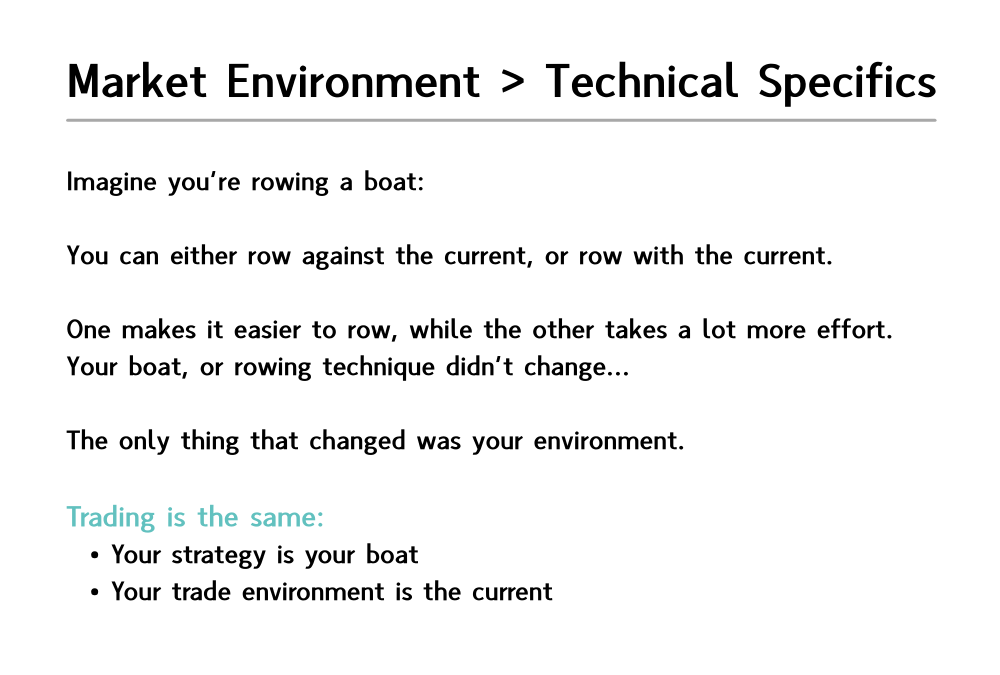
Knowing when to trade is just as important as knowing how to trade.
Every strategy cycles through unprofitable & profitable phases and your job is to trade only in the environments where your strategy is profitable.
Think of it like rowing a boat:
Knowing when to trade is just as important as knowing how to trade.
Every strategy cycles through unprofitable & profitable phases and your job is to trade only in the environments where your strategy is profitable.
Think of it like rowing a boat:
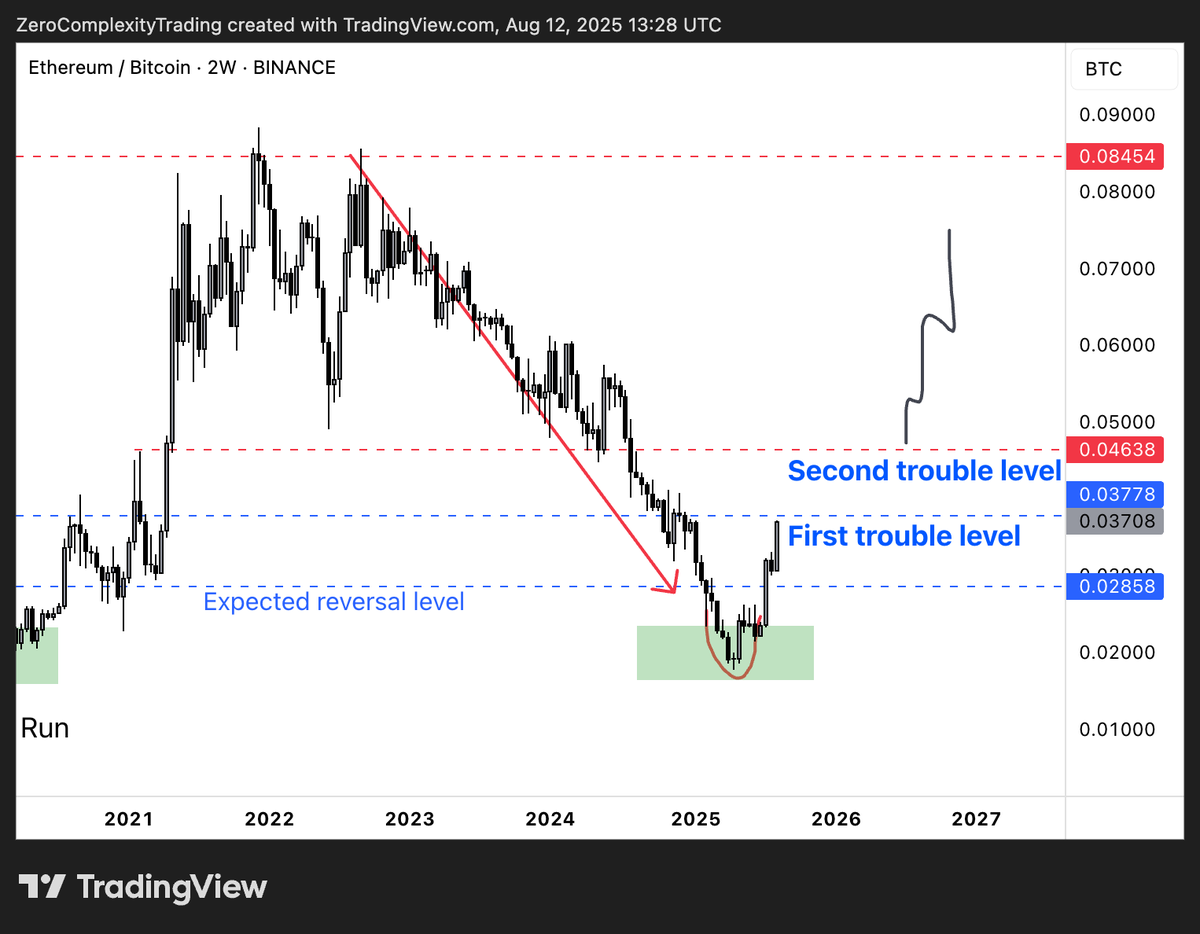
So, what is the right environment for Mean Reversion?
There are 2 criteria:
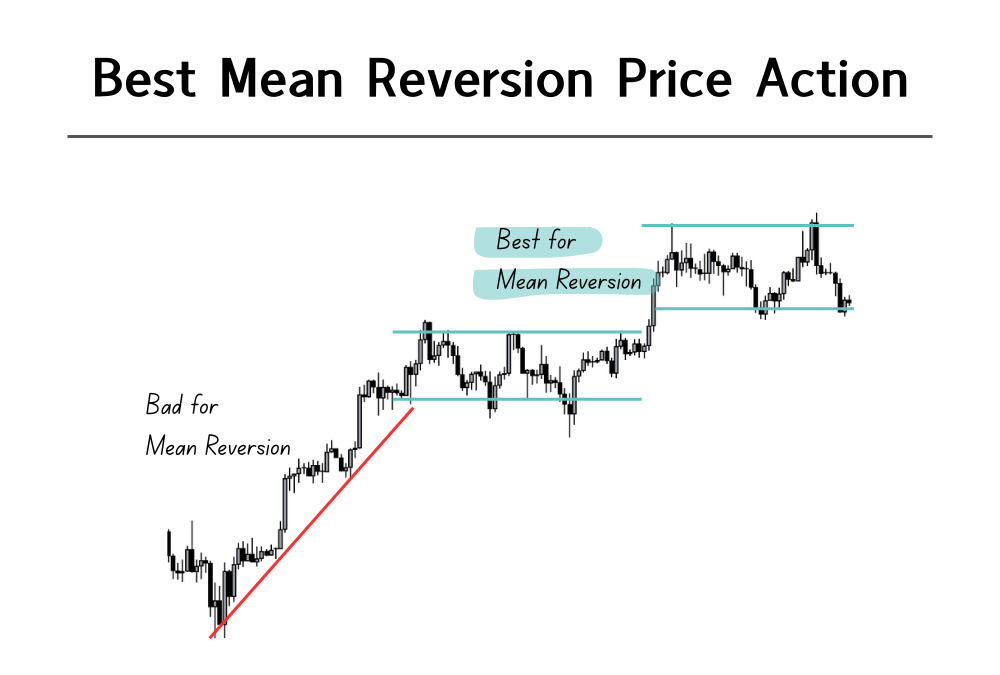
A: Sideways/range-bound/ choppy price action
Price should be moving sideways, rather than trending in a clear direction, for 4-8 hours before reaching your level.
Example:
There are 2 criteria:
A: Sideways/range-bound/ choppy price action
Price should be moving sideways, rather than trending in a clear direction, for 4-8 hours before reaching your level.
Example:
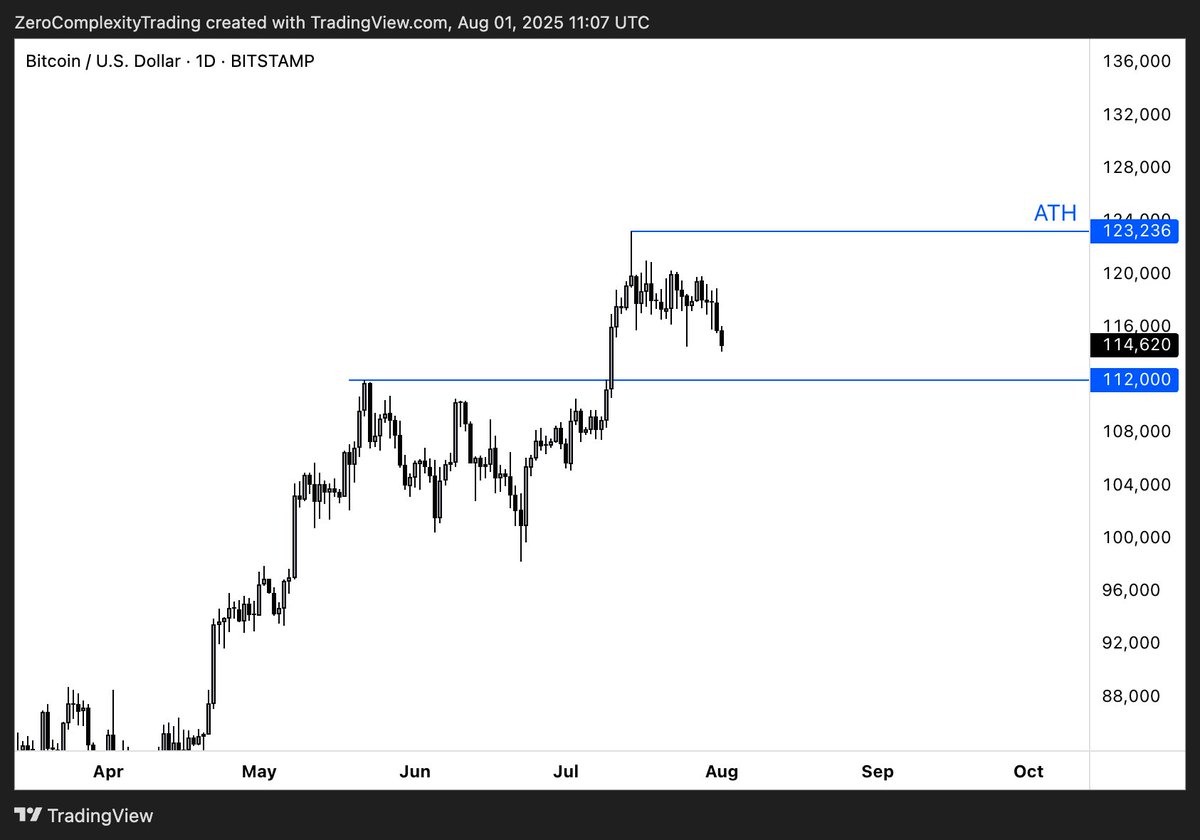
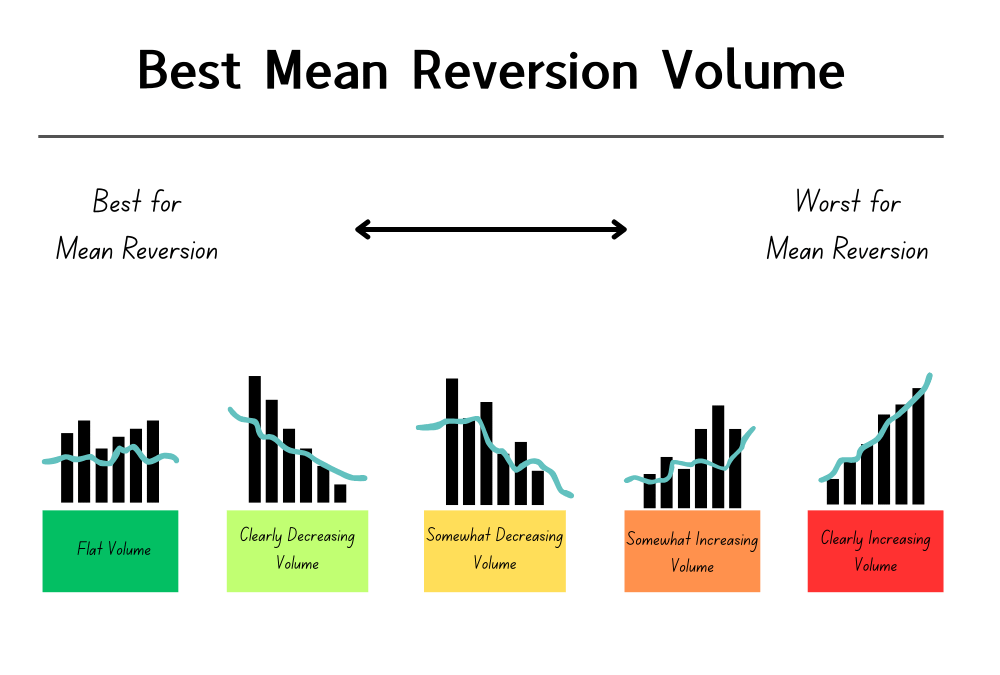
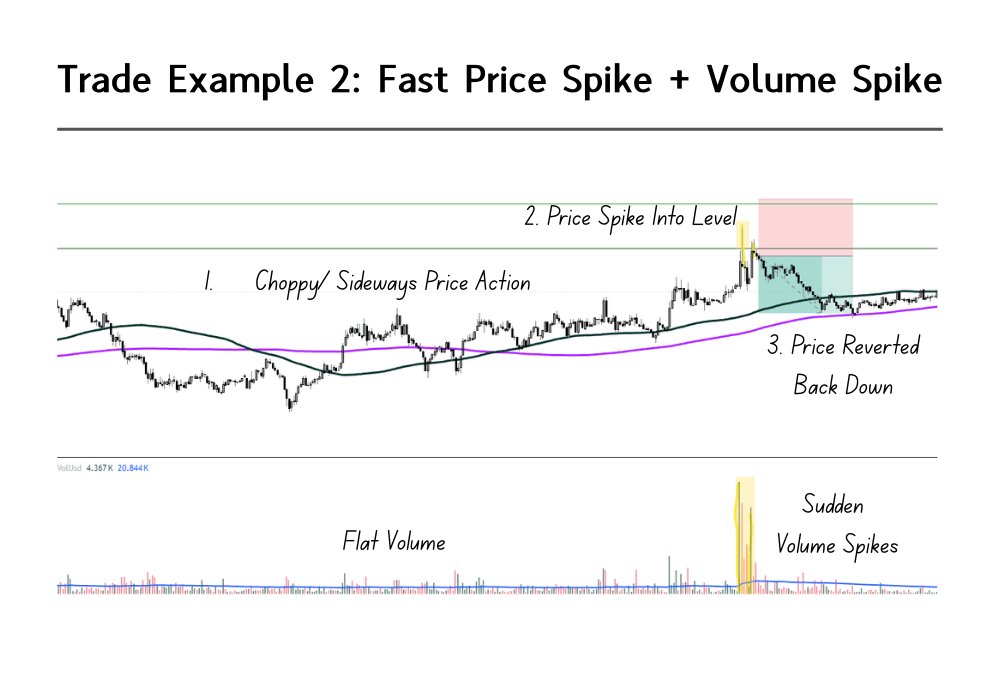
B: Flat or Clearly Decreasing Volume
We use the volume indicator to study the conviction behind a move.
Flat/ Decreasing volume shows fewer traders backing a move. With weaker conviction, the price is more likely to snap back from a level.
Volume example:
We use the volume indicator to study the conviction behind a move.
Flat/ Decreasing volume shows fewer traders backing a move. With weaker conviction, the price is more likely to snap back from a level.
Volume example:
So far, you’ve established the highest-probability environments for Mean Reversion trades.
Now we need to zoom in closer to refine timing our trades and entries.
By the way, if you’re finding this helpful, you can download a full, detailed PDF at the end of this thread (free)
Now we need to zoom in closer to refine timing our trades and entries.
By the way, if you’re finding this helpful, you can download a full, detailed PDF at the end of this thread (free)
After the past 4-8 hours of price and volume align,
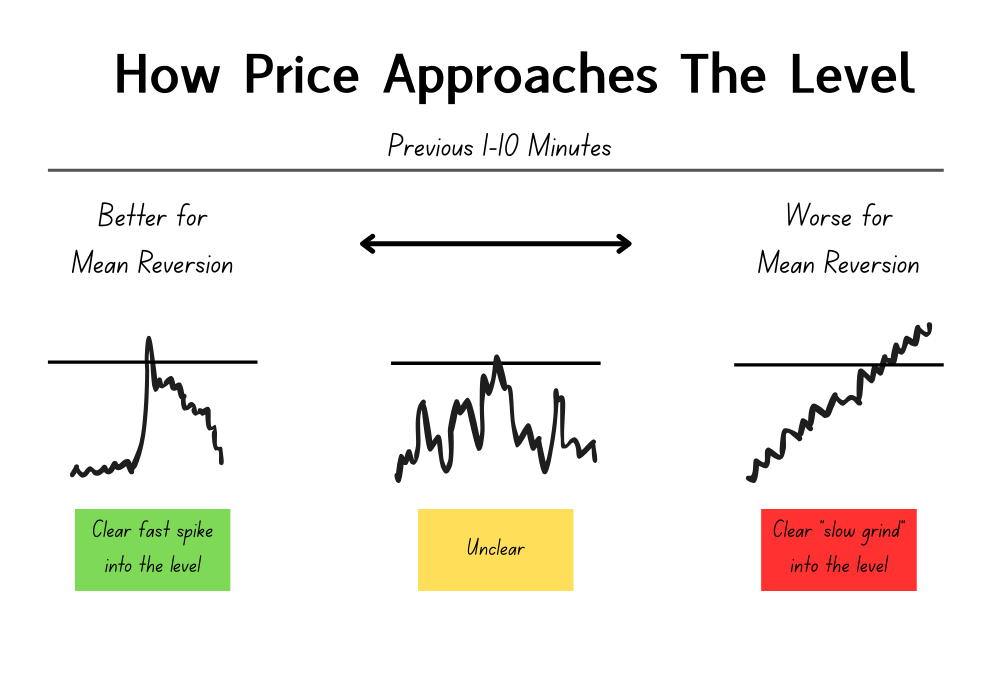
We do an "LHS" Analysis to see how price behaves in the last 1-10 minutes before it reaches your level.
Why?
Because this final filter shows if the move is exhaustive (Good to trade) or has strength to continue (avoid).
We do an "LHS" Analysis to see how price behaves in the last 1-10 minutes before it reaches your level.
Why?
Because this final filter shows if the move is exhaustive (Good to trade) or has strength to continue (avoid).
I've analyzed 600+ trades and found the best LHS environment for mean reversion trades:
A fast spike into the level leads to the highest win rate.
Here's what that looks like:
A fast spike into the level leads to the highest win rate.
Here's what that looks like:
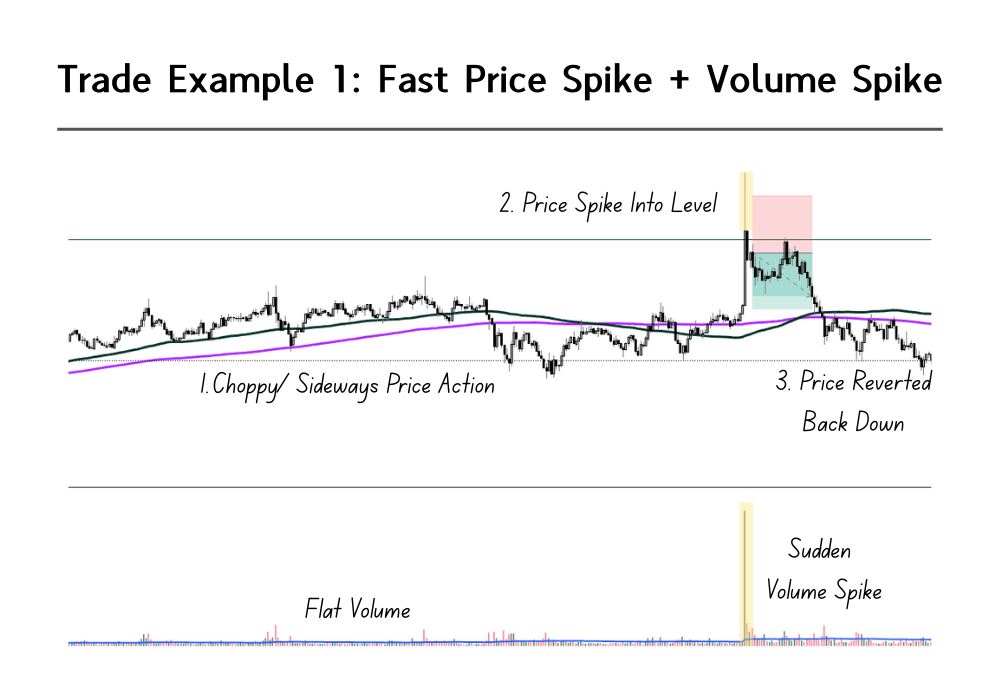
Here are 2 examples of high-quality Mean Reversion setups my trading students have taken.
Both use all the criteria we've covered so far:
But to actually execute these trades, you need one last thing: the Technical Specifics:
Both use all the criteria we've covered so far:
But to actually execute these trades, you need one last thing: the Technical Specifics:
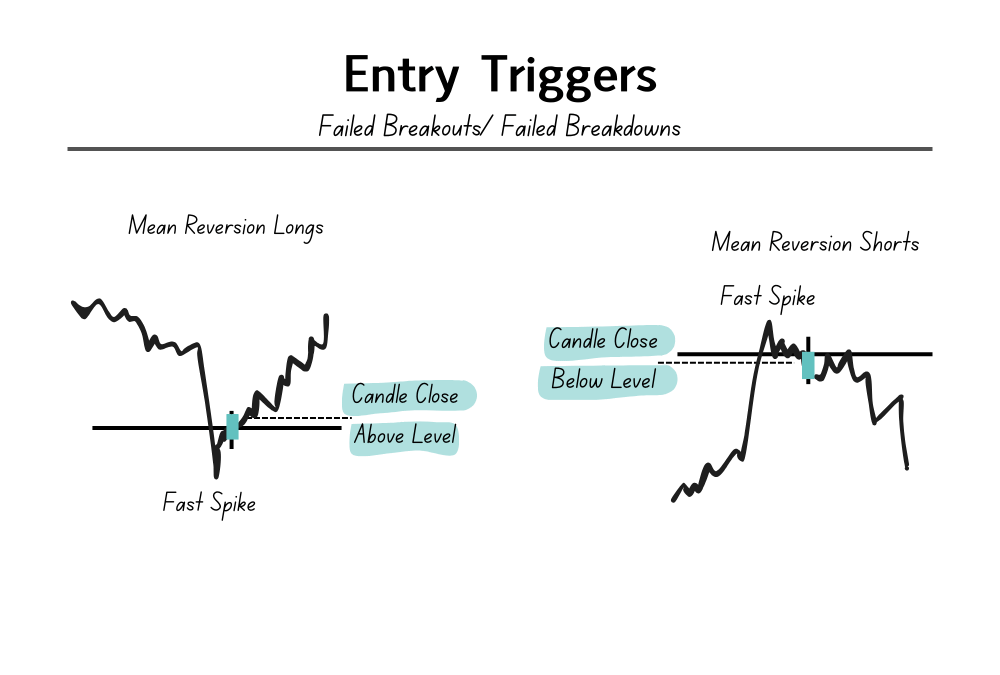
Start by setting key support and resistance levels and defining your entry triggers.
A trigger you can start with is a fast spike into the level, followed by 1 candle close over the level.
For take profit, keep it simple: Target 1R until you’ve logged 30-50 trades.
A trigger you can start with is a fast spike into the level, followed by 1 candle close over the level.
For take profit, keep it simple: Target 1R until you’ve logged 30-50 trades.
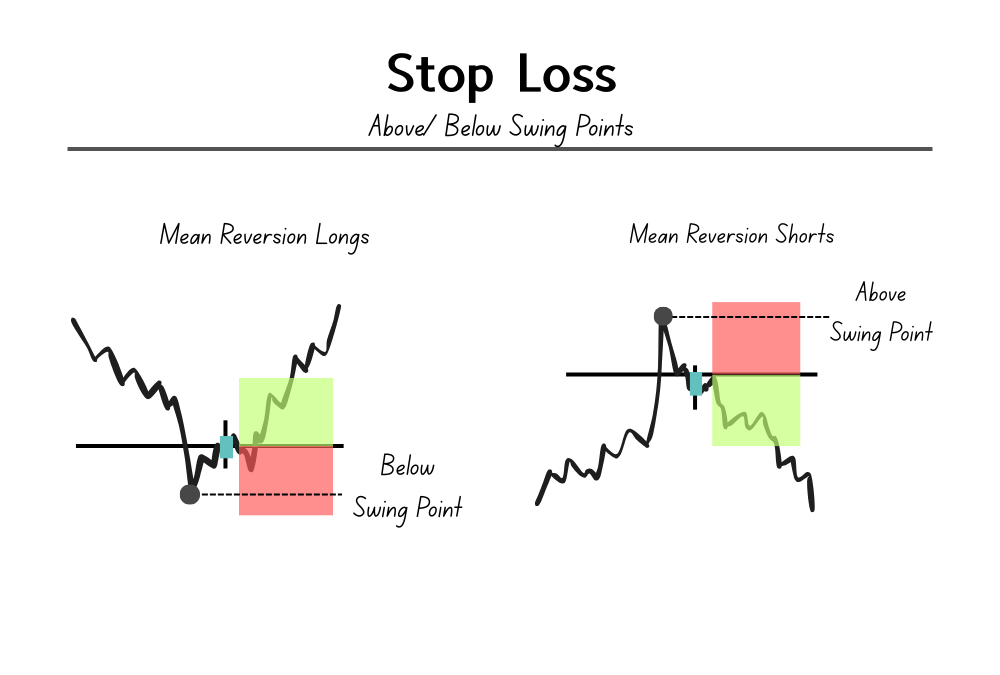
Place your stop loss outside the swing point (fast spike) to keep your invalidation clear.
Start with small risk (0.5–1.5% per trade) until you find the A+ setups you can risk more on.
Remember: The exact technicals don’t matter. Simply follow your rules consistently and improve with data from your journal.
Start with small risk (0.5–1.5% per trade) until you find the A+ setups you can risk more on.
Remember: The exact technicals don’t matter. Simply follow your rules consistently and improve with data from your journal.
Next Steps:
Download the full detailed PDF guide for this strategy.
Inside, I've included the journaling process and final touches you need to start making money from this.
Download the full detailed PDF guide for this strategy.
Inside, I've included the journaling process and final touches you need to start making money from this.
Free PDF Download Expires in 24 hours.
Scroll up in my Telegram for your copy (Last chance): go.koroushak.io/telegram
Scroll up in my Telegram for your copy (Last chance): go.koroushak.io/telegram
• • •
Missing some Tweet in this thread? You can try to
force a refresh