Zach Goldberg Profile picture
Sep 25, 2025 12 tweets 5 min read Read on X
1/ I'm delighted to finally share some of the work I've done since joining @fsuigc.

Last month, we published a report about political tolerance based on national survey data (N=1,004) we collected during the summer. In this study, we measure political tolerance as the willingness to interact with or accept people with opposing political views across different relational contexts. For comparison, we also measured tolerance towards ex-felons and flat earthers.
2/ As shown in the table below, across all contexts, people are much more willing to engage with people with opposing political views than the other two target groups. Regardless of the target group, though, openness tends to decline as the intimacy of an engagement increases. For instance, whereas 73% would engage in a social/recreational activity with political opponents (ex-Felon: 54%, flat-earther: 49%) without reservation, just 41% would be willing to date them (ex-Felon: 22%, flat-earther: 19%)Image
3/Consistent with this intimacy 'gradient', our analysis finds that our 7 tolerance items best fit a 3-factor structure, which is depicted in the table below. Image
4/The graph below visualizes the average sample-level scores on each tolerance factor, which reveal the same general pattern observed in the individual items. Image
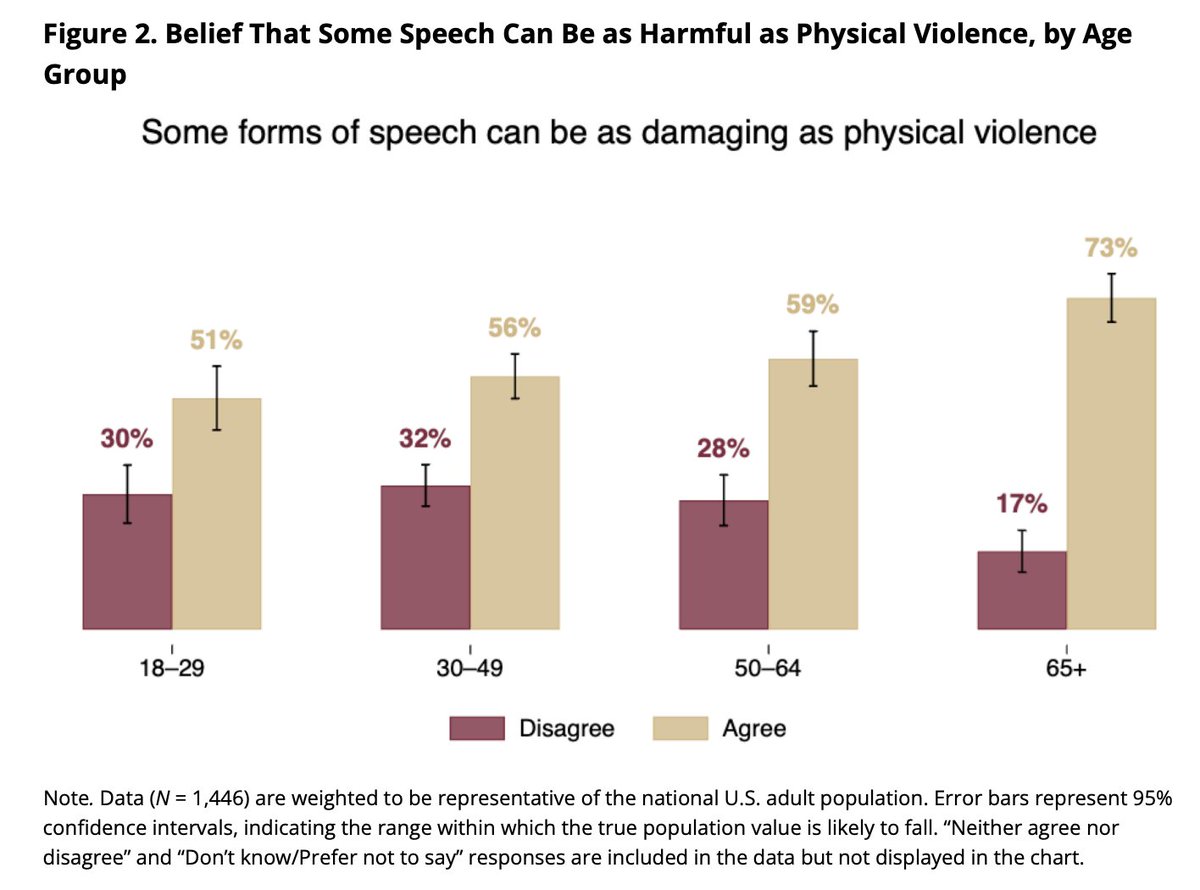
5/ Somewhat surprisingly, we observe only small and inconsistent differences in each factor by age group. One notable exception emerges, though, when we further disaggregate the results by sex. Image
6/As shown below, women overall were generally more reluctant than men to date people from each target group. However, young (and especially unmarried) women (18-29) stand out as most resistant to dating people with opposing political views. Image
7/ Specifically, 42% of unmarried young women say they would not—and just 27% say they would—date someone with opposing political views as compared to 16% of unmarried young men (52% of whom are willing) and 32% of older unmarried women. Image
8/As it happens, when further broken down by ideological orientation, we observe some evidence that young unmarried female liberal respondents disproportionately drive the difference.
For instance, 64% of young liberal women are opposed and just 12% are willing to date across political lines––rates that are higher and lower, respectively, than any other group (though the small sample sizes for some of these subgroups––e.g. just 15 young male conservative respondents––do warrant some interpretive caution).Image
9/ More generally, ideological orientation emerges as the most potent predictor of tolerance in our data. As shown below, for each factor tolerance tends to fall at the extremes: 'Very Liberal' and 'Very Conservative' respondents are less tolerant than their 'somewhat' and moderate counterparts. With this being said, liberal respondents are, overall, significantly less willing to engage with people of opposing political views than their conservative peers.Image
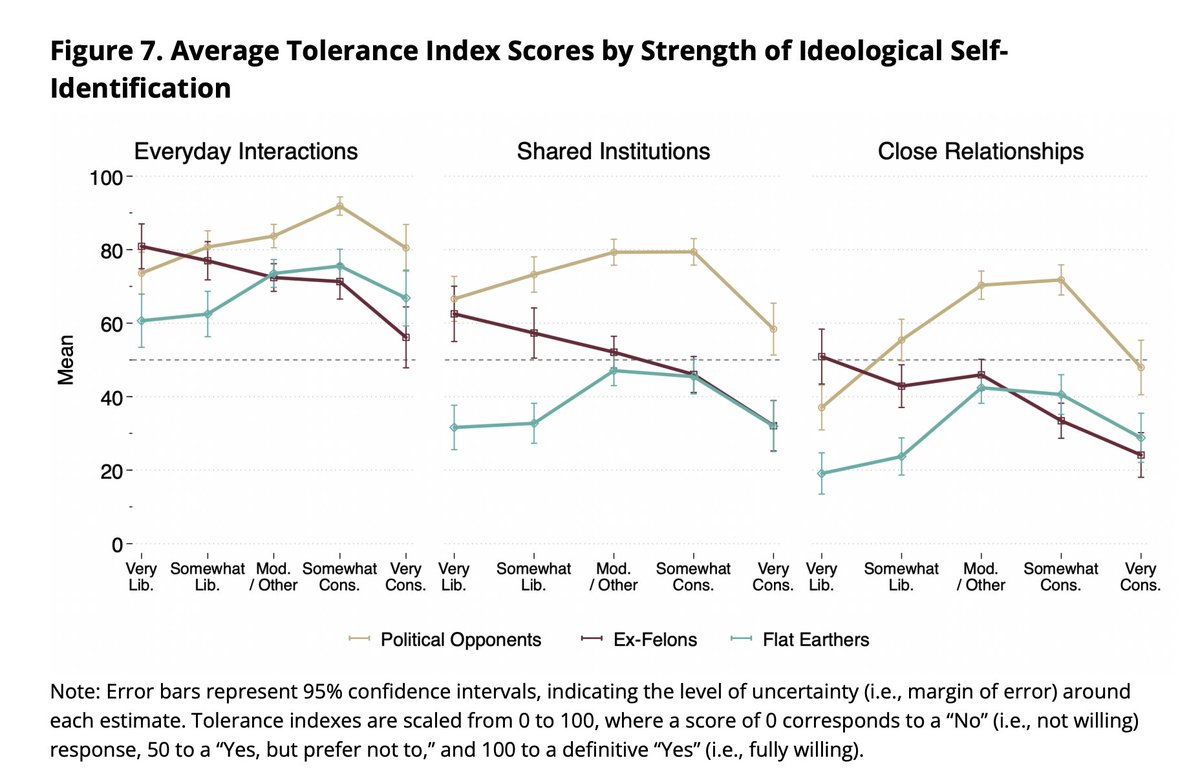
10/ One particularly striking pattern emerges among Very Liberal respondents: they are significantly more willing to engage with ex-felons than political opponents on average, especially when it comes to more intimate contexts.

For example, whereas 29% of very liberals would be willing to date an ex-felon, just 13% would be willing to date someone with opposing political views. Among Very Conservative respondents, the pattern is reversed: 25% say they would date across party lines, while just 10% would date an ex-felon. Fully 67% say they are unwilling to date someone with a criminal history, compared to 46% unwilling to date across political lines.Image
11/ The fact that political identity now rivals or even exceeds traditional social stigmas (like a criminal record) in shaping personal decisions points to the depth of polarization in American life. These divisions don’t just affect how people vote or debate online—they shape who they trust, who they befriend, and who they welcome into their families.
12/12 As we further discuss in our report—which I link below—the implications here likely extend beyond politics. In an era of rising loneliness, declining marriage rates, and increasing polarization, political selectivity—especially in dating—may quietly be narrowing social networks, reducing opportunities for connection, and shaping the next generation’s political landscape.

igc.fsu.edu/sites/g/files/…

• • •

Missing some Tweet in this thread? You can try to force a refresh
 

Keep Current with Zach Goldberg

Zach Goldberg Profile picture

Stay in touch and get notified when new unrolls are available from this author!

Read all threads

This Thread may be Removed Anytime!

PDF

Twitter may remove this content at anytime! Save it as PDF for later use!

Try unrolling a thread yourself!

how to unroll video
  1. Follow @ThreadReaderApp to mention us!

  2. From a Twitter thread mention us with a keyword "unroll"
@threadreaderapp unroll

Practice here first or read more on our help page!

More from @ZachG932

Jun 3
1/10

Do Americans broadly oppose military action against Iran?

Recent polling suggests they do. A Reuters/Ipsos survey conducted May 15–18 found that 61% of Americans disapproved of U.S. military strikes against Iran, while 52% said the military action was not worth it.

But generic approval questions may not tell the whole story.
2/10

Our latest @fsuigc survey of 1,059 American adults (also conducted by Ipsos, May 19–28) approached the issue differently.

Instead of asking simply whether military action was “worth it,” we examined how Americans think about the tradeoffs involved—including the perceived threat posed by Iran, the prospects for diplomacy, and the costs people are willing to bear to prevent Iran from obtaining nuclear weapons.

The results paint a considerably more nuanced picture.

A short thread: 👇
3/10

First, baseline attitudes are hawkish on the Iranian nuclear threat itself:

58% of Americans—including 72% of Republicans and 46% of Democrats— say a nuclear-armed Iran would be a Very or Extremely serious long-term threat to the U.S. and its allies.

Only 12% say it’s “not too serious” or “not at all serious.”Image
Image
Read 10 tweets
Nov 19, 2025
1/Thrilled to share @fsuigc’s latest report, based on a national survey of 1,447 U.S. adults we conducted in late September—one week after the assassination of Charlie Kirk.

We examine how Americans think about harmful speech and whether physical violence can ever be justified to stop its public expression.

Link to report: igc.fsu.edu/research-data/…

What follows is a summary of key findings.
2/ First: nearly 60% Americans at least somewhat agree that “certain forms of speech can be as damaging as physical violence” Image
3/ But contrary to popular narratives, it’s older Americans—not Gen Z—who are most likely to agree.

-73% of seniors agree, 17% disagree

-51% of adults under 30 agree, 30% disagree

Note: Young adults are the most likely to choose a neutral position.Image
Read 15 tweets
May 30, 2025
1/ Updated racial ingroup vs. outgroup feeling thermometer differentials from the ANES. In sum, while the 'curve has flattened', the attitudinal effects of the Great Awokening persist (at least wrt race). If you thought or hoped otherwise, sorry to disappoint. Image
2/ Average of all 3 differentials by race/ideological self-placement Image
3/ Averages for whites across the complete 7-point ideology scale Image
Read 9 tweets
May 22, 2025
1/ Needless to say, the recent surge in New York Times articles pairing the word "genocide" with "Israel" is driven by the war in Gaza.

But it would be wrong to single out the Times.

The same pattern shows up across every other outlet I looked at.

Image
2/ In fact, coverage linking Israel to “genocide” now exceeds that of every actual or widely recognized genocide of the last 40 years, including:

Rwanda (1994)

Darfur (2003–2008)

Bosnia (Srebrenica, 1995)

Myanmar (Rohingya, 2017–Present)

Yazidis (ISIS, 2014–2017)
3/ In The New York Times, for example, the spike in 2023–2024 mentions of “genocide” alongside “Israel” is more than 9x larger than the peak for Rwanda in the mid-1990s and nearly 6x the peak for the more recent Darfur genocide.
Read 9 tweets
May 2, 2025
1/ One of the more counterintuitive findings in my latest article:

Historically, when Democrats only control the House, an average of just over 10 race-conscious provisions are added to the NDAA per year.

When they control both the House and Senate? That number drops to about 4.
But why?Image
2/ First, what makes the House so powerful here?

Simple: the House Armed Services Committee (HASC) writes the first draft of the NDAA.

If you control the House, you control the blueprint—and the early language that often survives reconciliation. That’s where ideological riders get embedded.
3/But why are more race-conscious provisions added under divided government?

While I can’t say for sure, my reasoning is this: when Democrats only control the House, the NDAA becomes one of the few legislative vehicles guaranteed to pass.

Standalone race-conscious or DEI bills are less likely to survive the Senate.

But must-pass defense bills? They will.

So they load them up.
Read 8 tweets
Apr 15, 2025
🚨1/ Just released what may be my most significant project to date:
The first in-depth, data-driven account of how racial preferences actually operated at a U.S. service academy (the U.S. Naval Academy)—and the recent federal court case that challenged them (and lost).

zachgoldberg.substack.com/p/after-harvar…

Published on my Substack, the report draws on thousands of pages of filings, depositions, internal admissions data, and expert reports from Students for Fair Admissions v. USNA—a case that flew under the radar, despite its profound constitutional and institutional stakes.
2/ The full report runs ~115 pages—so there’s a lot to unpack. Too much for a single thread.

Thus, over the coming days, I’ll be posting a series of threads, each walking through key sections.

Note that these threads are high-level summaries—many important details are left out. I strongly encourage reading the full report for the complete picture.

Here’s the outline for this series of threads:

Thread 1 (this one): What the internal data reveal about USNA’s use of race—and how the Academy tried (and failed) to discredit the revelations.

Thread 2: The government’s sweeping (and evidence-free) justification for race-based admissions—and why it collapses under scrutiny.

Thread 3: How a federal judge upheld the policy—and why his ruling still matters, even after Trump’s executive order rescinded the policy.

Thread 4: What can be done to permanently outlaw race-based admissions at the service academies—or at least make it far harder for future administrations to reinstate them.
3/ Thread #1: What the Data Reveal

Like Harvard, USNA didn’t deny using race in admissions. It simply described it as “limited” and non-determinative.

At the same time, USNA admitted it never even attempted to measure race’s impact on outcomes—begging the question: how can it call race a “limited” factor if it never quantified its effect?
Read 28 tweets

Did Thread Reader help you today?

Support us! We are indie developers!


This site is made by just two indie developers on a laptop doing marketing, support and development! Read more about the story.

Become a Premium Member ($3/month or $30/year) and get exclusive features!

Become Premium

Don't want to be a Premium member but still want to support us?

Make a small donation by buying us coffee ($5) or help with server cost ($10)

Donate via Paypal

Or Donate anonymously using crypto!

Ethereum

0xfe58350B80634f60Fa6Dc149a72b4DFbc17D341E copy

Bitcoin

3ATGMxNzCUFzxpMCHL5sWSt4DVtS8UqXpi copy

Thank you for your support!

Follow Us!

:(