I trade $SPY for a living.
I've posted my exact entry on 32 trades over the past month (in real time) with an 84%+ hit rate.
Here's a thread breaking down the strategy i used to achieve that 🧵
I've posted my exact entry on 32 trades over the past month (in real time) with an 84%+ hit rate.
Here's a thread breaking down the strategy i used to achieve that 🧵
I'm about to go over a few of the key techniques I use every single day!
~Identifying areas of Support & Resistance
~Identifying momentum (Bullish vs Bearish trends)
~Identifying basic chart patterns
By the end you should have a good understanding of what I am looking for in a high quality area to trade👇
~Identifying areas of Support & Resistance
~Identifying momentum (Bullish vs Bearish trends)
~Identifying basic chart patterns
By the end you should have a good understanding of what I am looking for in a high quality area to trade👇


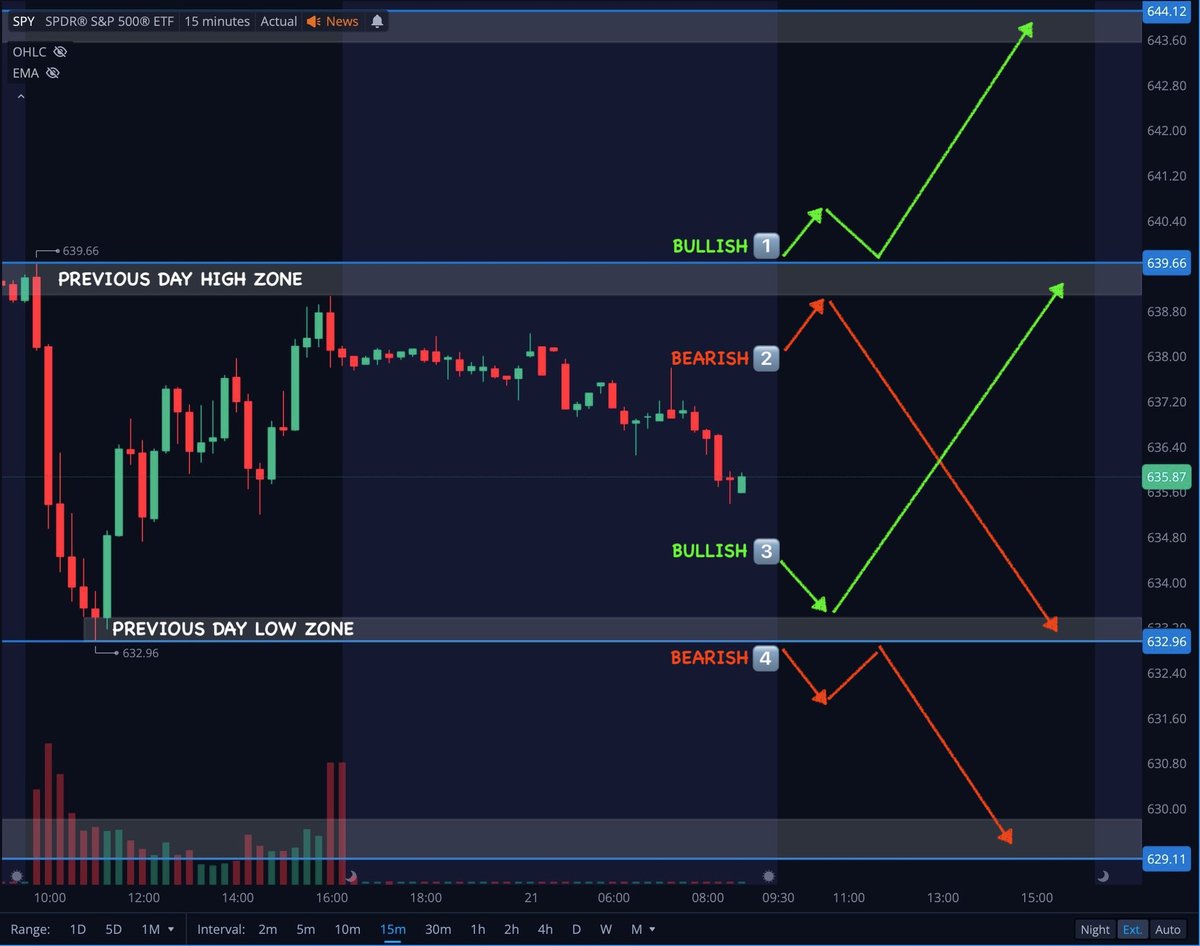
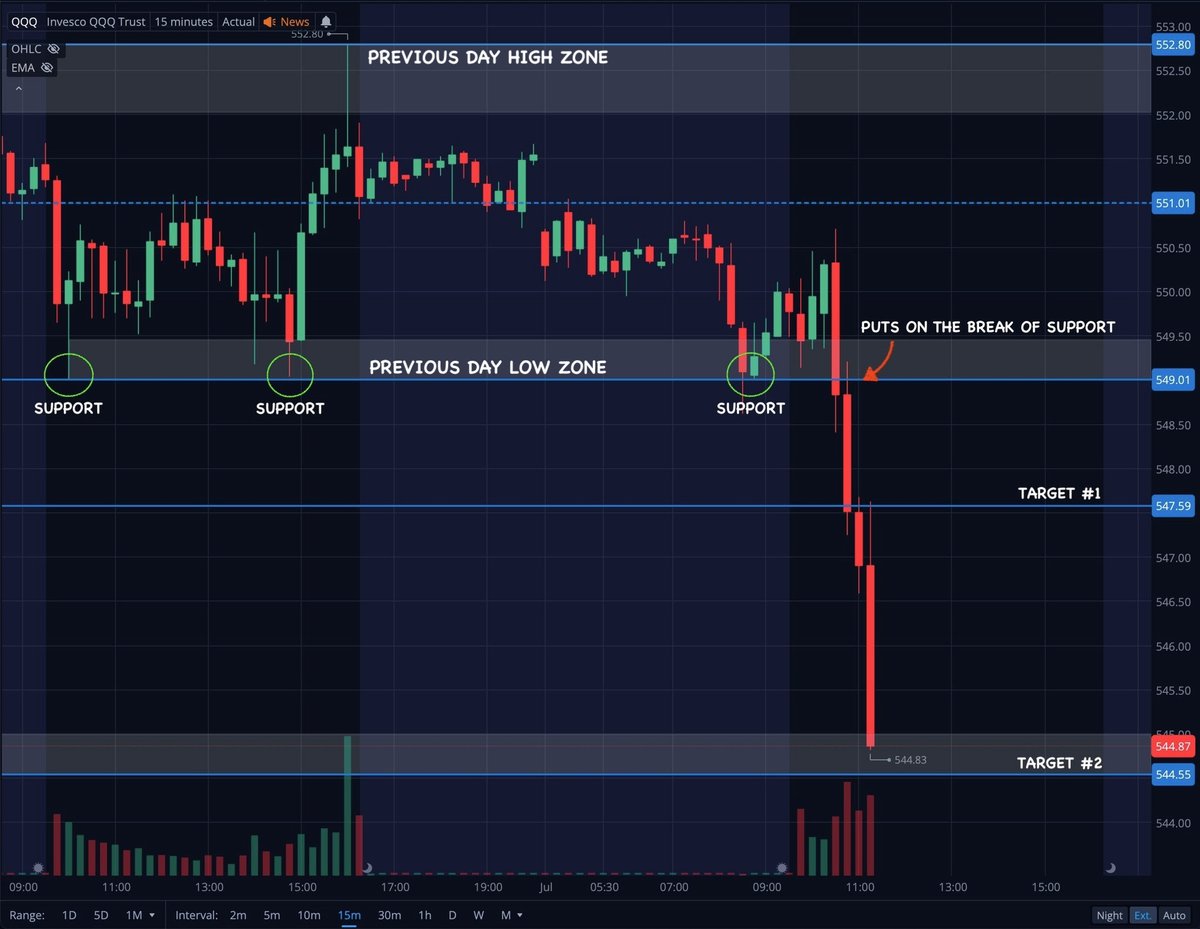
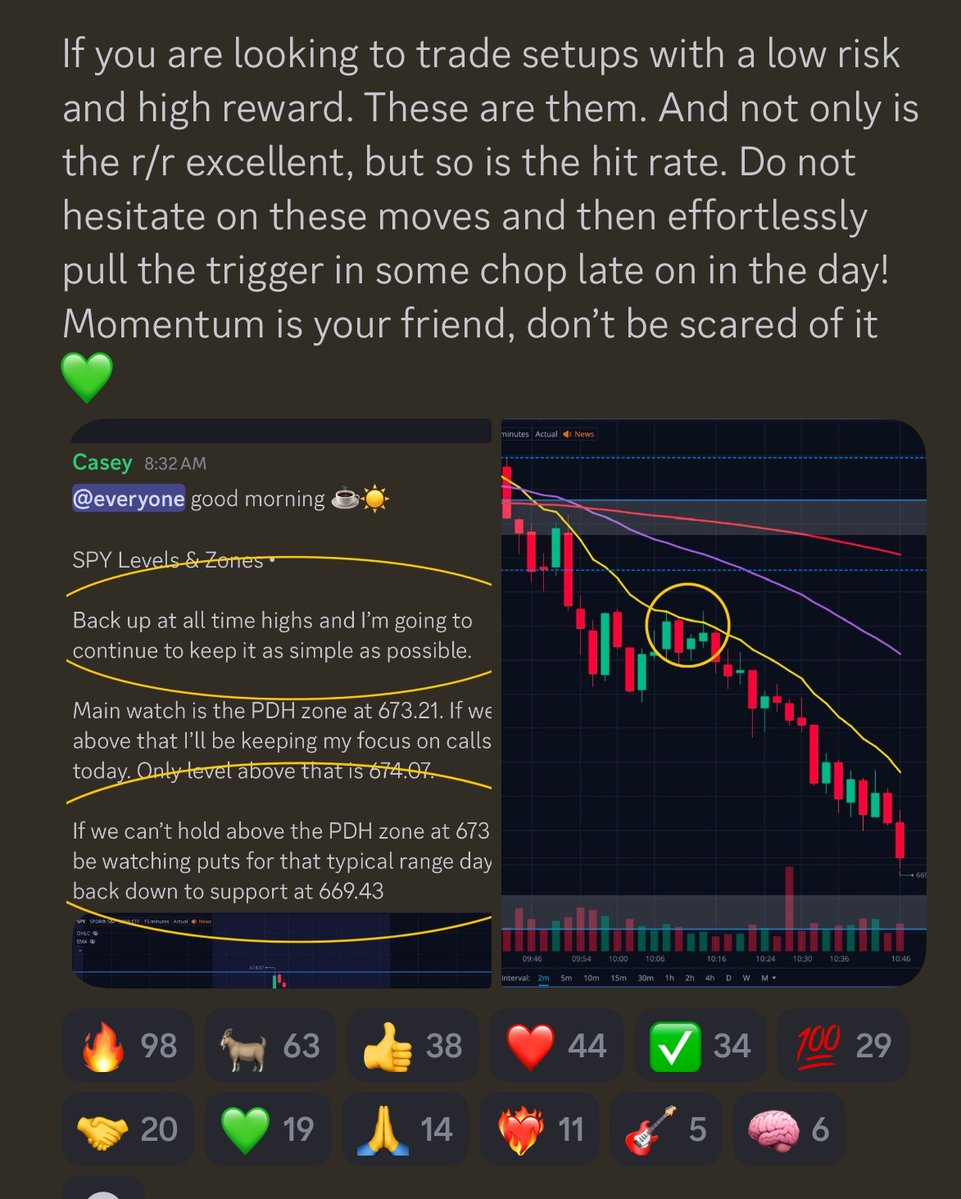
Identifying Support & Resistance
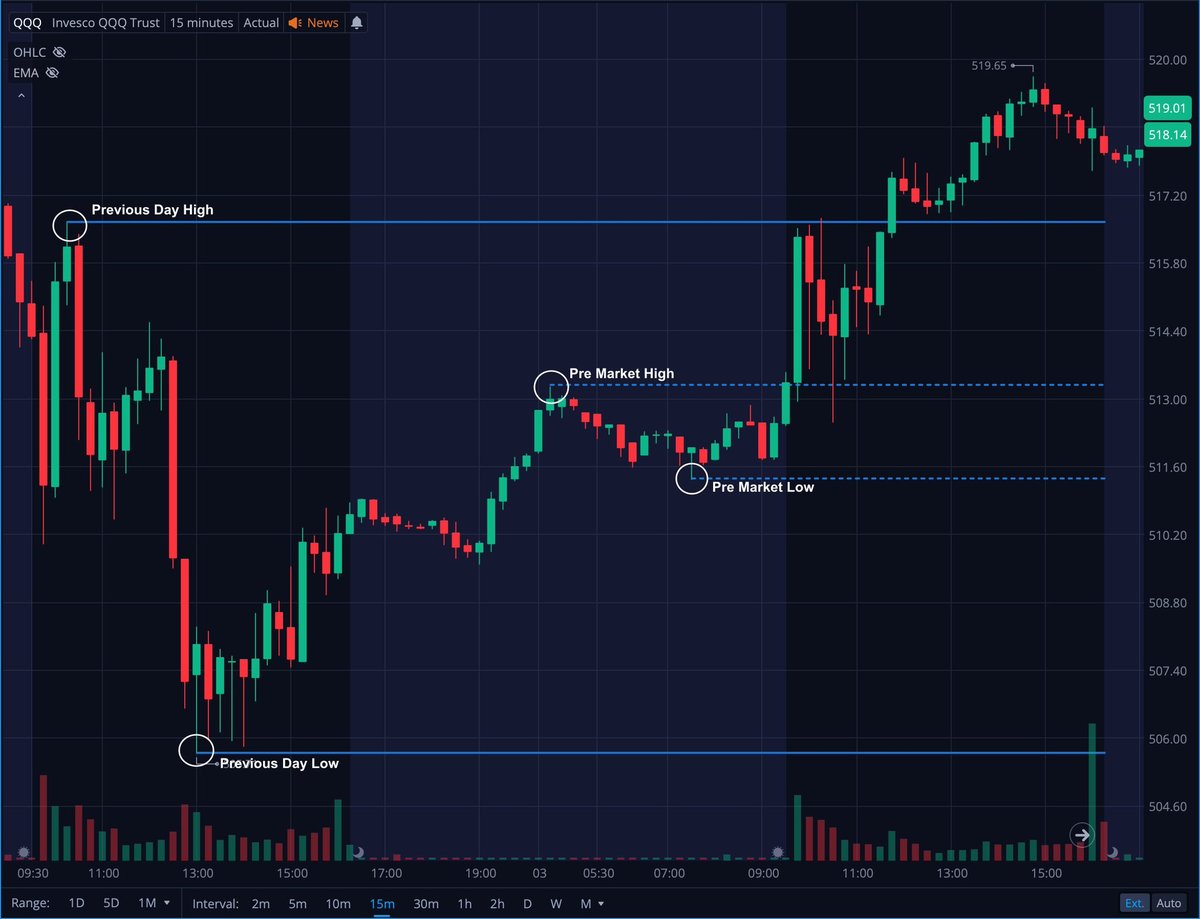
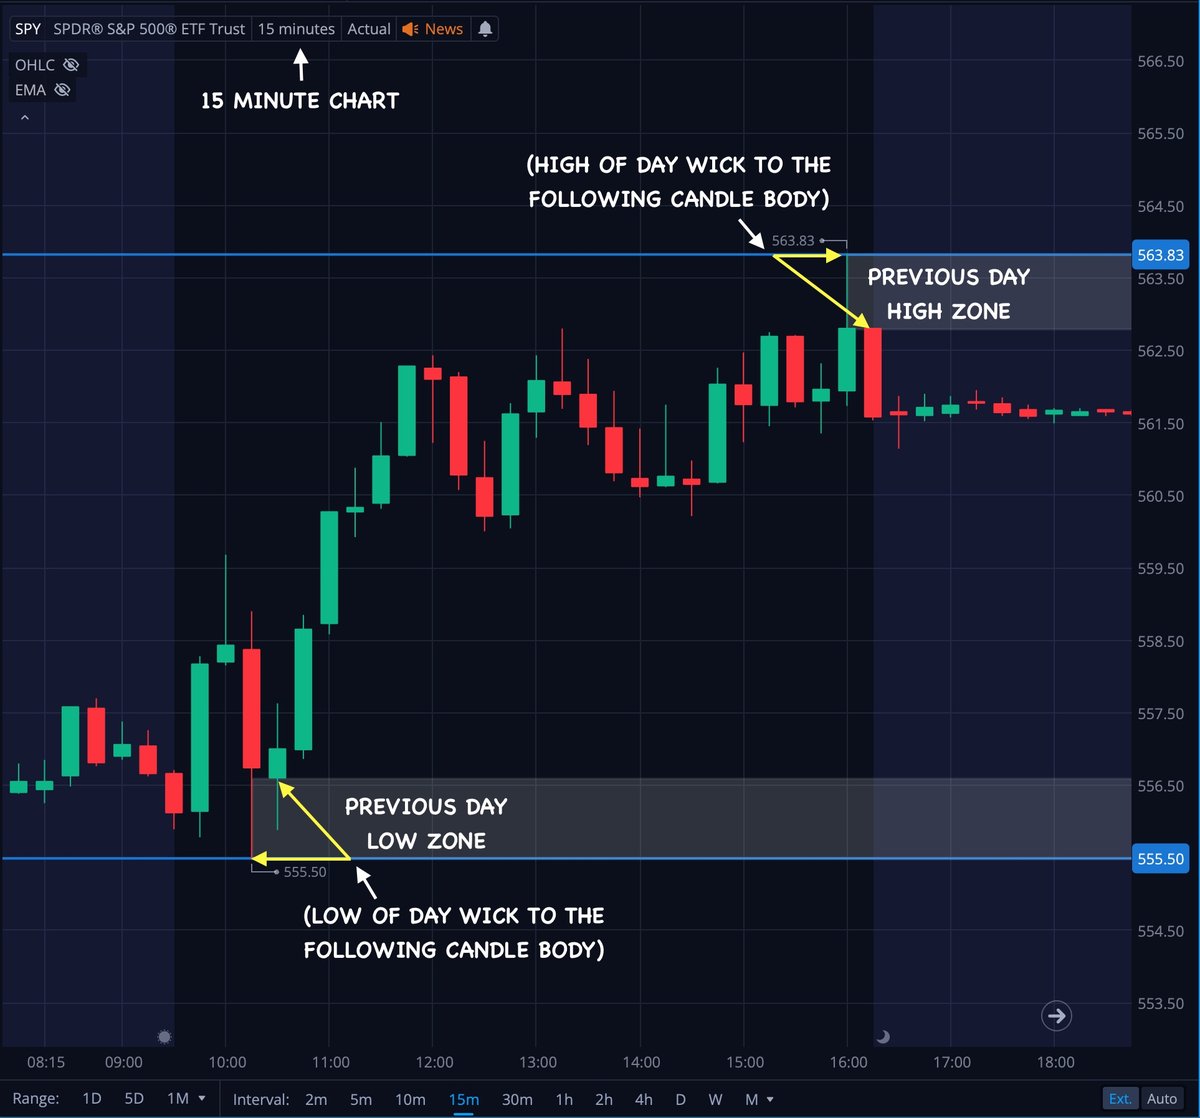
I start by marking the Previous Day High & Low Zones before the market opens...
I use the 15 minute chart and make a small zone from high / low of day wick to the following candle body.
This gives me 4 scenarios to watch that day 👇
I start by marking the Previous Day High & Low Zones before the market opens...
I use the 15 minute chart and make a small zone from high / low of day wick to the following candle body.
This gives me 4 scenarios to watch that day 👇

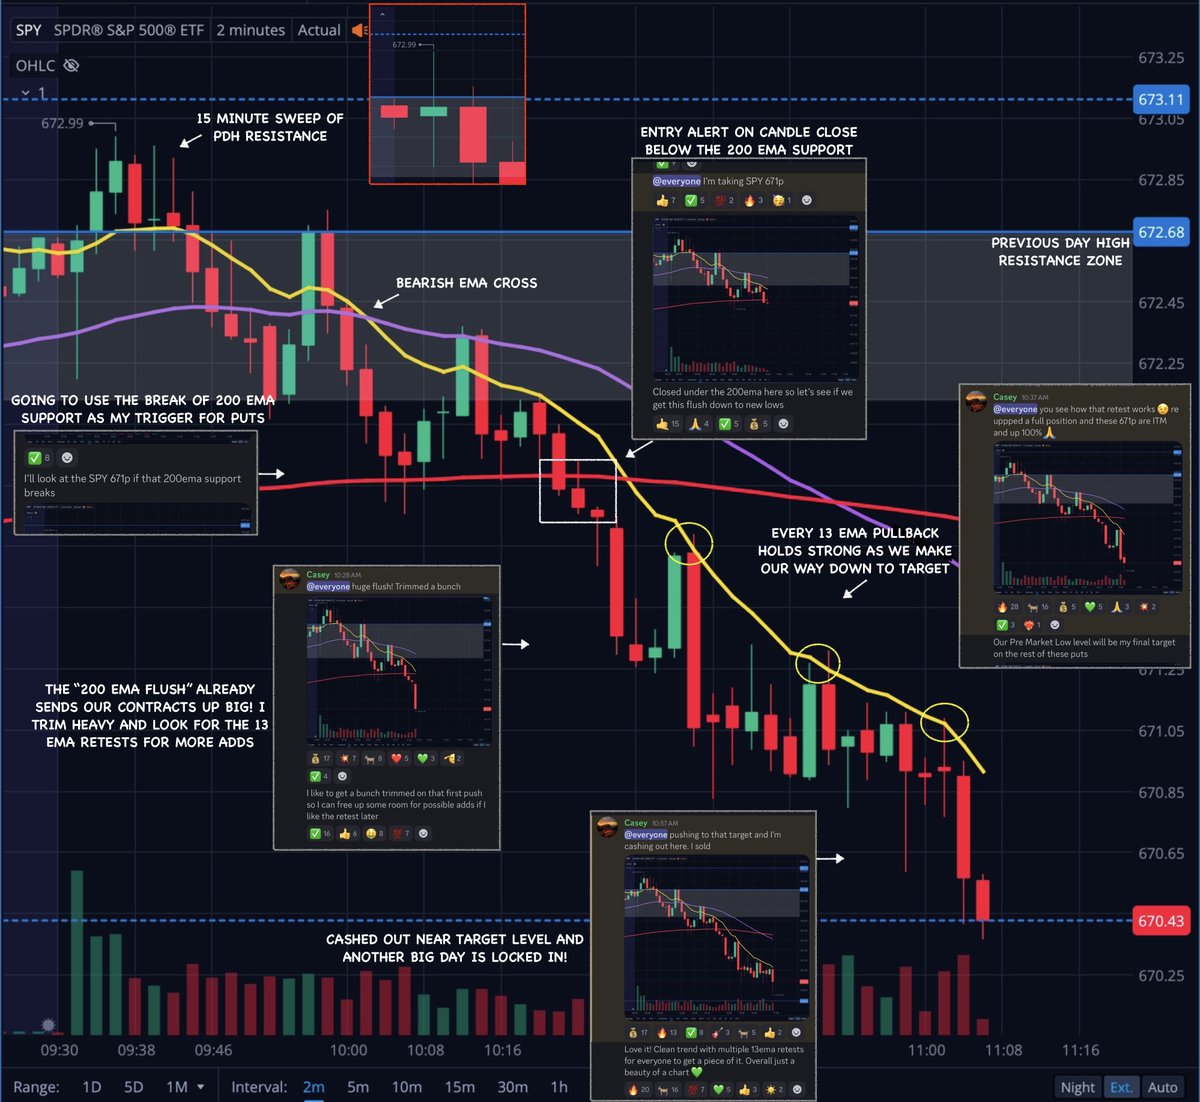
Scenario #1 ~ Price breaks above the Previous Day High Resistance Zone.
This is a Bullish scenario. When this happens I am keeping my focus on calls / upside as long we hold above that PDH zone 👇
This is a Bullish scenario. When this happens I am keeping my focus on calls / upside as long we hold above that PDH zone 👇
Scenario #2 ~ Price rejects the Previous Day High Resistance Zone.
This is a Bearish scenario. When this happens I keep my focus on puts / downside and typically target a move back to the Previous Day Low support zone 👇
This is a Bearish scenario. When this happens I keep my focus on puts / downside and typically target a move back to the Previous Day Low support zone 👇
Scenario #3 ~ Price bounces off the Previous Day Low Support Zone.
This is a Bullish scenario. When this happens I am keeping my focus on calls / upside and typically targeting a move back up to the Previous Day High resistance zone 👇
This is a Bullish scenario. When this happens I am keeping my focus on calls / upside and typically targeting a move back up to the Previous Day High resistance zone 👇
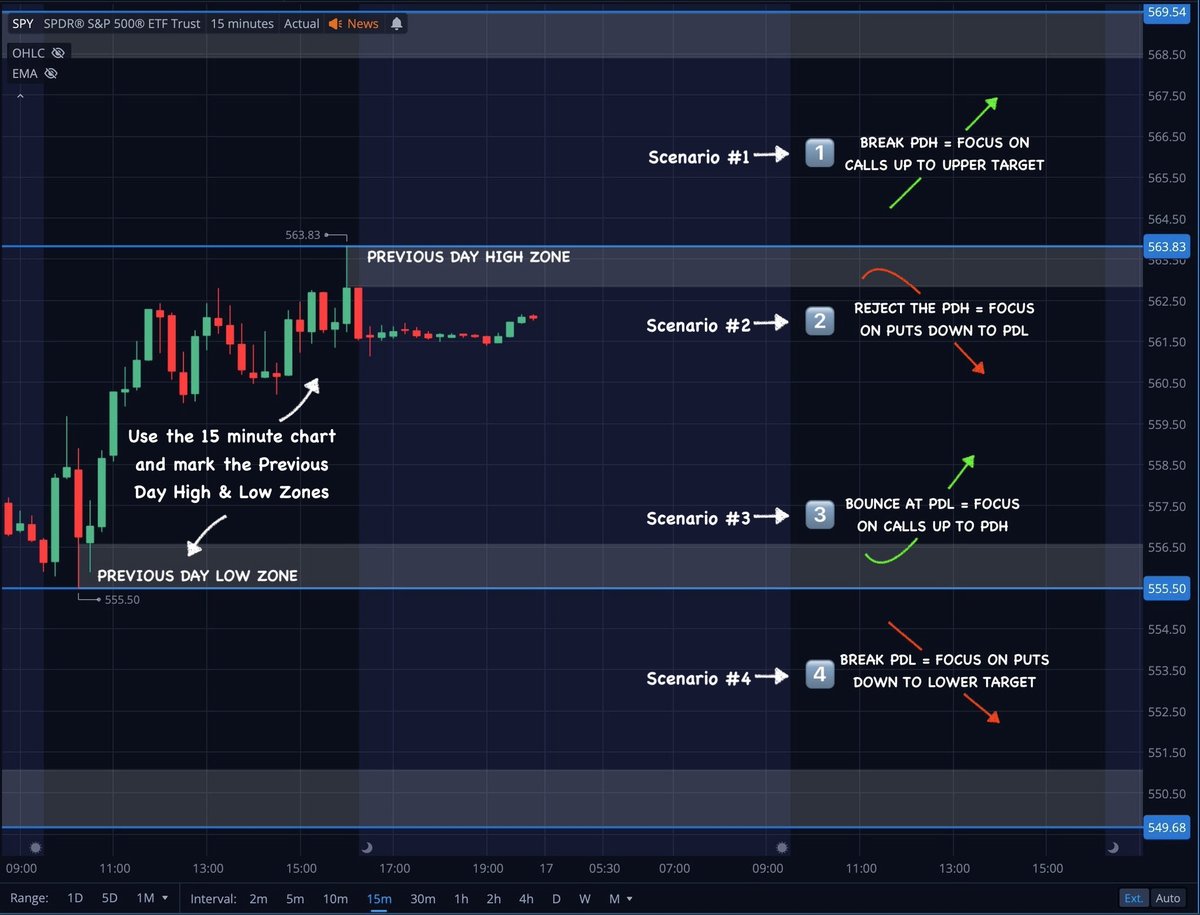
Scenario #4 ~ Price breaks below the Previous Day Low Support Zone.
This is a Bearish scenario. When this happens I keep my focus on puts / downside as long as price holds under that PDL support zone 👇
This is a Bearish scenario. When this happens I keep my focus on puts / downside as long as price holds under that PDL support zone 👇
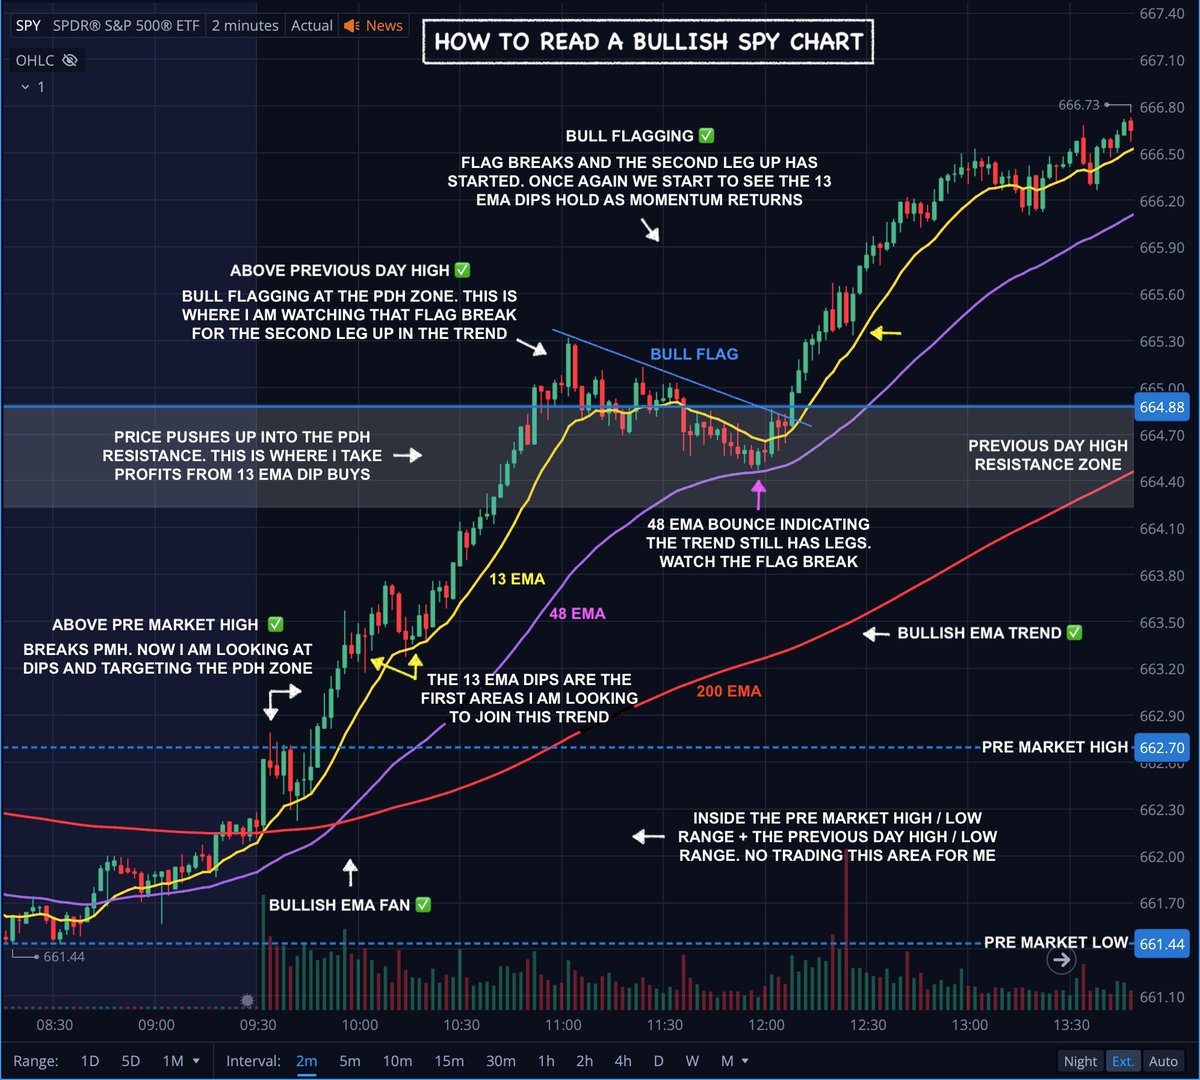
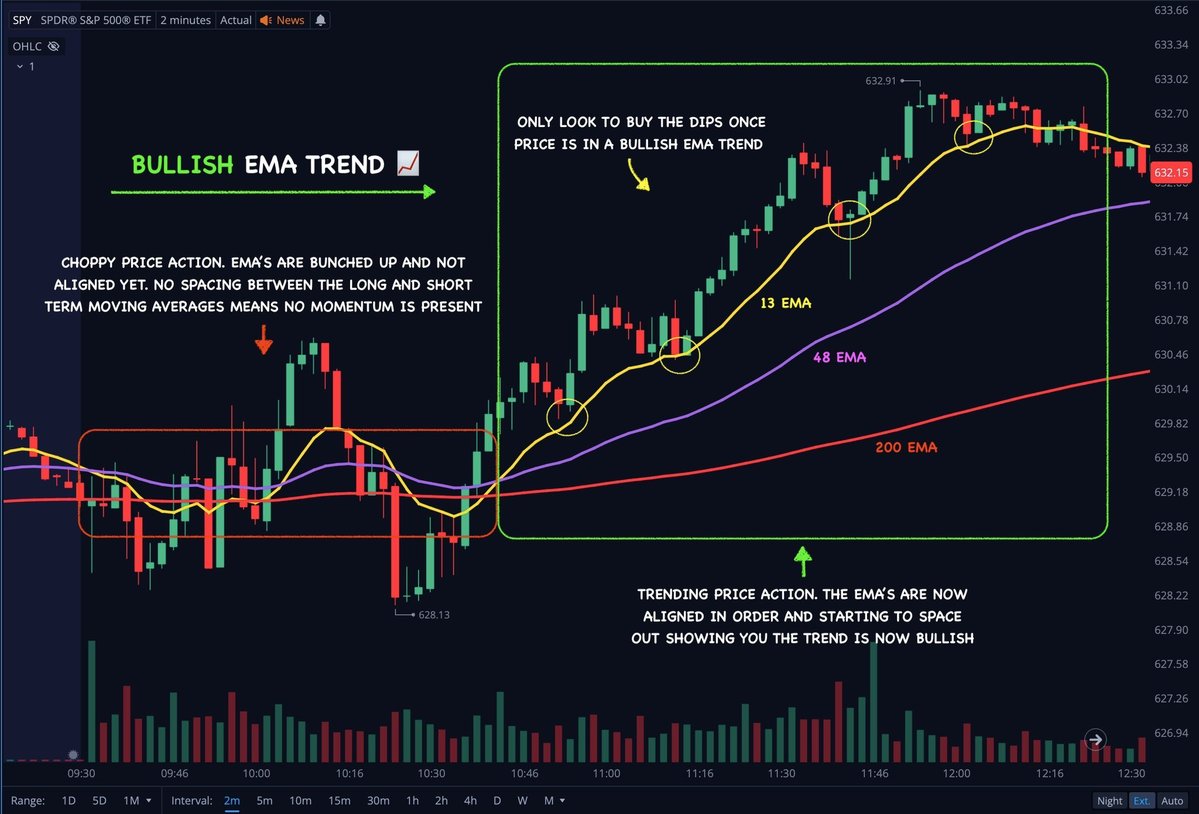
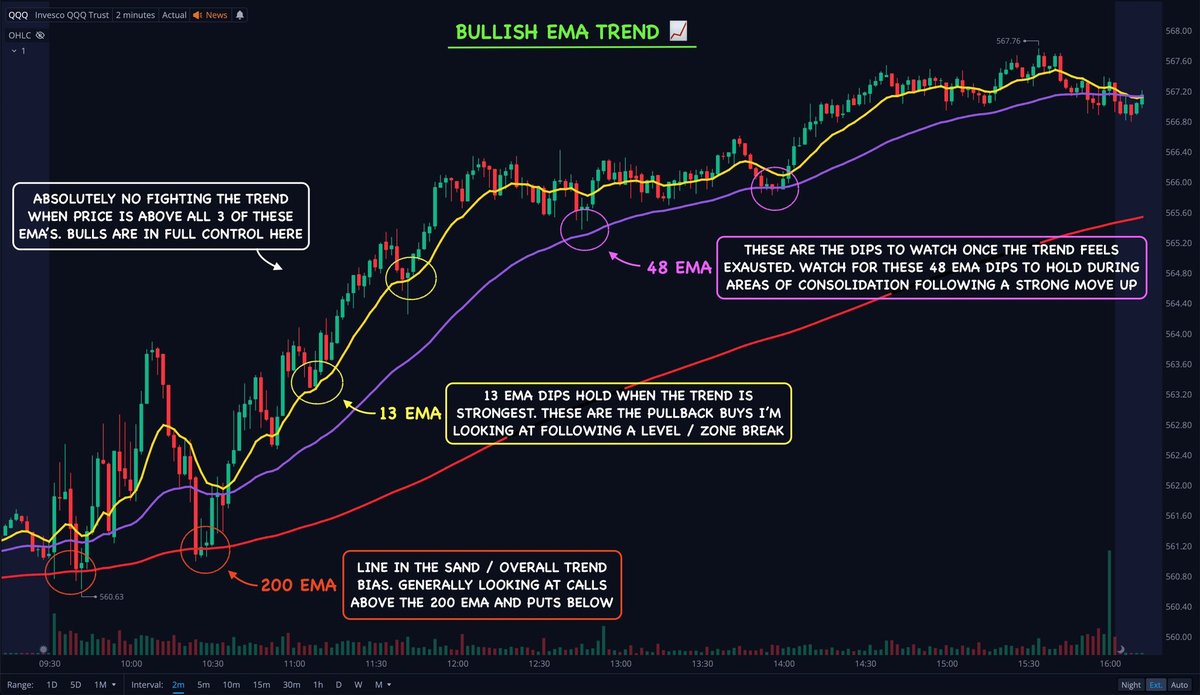
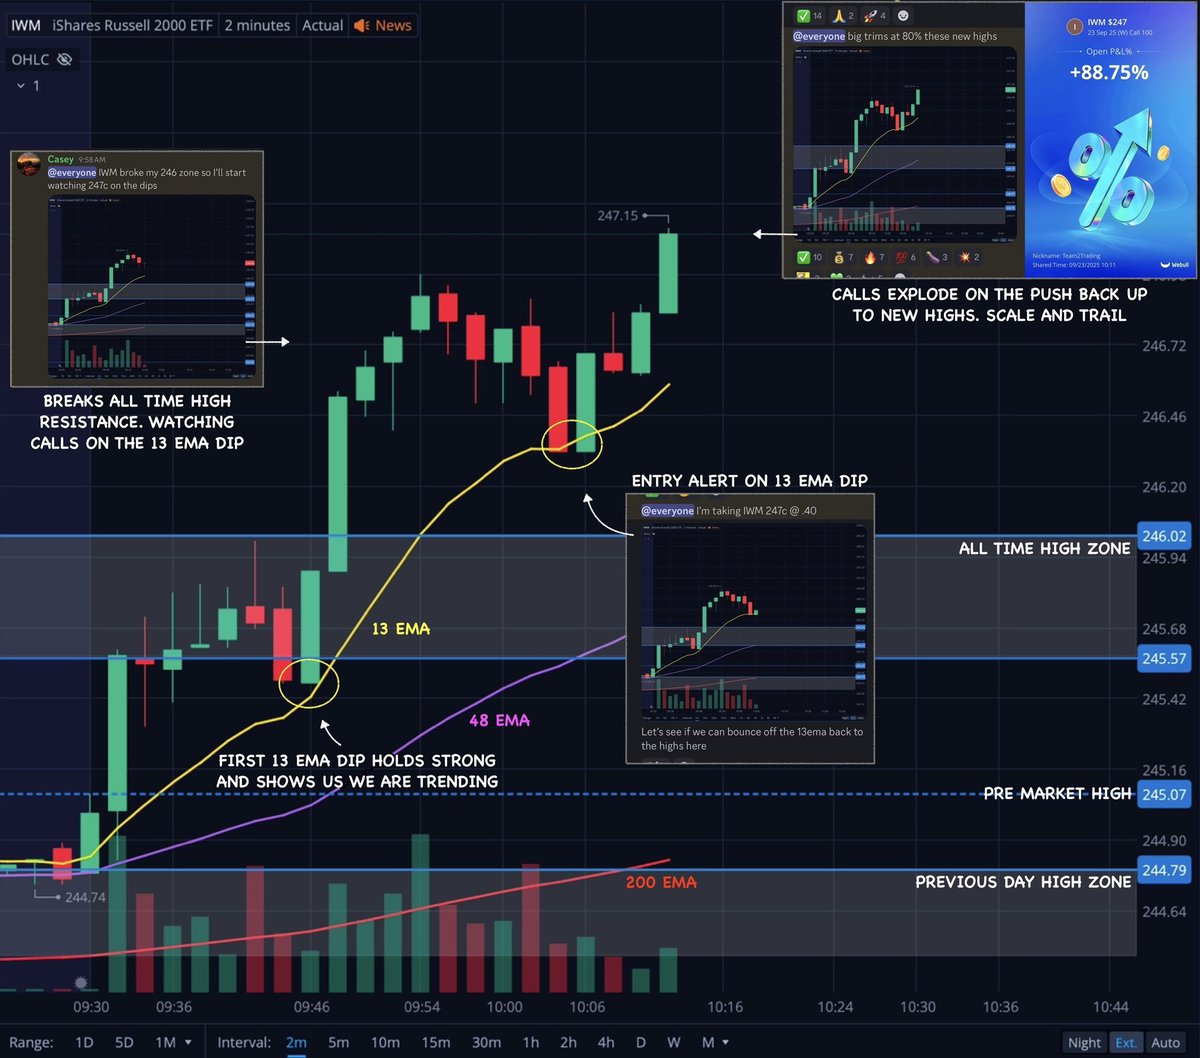
Identifying Bullish vs Bearish trends using my simple EMA system.
Here's the basic cheat sheet I follow 📝
(2 minute chart for trading shorter term trends. Higher timeframes for a wider outlook)
Bullish EMA trend 📈
13 EMA on top 🟡
48 EMA in middle 🟣
200 EMA on bottom 🔴
The uptrend is strongest when price is above all 3.
Study these images 👇
Here's the basic cheat sheet I follow 📝
(2 minute chart for trading shorter term trends. Higher timeframes for a wider outlook)
Bullish EMA trend 📈
13 EMA on top 🟡
48 EMA in middle 🟣
200 EMA on bottom 🔴
The uptrend is strongest when price is above all 3.
Study these images 👇

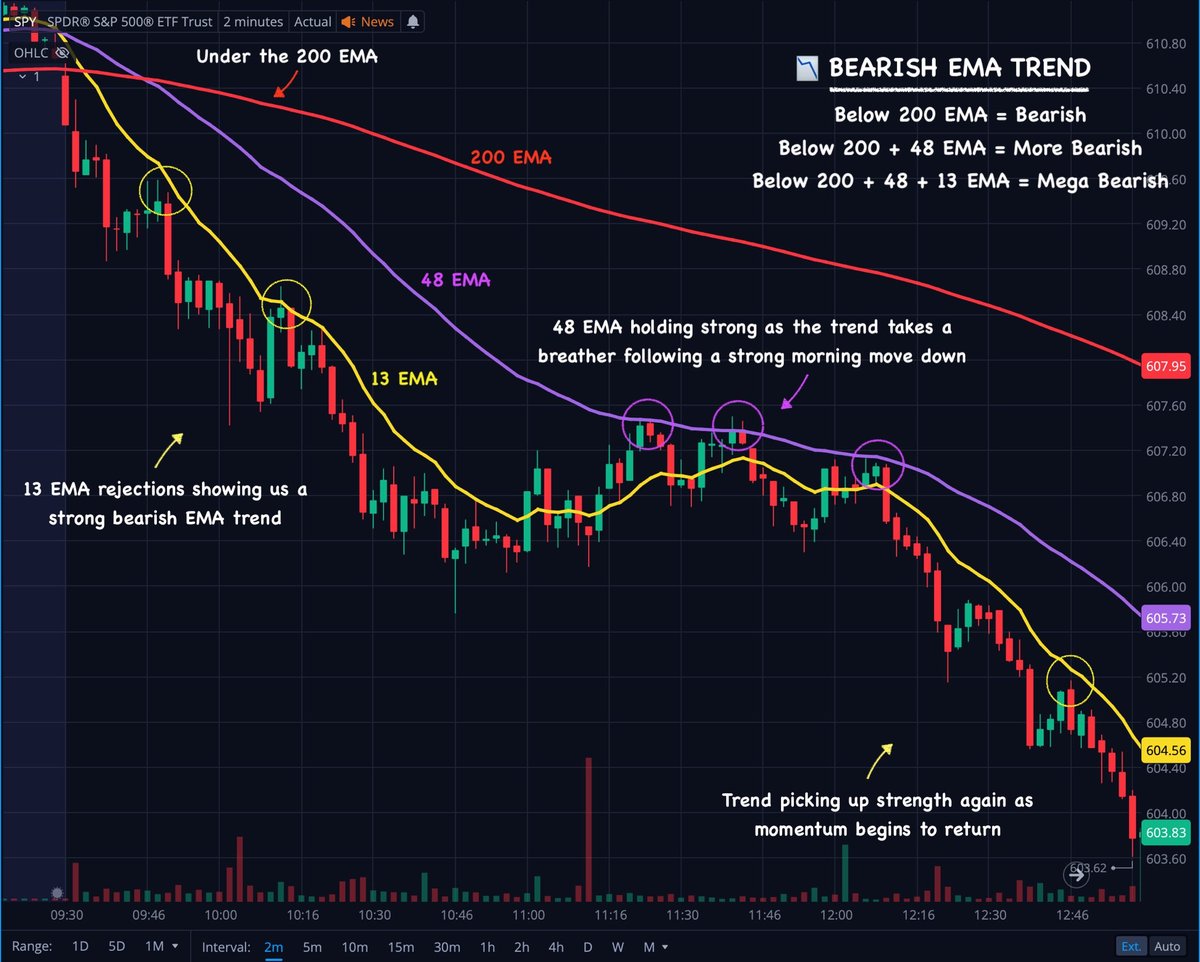
Bearish EMA trend 📉
200 EMA on top 🔴
48 EMA in middle 🟣
13 EMA on bottom 🟡
The downtrend is strongest when price below all 3.
Same rules as above only in reverse. Again, study those pullbacks 👇
200 EMA on top 🔴
48 EMA in middle 🟣
13 EMA on bottom 🟡
The downtrend is strongest when price below all 3.
Same rules as above only in reverse. Again, study those pullbacks 👇
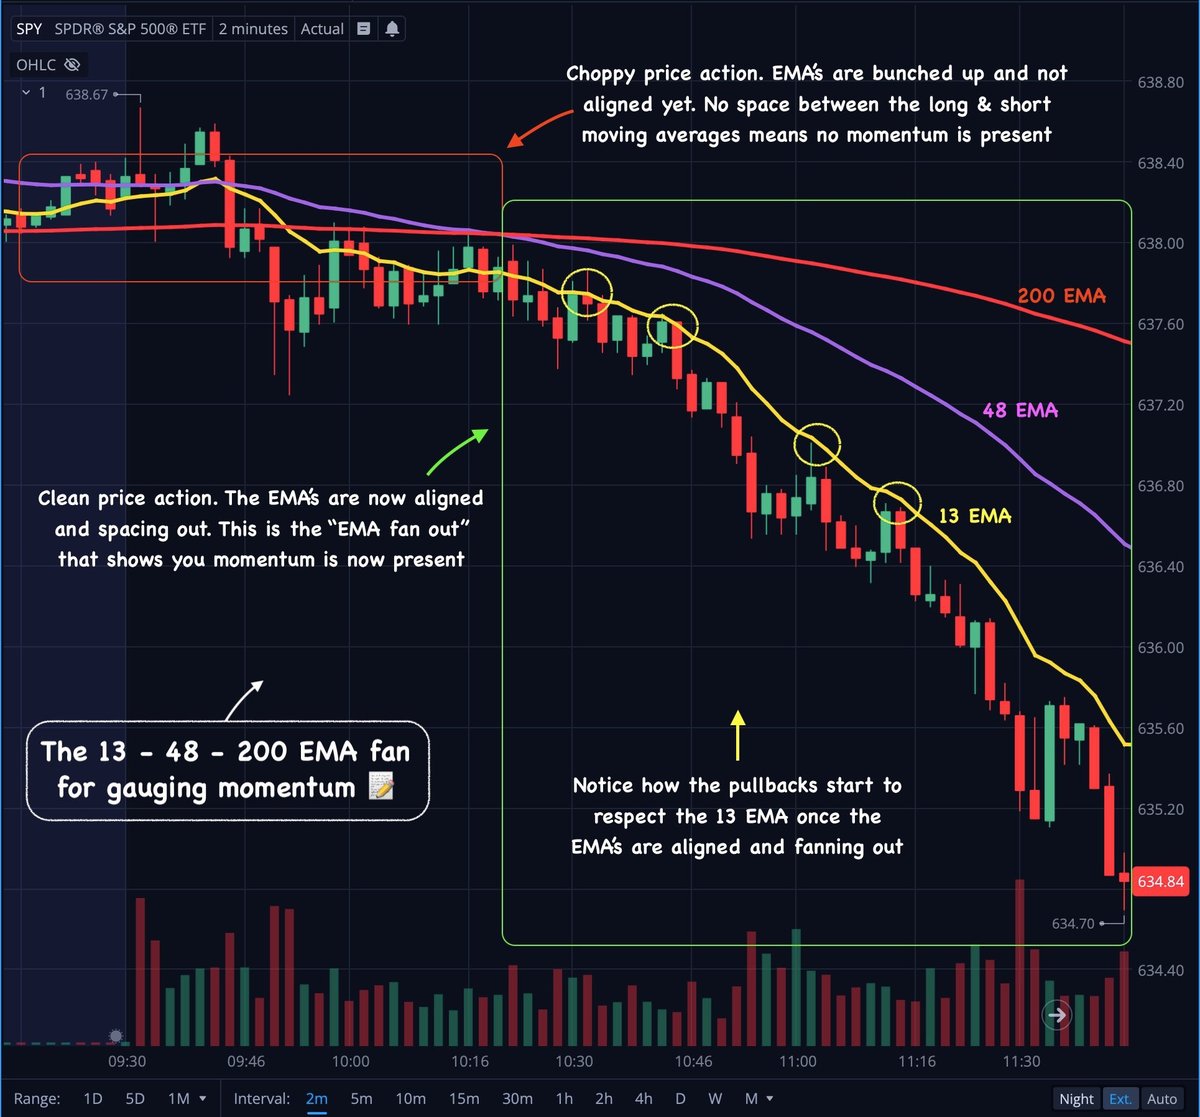
Pay close attention to the "EMA Fan" while these trends start to form.
Avoid trading the areas where these 3 EMA's are tightly spaced and braided together. That is a clear sign of chop or lack of momentum.
When those 3 EMA's start to space out and drift apart it's a good sign that momentum is coming in and the trend is starting to pick up strength.
I love this technique for avoiding choppy areas👇

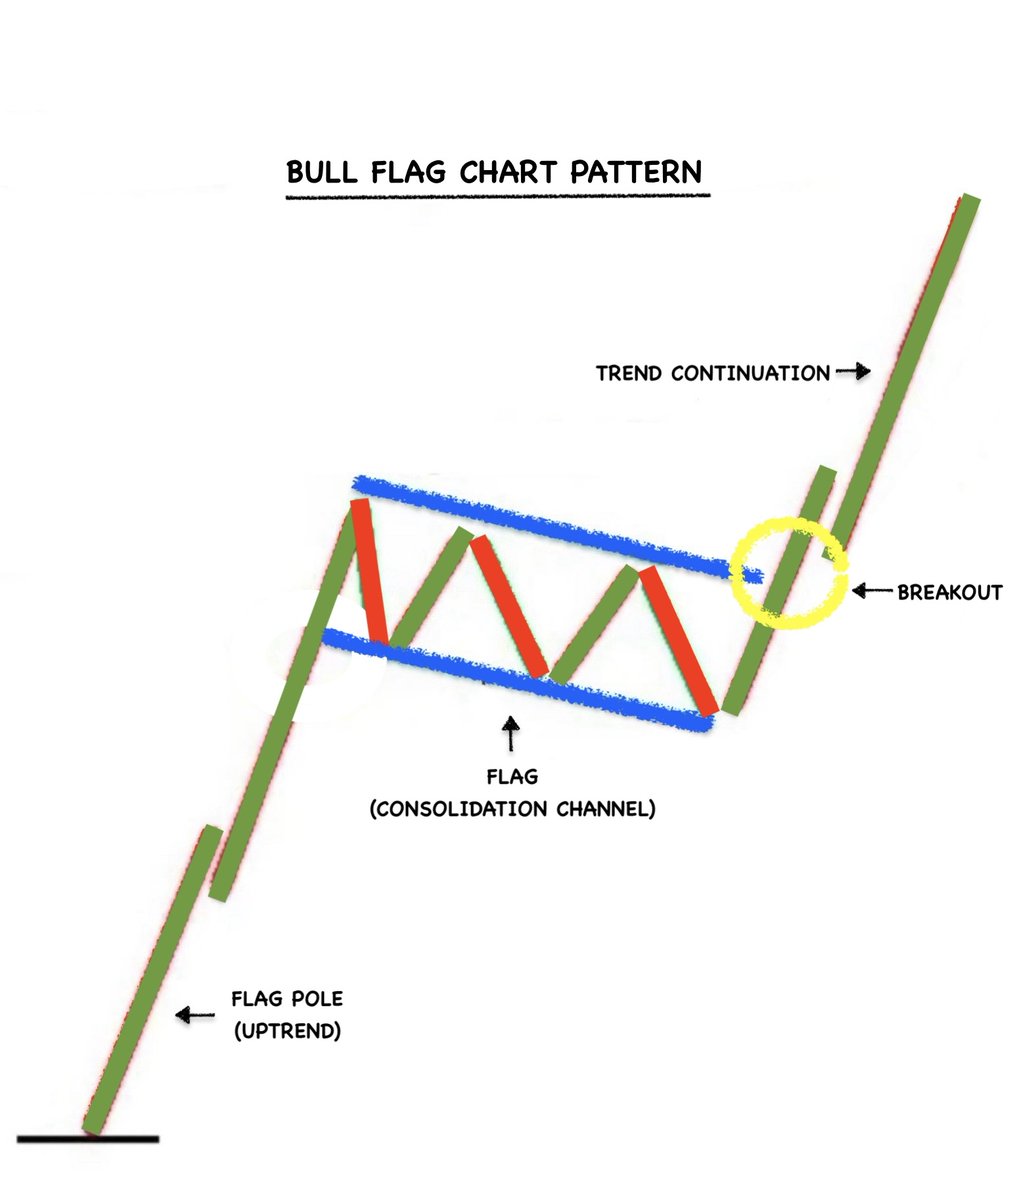
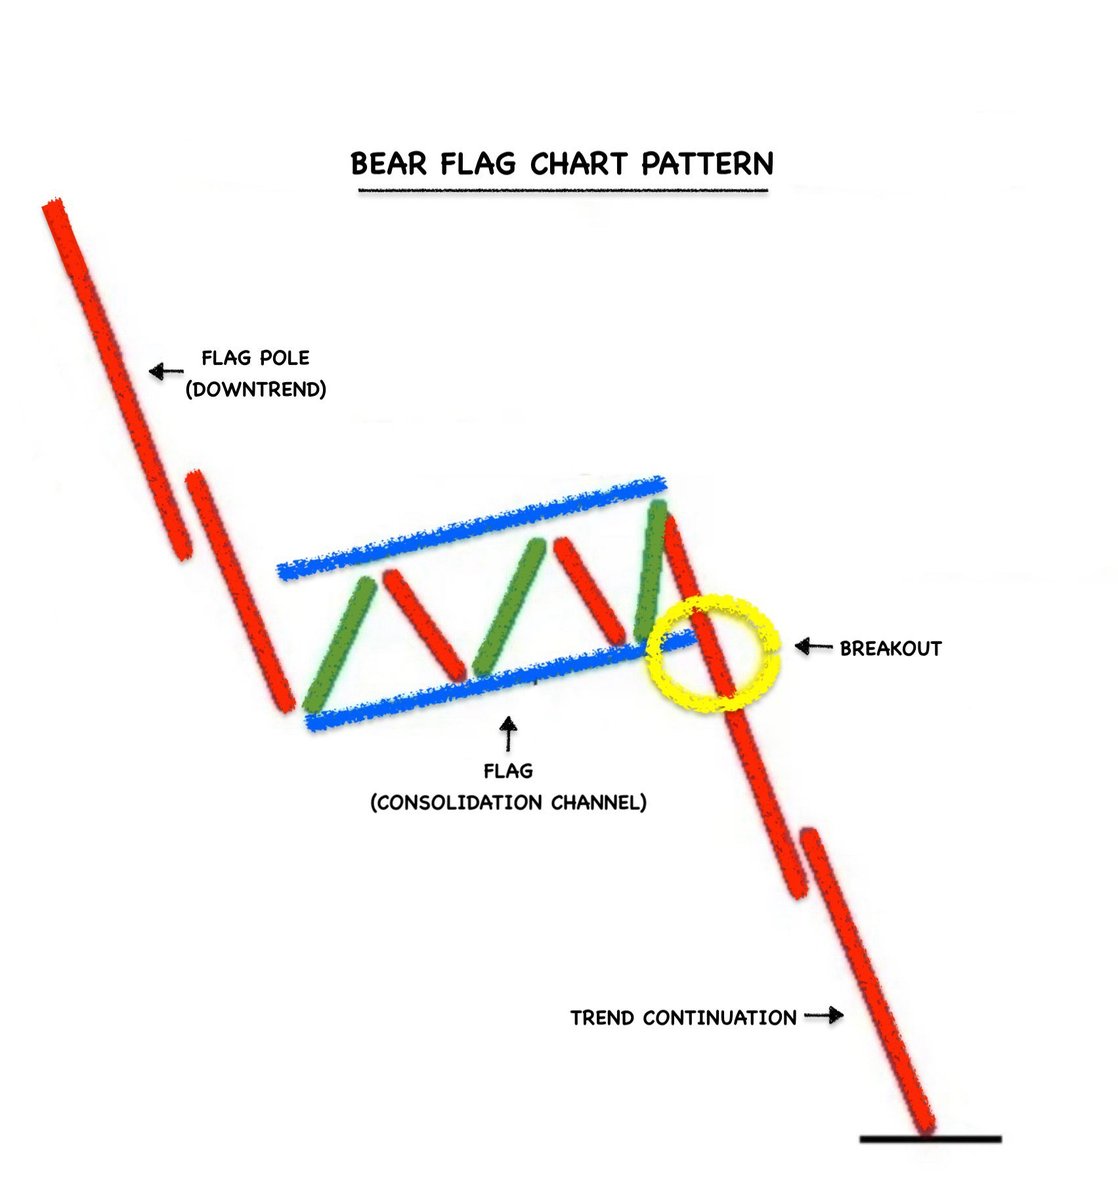
Identifying basic chart patterns.
Simple Bull / Bear Flags are my favorite.
Always look for this chart pattern when price is taking a breather or pulling back a bit.
Shorting Bull Flags and Longing Bear Flags are some of the biggest mistakes new traders make.
These Flags are continuation patterns to join the trend. Not reversals 👇
Simple Bull / Bear Flags are my favorite.
Always look for this chart pattern when price is taking a breather or pulling back a bit.
Shorting Bull Flags and Longing Bear Flags are some of the biggest mistakes new traders make.
These Flags are continuation patterns to join the trend. Not reversals 👇
Now let's break down how we can bring all this info together in order to find a high quality area to trade.
I am simply taking my 4 scenarios from above and adding in my EMA trend system + some basic chart patterns for added confirmation.
Lets take a look 👇
I am simply taking my 4 scenarios from above and adding in my EMA trend system + some basic chart patterns for added confirmation.
Lets take a look 👇
Check this out...
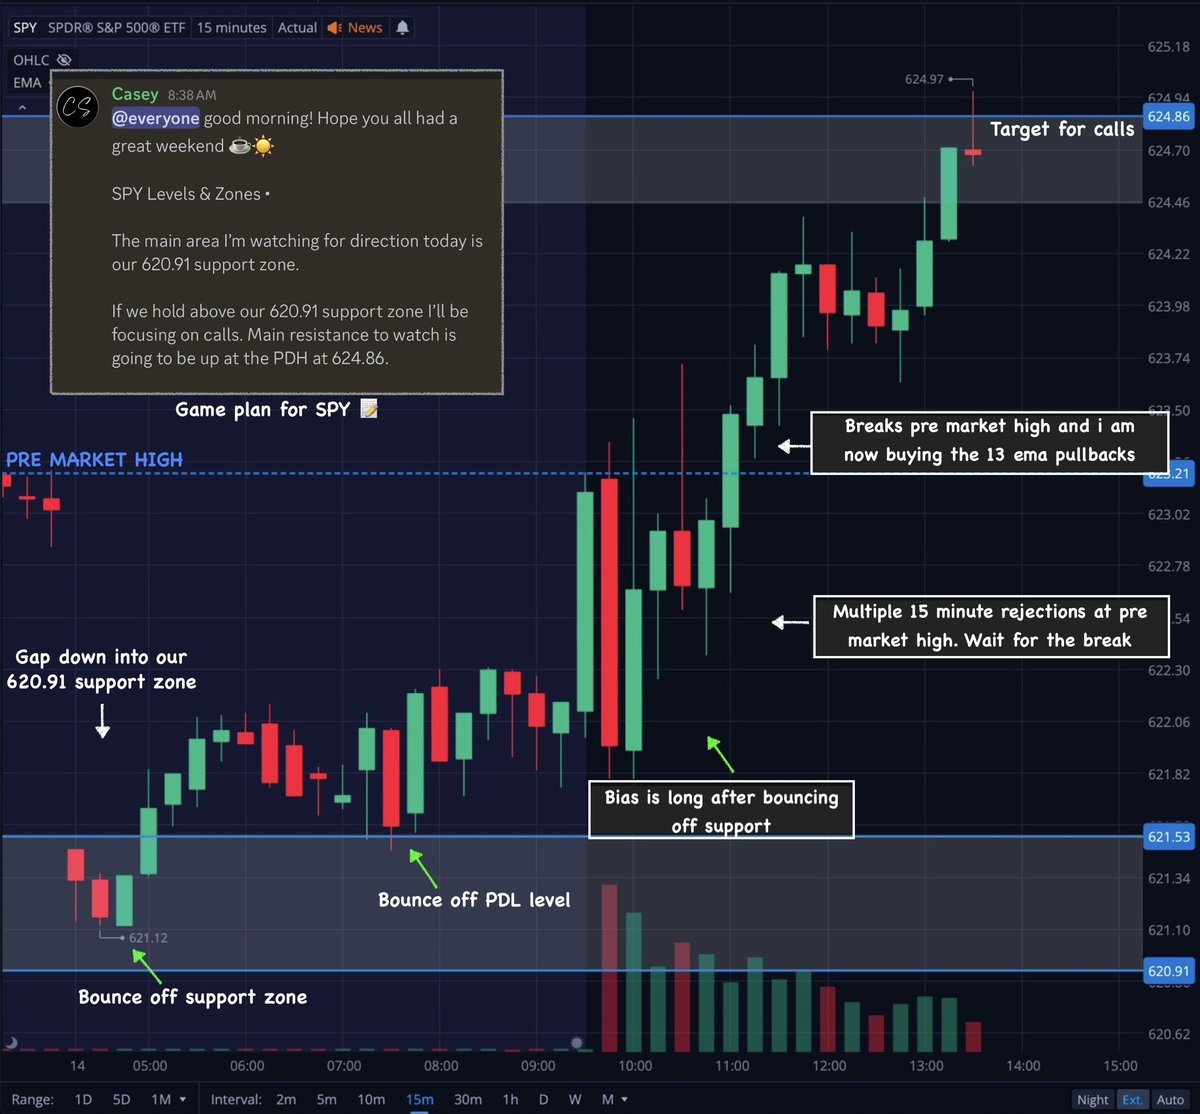
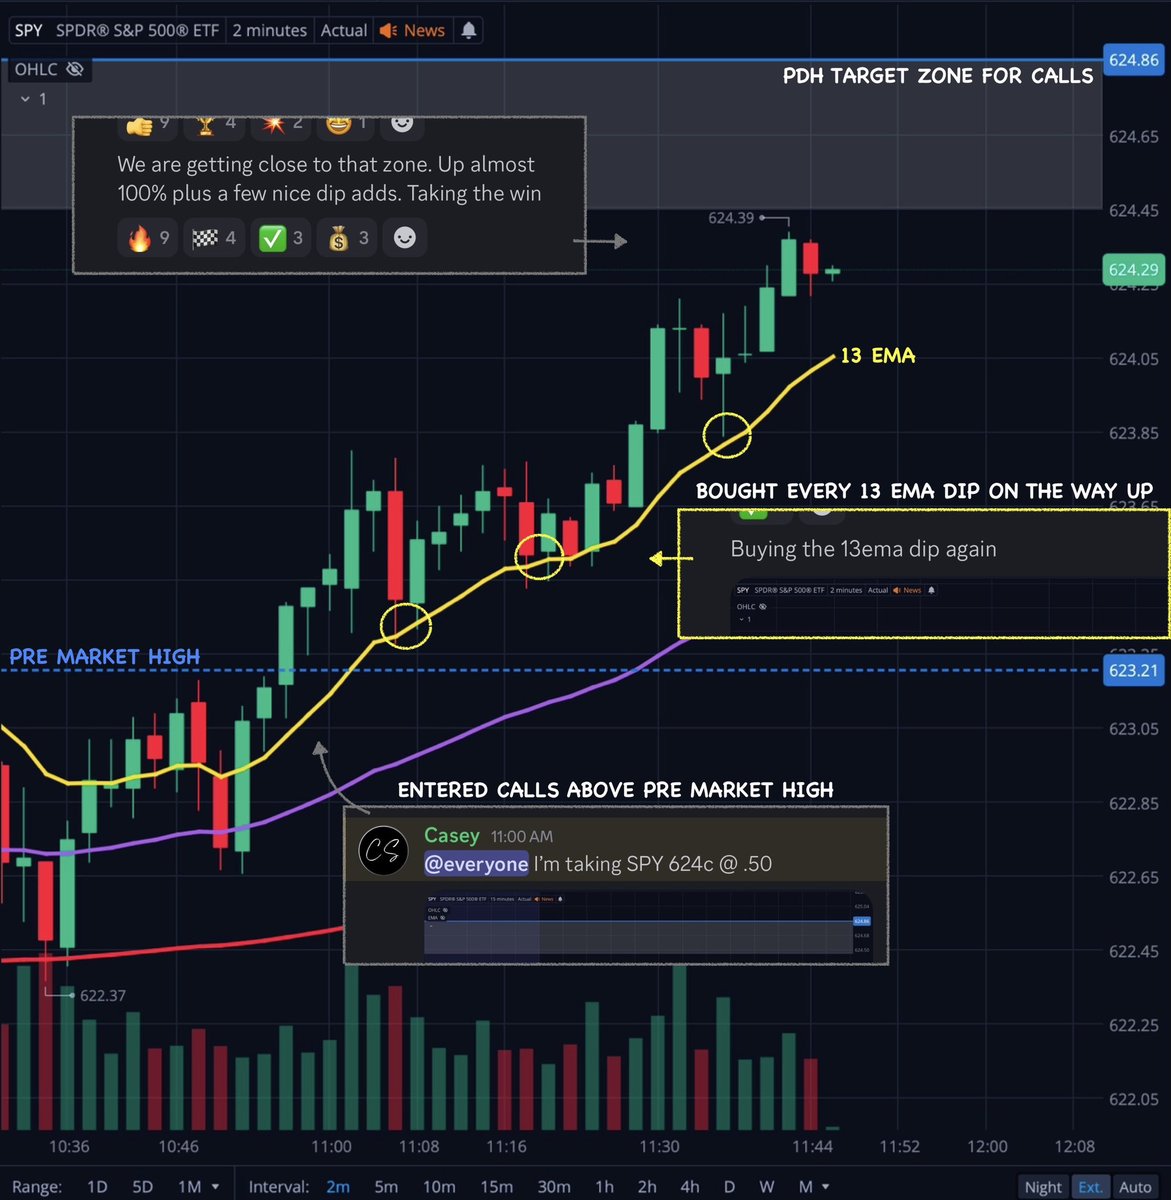
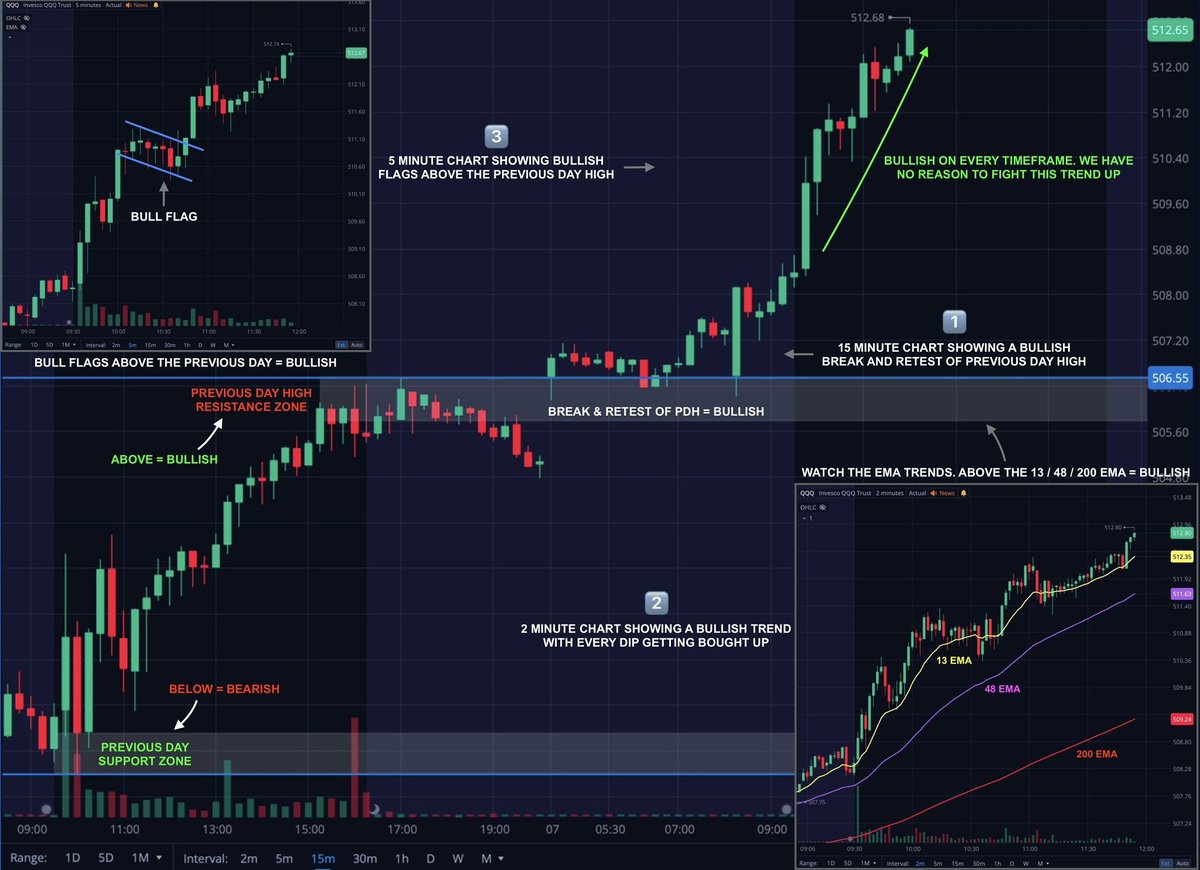
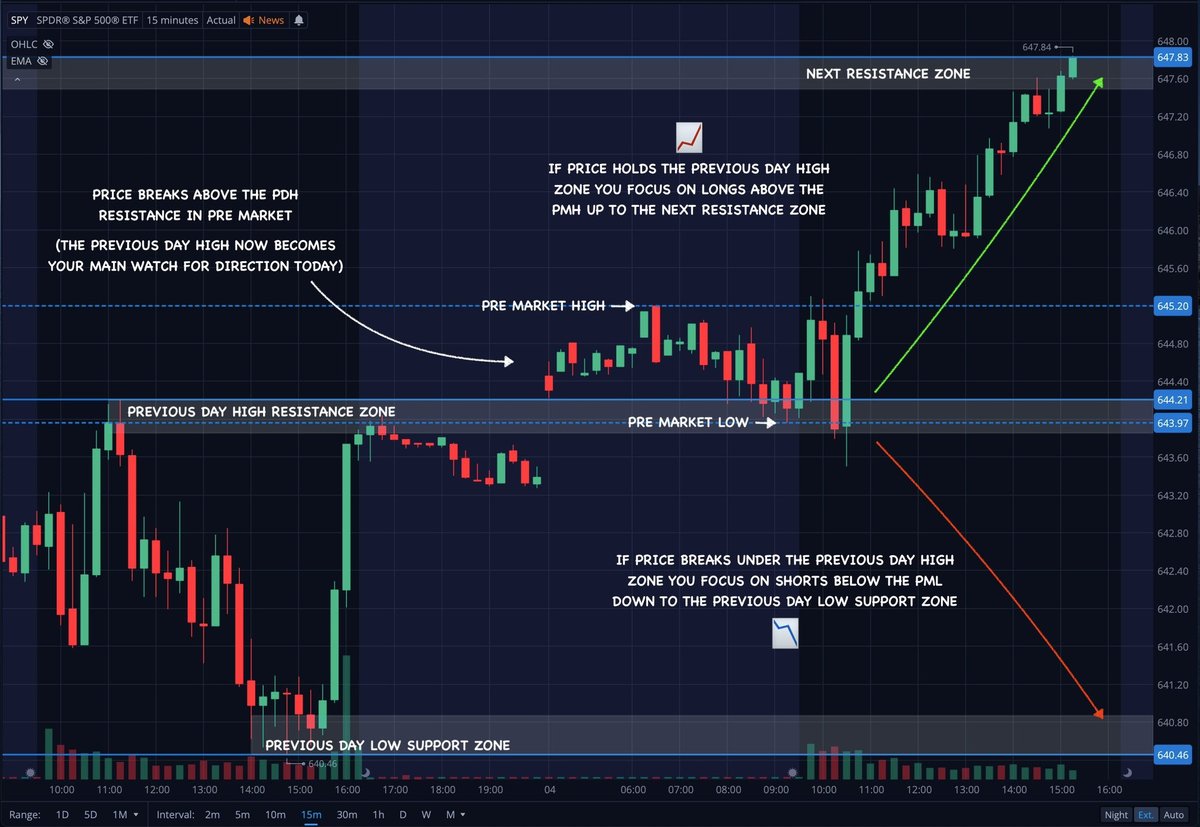
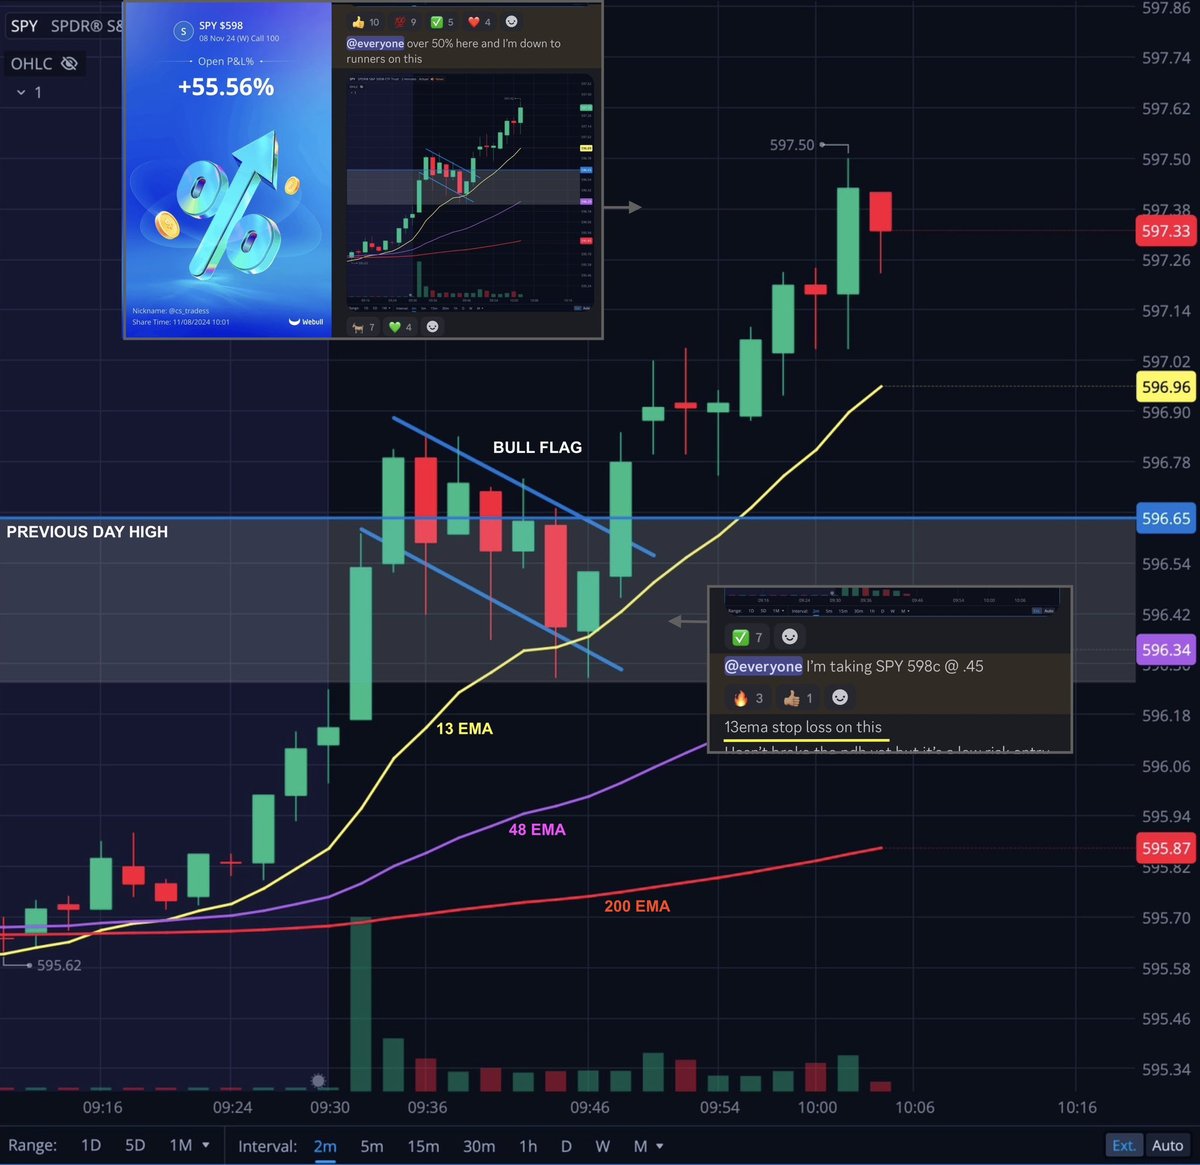
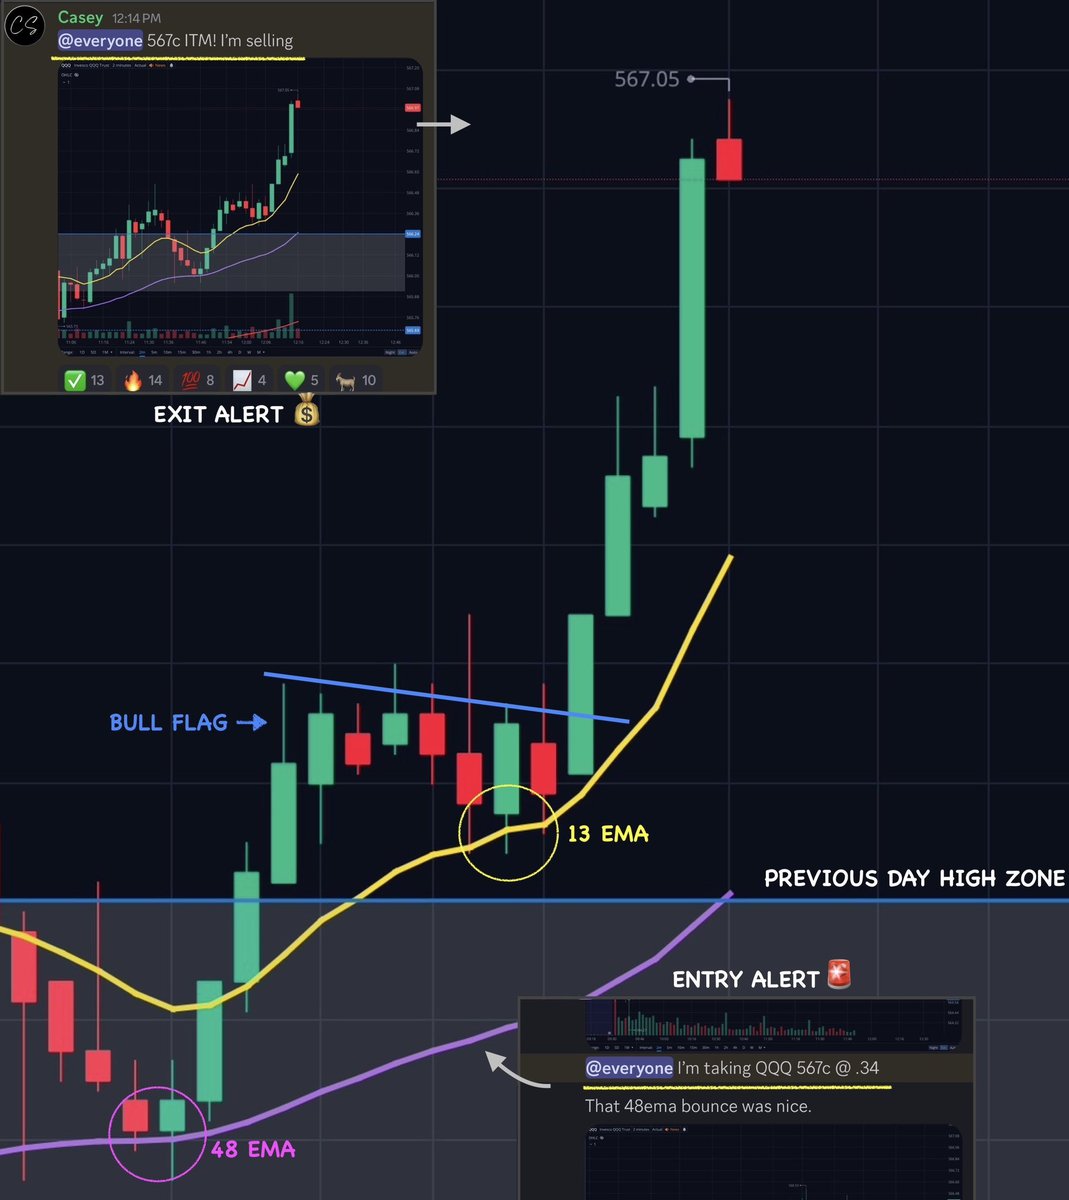
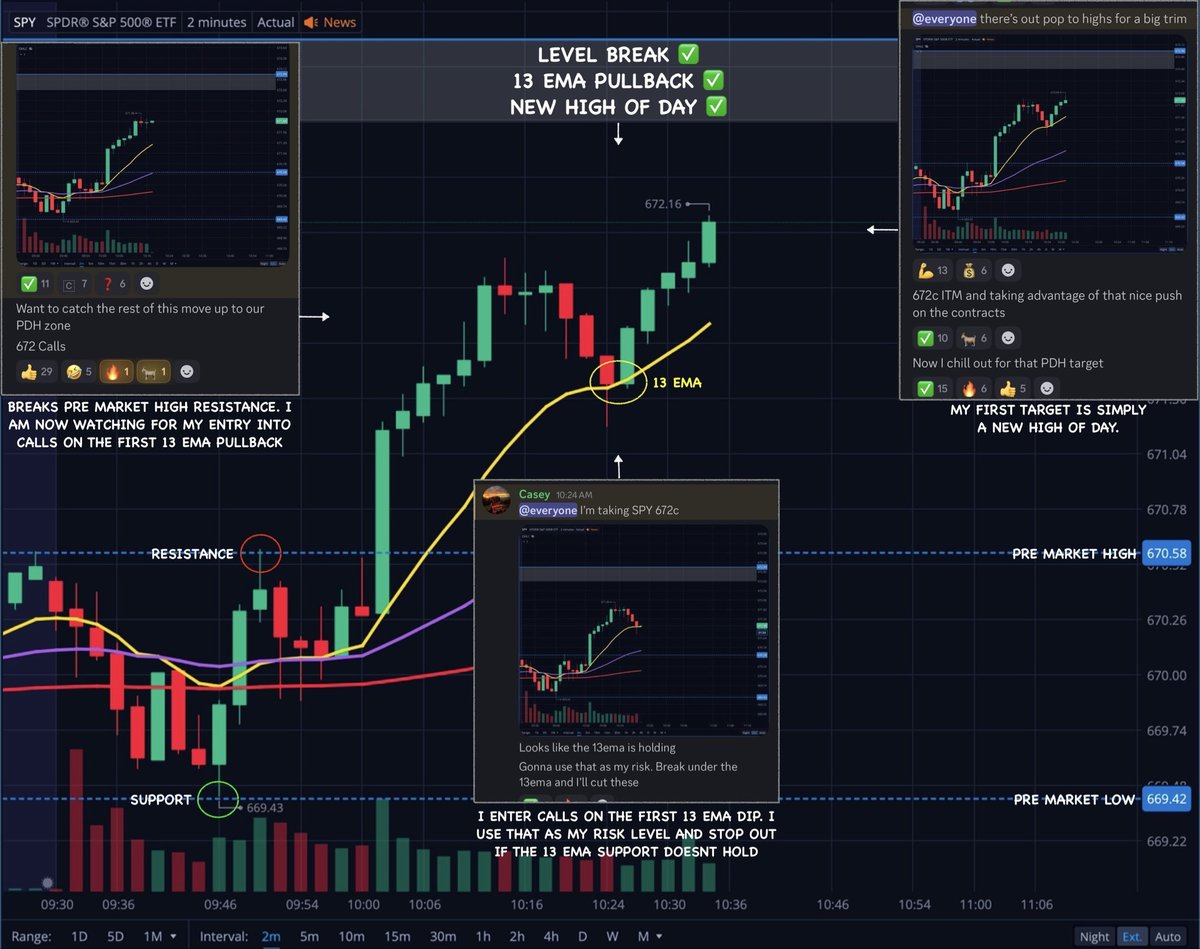
Scenario #1 ~ Breaks above the PDH resistance so bias is already Bullish to start the day.
Now what is the EMA trend system saying? Bullish EMA's are spaced out and showing strong momentum.
What's the first dip look like? Okay nice, now we have a Bull Flag forming.
Above PDH resistance ✅
Bullish EMA trend ✅
Bull Flagging ✅
Multiple confirmations on direction makes this a high probability to get long and catch a piece of the trend 👇

Again... Scenario #1 with all 3 confirmations 👇

Lets go to the opposite end...
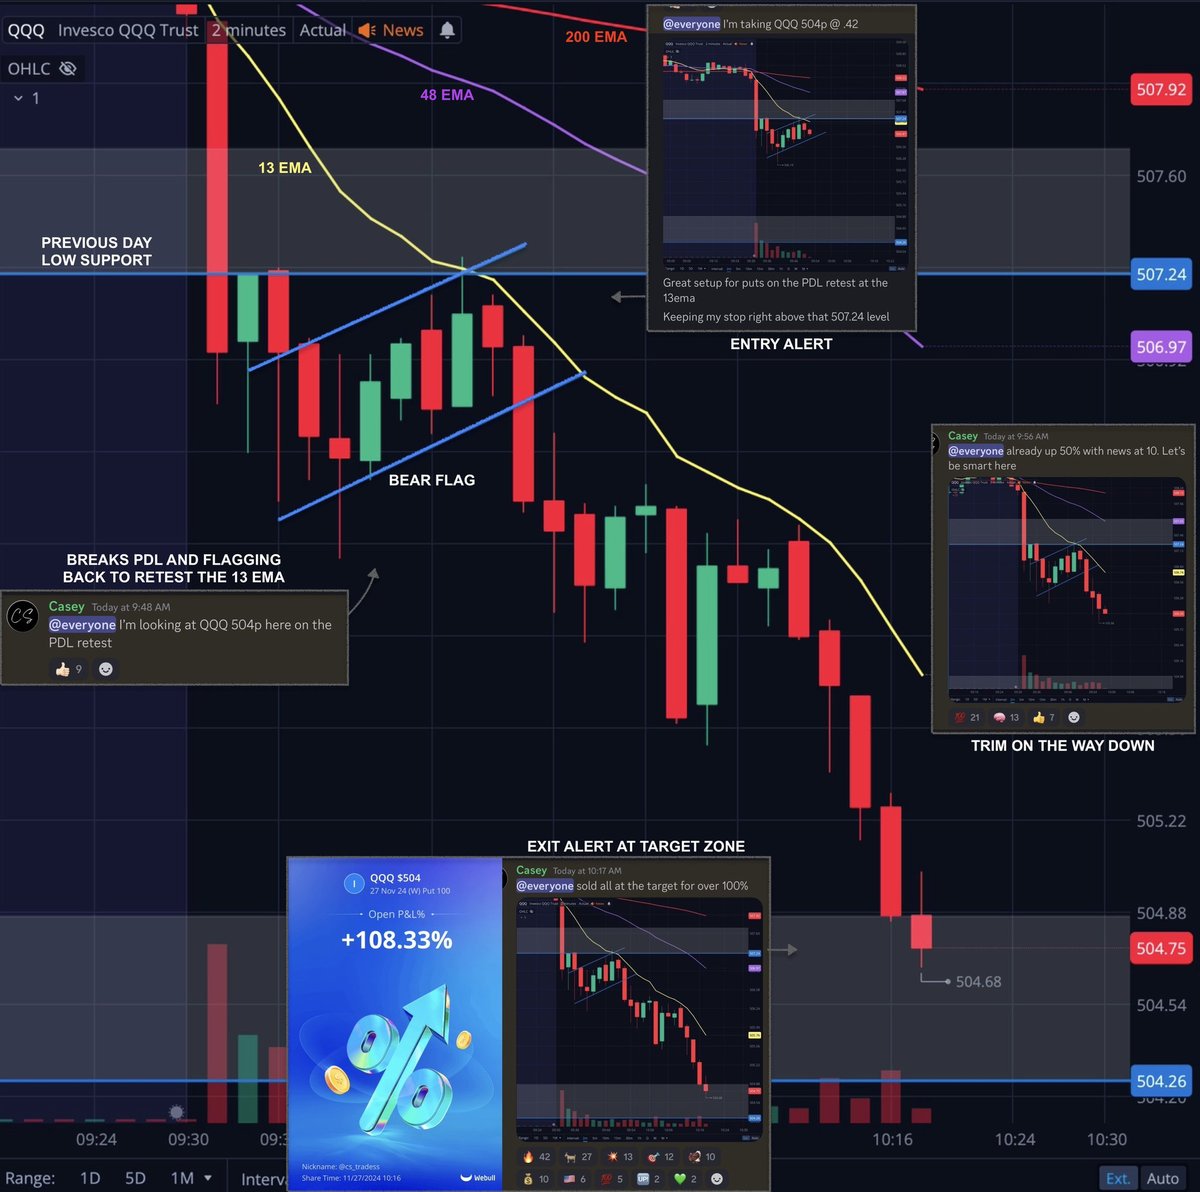
Scenario #4 ~ Price breaks below the PDL support zone so bias is Bearish.
What does the EMA trend look like? Spaced out and showing a strong Bearish trend.
As price starts to pullback what are we looking for... Okay nice it's Bear Flagging!
Below PDL support ✅
Bearish EMA trend ✅
Bear Flagging ✅
Multiple confirmations showing us the trend is down giving us a high quality area to trade the downside move 👇
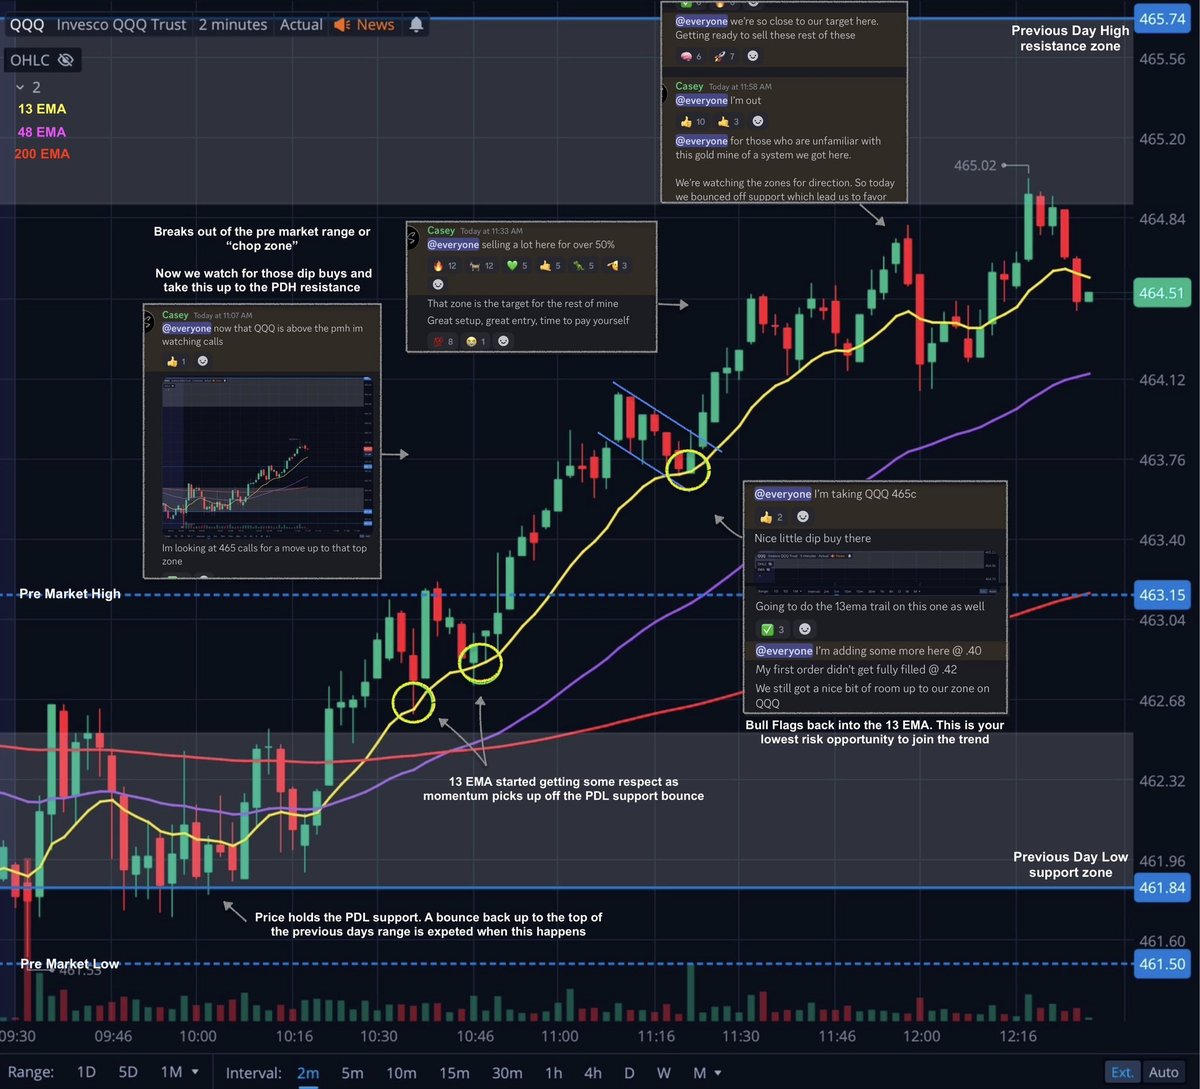
This one is Scenario #3
Strong support at PDL giving us an upside bias.
EMA's Fan out creating a Bullish EMA trend that shows nice momentum.
Even get a nice little Bull Flag pullback in there half way to our PDH target 👇
Strong support at PDL giving us an upside bias.
EMA's Fan out creating a Bullish EMA trend that shows nice momentum.
Even get a nice little Bull Flag pullback in there half way to our PDH target 👇
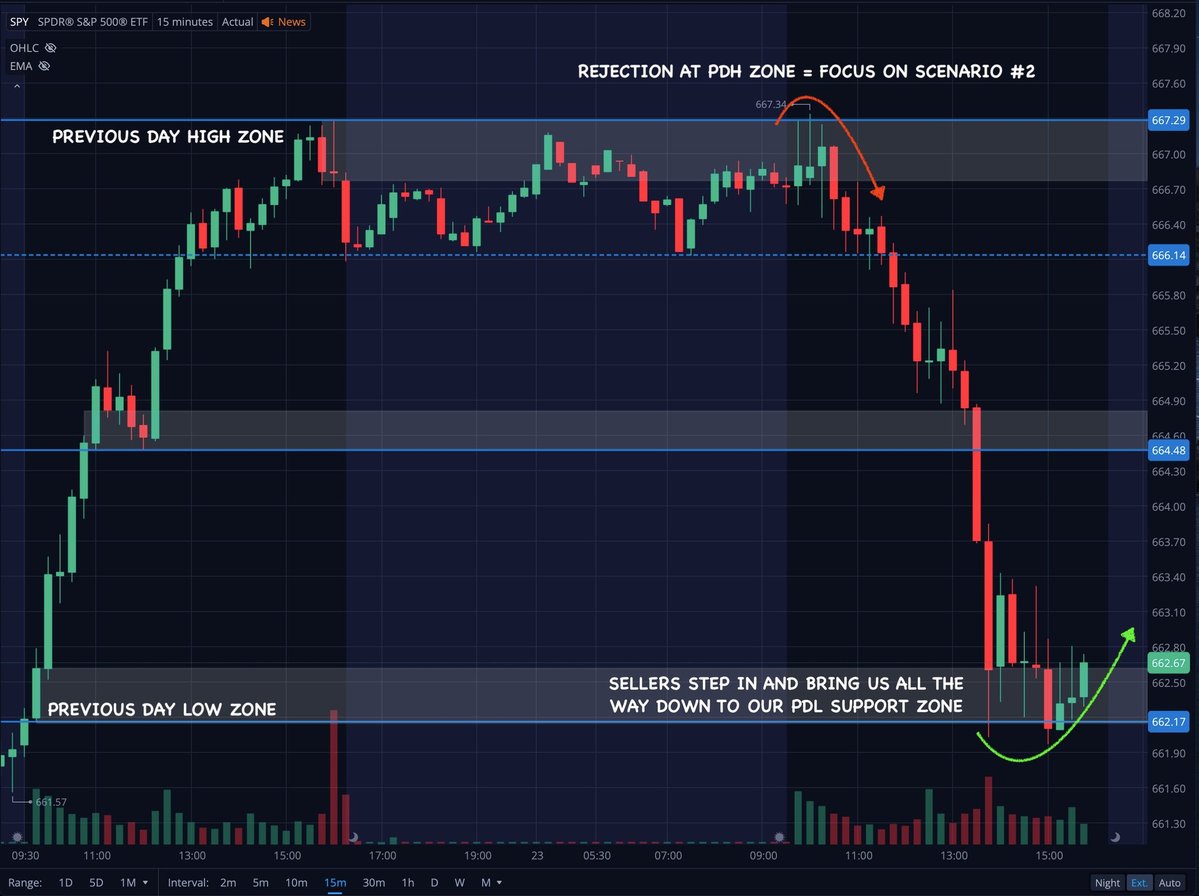
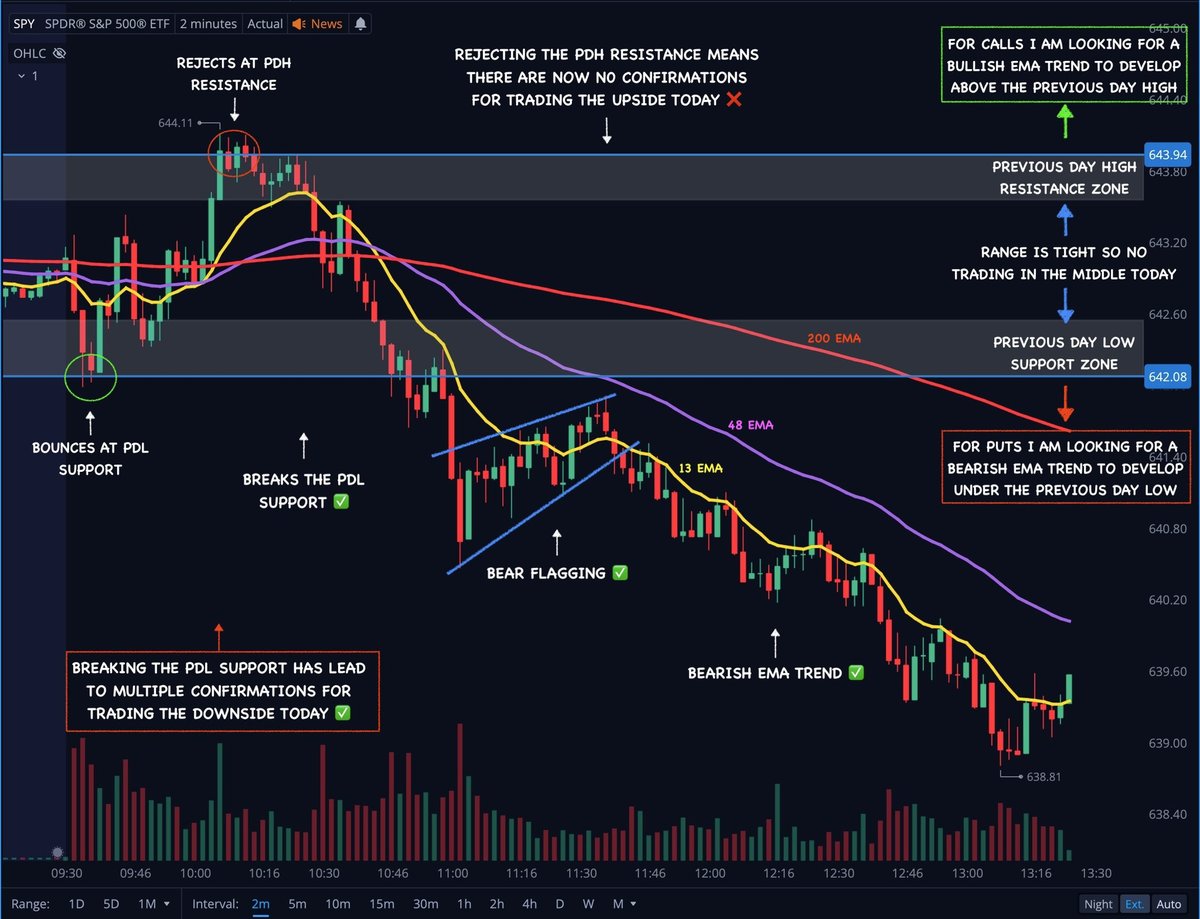
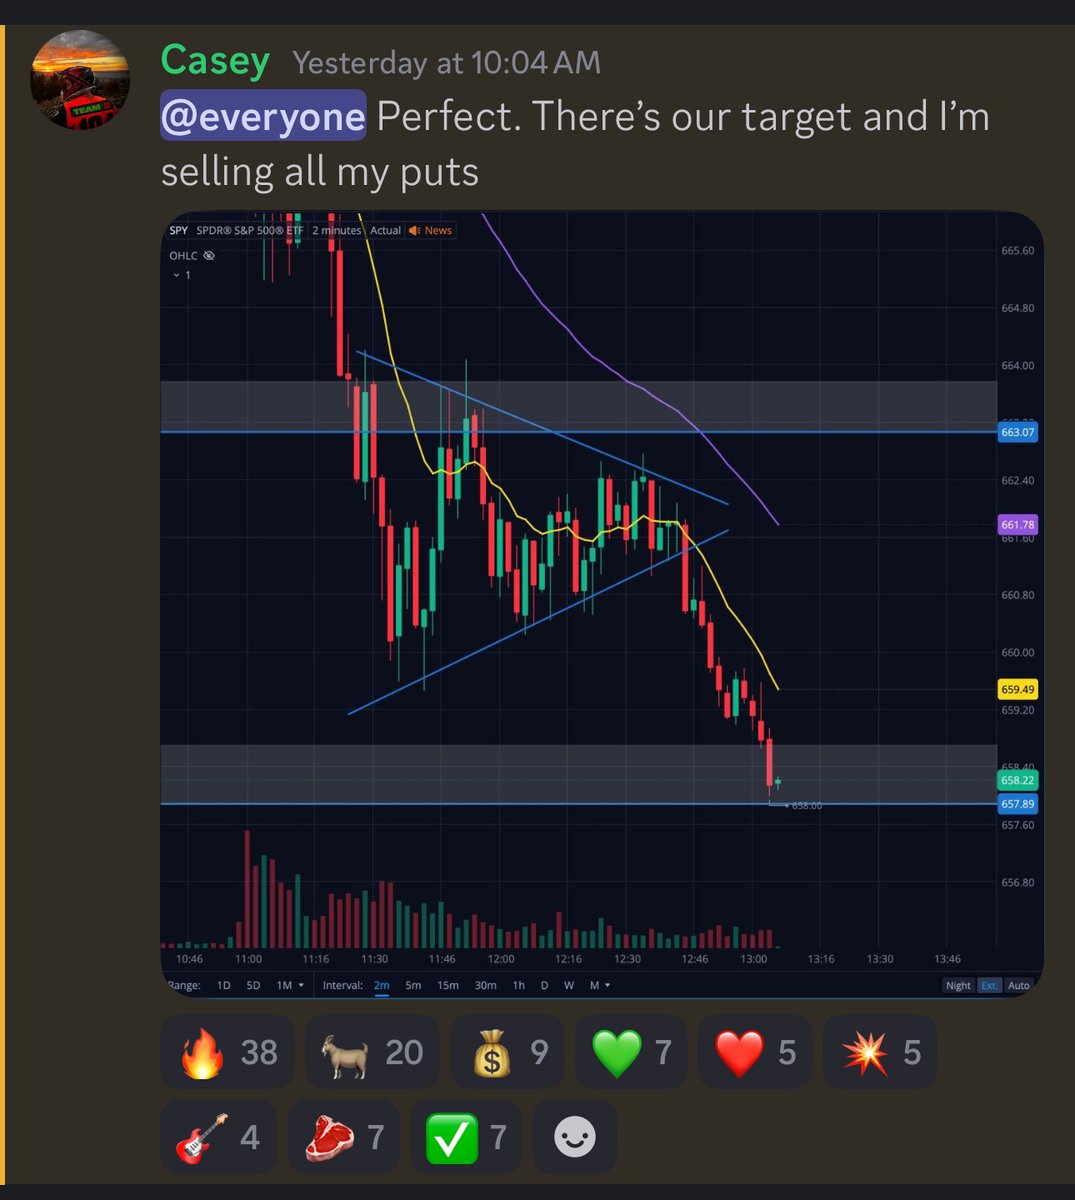
Last example is Scenario #2
Price rejects that PDH resistance zone so my bias is to the downside.
Next we break under all the EMA's and the Bearish trend starts to form.
Notice the 13 EMA respect which is an excellent sign that bears are in full control here 👇
Price rejects that PDH resistance zone so my bias is to the downside.
Next we break under all the EMA's and the Bearish trend starts to form.
Notice the 13 EMA respect which is an excellent sign that bears are in full control here 👇
My goal every single day is to simply identify the trend and try to catch a piece of it.
I don't need every move, I don't need the whole move,
I just need to identify the trend and catch a piece of it 👇
I don't need every move, I don't need the whole move,
I just need to identify the trend and catch a piece of it 👇

Note how similar every trade starts to look when you come in with a game plan and a strategy to follow.
The only way to achieve consistent results is by trading a consistent process.
Reduce the randomness of your trades and you will reduce the randomness of your P&L 💚
The only way to achieve consistent results is by trading a consistent process.
Reduce the randomness of your trades and you will reduce the randomness of your P&L 💚

Thanks for reading guys!
Obviously I can't cover my entire trading journey or strategy in a single thread so make sure to follow along for much more tips and techniques.
Feel free to comment questions! I'll circle back to all of them when I have time 🤙
Obviously I can't cover my entire trading journey or strategy in a single thread so make sure to follow along for much more tips and techniques.
Feel free to comment questions! I'll circle back to all of them when I have time 🤙
• • •
Missing some Tweet in this thread? You can try to
force a refresh