
It’s time to rebut this completely, embarrassingly wrong and hostile thread. Link to article and long 🧵 below. Sorry for the delay, but quality writing takes longer than LLM-style writing that is superficially smart but uncomprehending and error-ridden. 
https://x.com/sichuan_mala/status/1974935552303776074

Here is the article version, which covers …
- People admitting my points about manufacturing GDP real value-added even while calling me wrong
- A blow-by-blow rebuttal of Sichuan’s very bad article
- Technical details previously omitted for brevity
rectifications.net/p/fractally-ri…
- People admitting my points about manufacturing GDP real value-added even while calling me wrong
- A blow-by-blow rebuttal of Sichuan’s very bad article
- Technical details previously omitted for brevity
rectifications.net/p/fractally-ri…
But first, before rebutting Sichuan Mala, I appreciate Brent Moulton, formerly head of the GDP calculation at the BEA, for clarifying that most people should not be citing real value-added. This was the central point of my article.
https://x.com/brent_moulton/status/1975036064722223315

However, I urge Moulton and the BEA to correct their public learning center and issue more explicit guidance on the nature, limits and misuses of real value-added so that pundits are not misusing the number to mislead Americans.
https://x.com/pfitzsimmons/status/1979214846437523537
I remain irked with Moulton for starting his thread about how I "misunderstood a chart" in a tweet with 38k views...then in tweets with <1K views he acknowledges that I didn't misunderstand it...that misunderstanding was what I was debunking.
https://x.com/brent_moulton/status/1976325928545550492

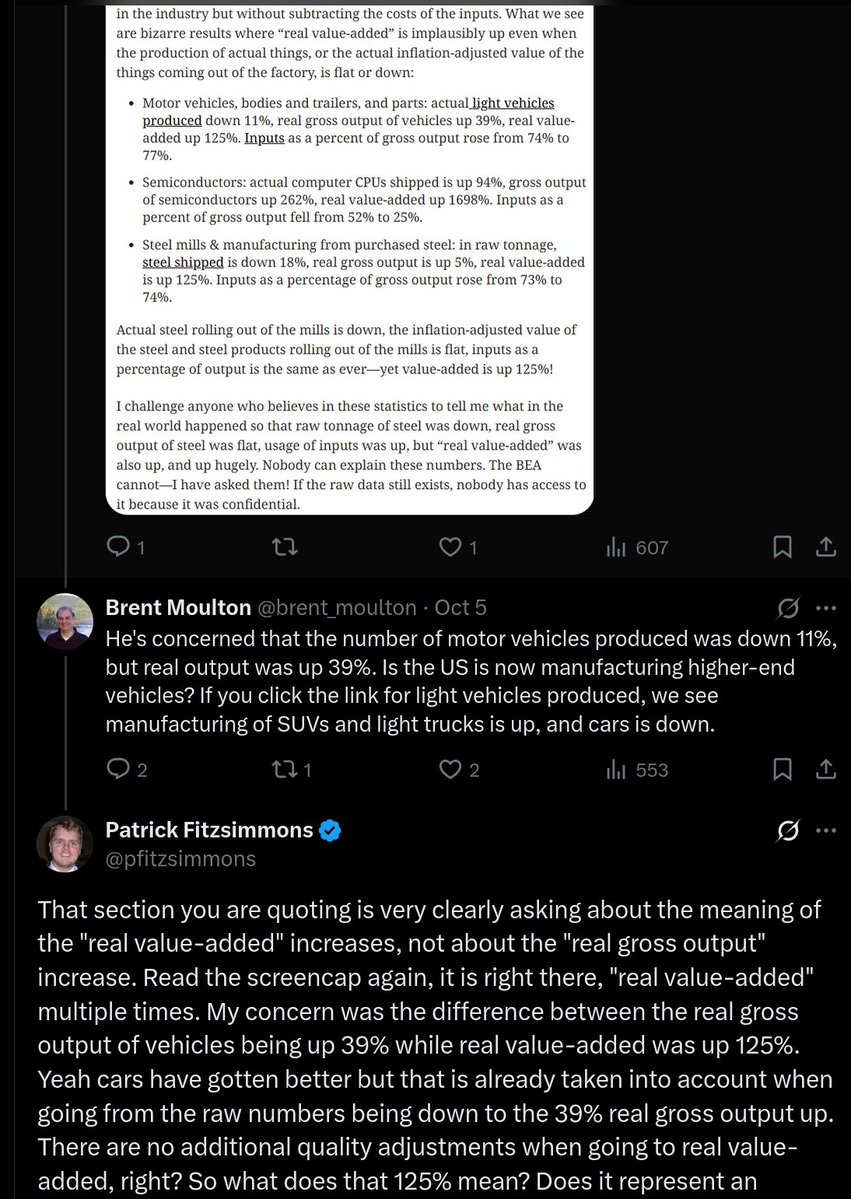
I am also irked that he falsely claimed my concern was the difference between raw numbers and real gross output (a concern he smashed like a pinata), when my actual concern, which was stated clearly in his own screencap, was the real value-added number.
https://x.com/pfitzsimmons/status/1982877405753581940
In my article, I respond to the rest of Moulton's thread. Now, on to Sichuan Mala's article (whom I also call "Mr. Fractally Wrong" since he seems really to have an affection for that phrase).
Sichuan spends two dozen paragraphs boxing at shadows. He argues the BEA correctly calculates real value-added according to how it's defined. I agree! I never argued otherwise! My point was that real value-added is broken as a metric of the growth of what America manufactures.

He corroborates my main point! If a 100% increase in apple juice production value-added might actually mean only a 1% increase in the quality or quantity of apple juice, then it would be misleading for a pundit to cite this 100% as a fantastic increase in apple juice production!

He erroneously says that I ignore how cars, steel, CPUs are much better. That is already taken into account in real gross output, there is no additional quality adjustment for real value-added, so that cannot explain the difference between real gross output and real value-added.

Sichuan then fails reading comprehension. I never claimed the BLS lacks a scrap steel price index. The point is if energy is used directly, that is subtracted from value-added, but energy embodied in the scrap steel (from long ago) is not subtracted.
https://x.com/sichuan_mala/status/1974935559996059982


Finally he agrees with me that the 125% increase in steel value-added is likely related to using less energy as inputs! But he fails to see the importance! It means that real value-added is substantially a measure of energy efficiency, not of America manufacturing more value.

If real value-added is substantially a measure of efficiency, then it is wrong to use an increase in real value-added as evidence that the "power" or "output" of America manufacturing has grown, as @ATabarrok does in this post: marginalrevolution.com/marginalrevolu…
Amazingly @ATabarrok retweeted Sichuan's article. Is Tabarrok in the habit of retweeting vindictive articles that he does not even read? Or did Tabarrok not understand the actual technical points in the article?
Moving on, Sichuan impulsively jumps to the least charitable interpretation of my statements, a pattern throughout his article.

Sichuan uses quotation marks for a word I never said. I did not say how the quality adjustments “should” be applied. It was an analysis of how they are done, and why they create percentages that no longer communicate meaning.
https://x.com/sichuan_mala/status/1974935561849978924
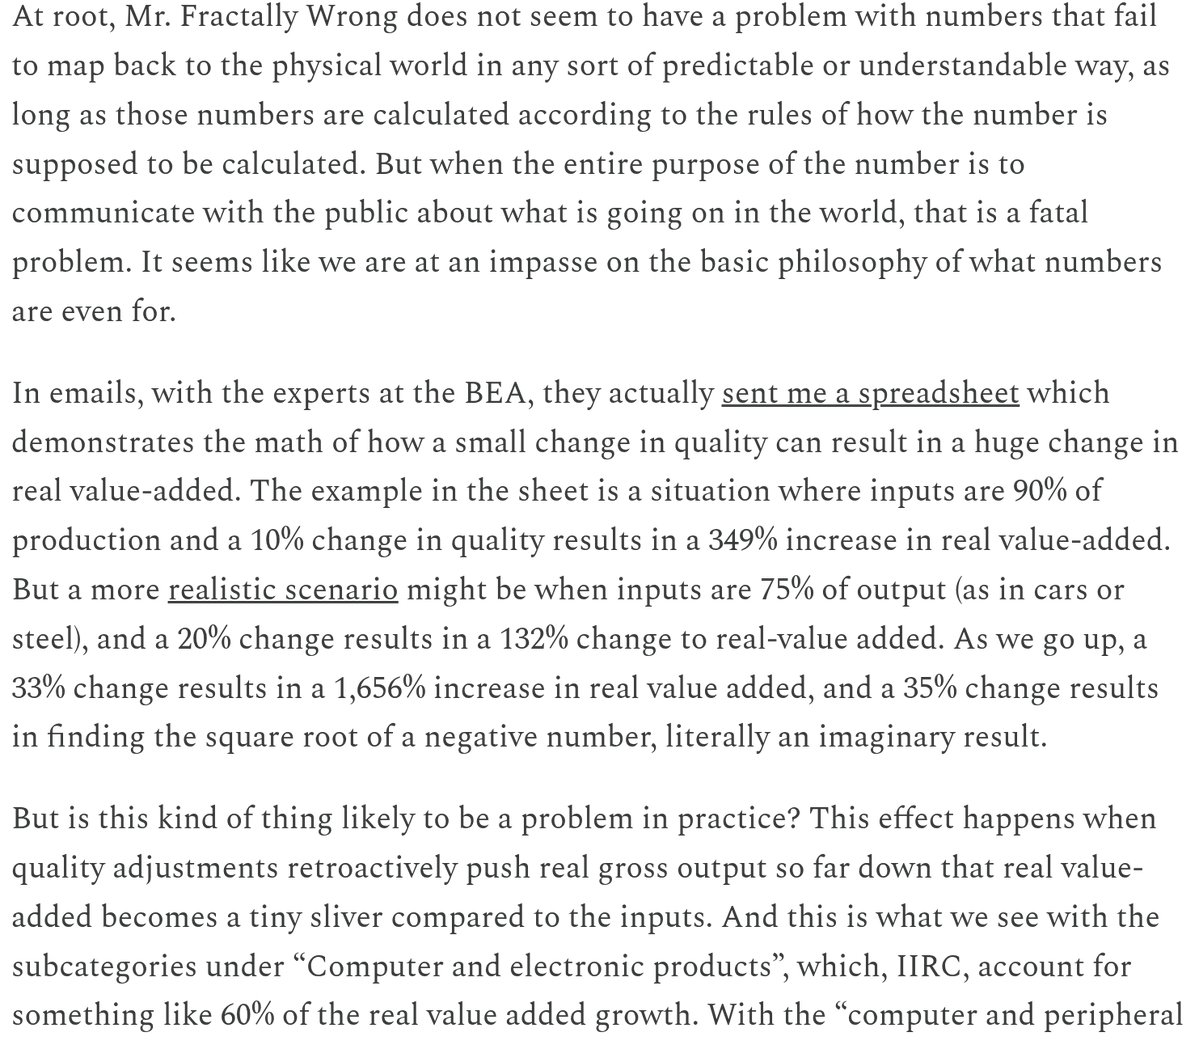
If you read my article, I go into much more detail and link to spreadsheets given to me by the BEA, showing how, say, a 33% improvement in product quality could result in a 1656% improvement in real value-added.
Sichuan does not see a problem with these unpredictable percentages, because there were papers written about it years ago and no one found a better method than double deflation. @benlandautaylor's great tweet applies here:
https://x.com/benlandautaylor/status/1975216443886367166
Sichuan makes an utterly preposterous criticism that I didn’t adjust international manufacturing data by PPP. PPP samples prices at the stores. It makes no sense to adjust U.S. manufacturing values based on the price of Chinese iPhones sold at Walmart.
https://x.com/sichuan_mala/status/1974935564320452627
At any rate, the adjustment he chooses would put China 3X ahead of America in manufacturing (instead of 62% ahead in nominal terms), making me at least directionally correct, not fractally wrong!
Also @sichuan_mala if you found a "production-side PPP" indicator in the PWT please link directly and screen-cap. "GDPo PPP" price level is not "production-side PPP" it is the output approach to GDP adjusted by standard PPP. You can't just hallucinate a label and apply it.

Sichuan is baffled by the "per-capita" data I cite, even when in his own screen-cap I say "American population", as per-capita usually means with GDP. American population data is not hard to find, and you too can do division at home!
https://x.com/sichuan_mala/status/1974935572688118213
Thus, if we have a non-per-capita output chart that is up 11% since 1997, then after adjusting for 23% U.S. population growth that of course gives you per-capita output being down 10%. The "hilarious error" is all his own.
https://x.com/sichuan_mala/status/1974935572688118213
I adjusted for American population growth because my baseline assumption for "not decline" is that manufacturing should keep up with population and its growing needs for laptops, refrigerators, cars, etc.
Starting from real gross output then analyzing inputs is a better approach than using the entirely unsuitable real value-added number which subtracts out far more than just imports. I'm not the only one who prefers this, see the former Mr. GDP:
https://x.com/sichuan_mala/status/1974935566115607031

Appallingly, Sichuan accuses of me of lying based on his own superficial and wrong reading of vehicle quality-adjustment documentation, when I actually read the whole thing and emailed the BLS to confirm my analysis.
https://x.com/sichuan_mala/status/1974935570796449951

The BLS does not directly adjust for longevity. Improvements that may impact longevity are tracked only by their resource cost. Costless design changes are not tracked.

In my original article, I gave the example of a costly change (adding a platinum-tipped spark plug) being tracked but a cost-less change (moving a part) would not be.
Adjusting directly for longevity "car lasts 10% longer, so treat that as 10% better" and adjusting for the manufacturer's cost of some small portion of the improvements that might impact longevity are very, very different things!

He also says only a few CPI categories are quality-adjusted, and these are documented, so what is the big deal? But manufacturing GDP data uses PPI, which in an email I had been told are ALL subject to quality adjustments, which are sparely documented.

After I dispose of aggregates, Sichuan accuses me of citing inconsistent and patchy sectoral data … to which I plead guilty! My article is an exhortation on the need for better data!

We do seem to have a basic stumbling block over what it means to “decline.” Not keeping up with peer competitors in high-tech is a form of decline, even if a country is making more CPU iops than in 1997.

Sichuan finishes by making a bunch of absurd and inaccurate projections of what must be going through my head rather than sticking to what is actually in my article.
https://x.com/sichuan_mala/status/1974935577083752629

There is much, much more in the full article. There are more points to rebut, more technical details to expound on. Curl up with your iPad and a cup of hot cocoa and read the whole thing!
rectifications.net/p/fractally-ri…
rectifications.net/p/fractally-ri…
Link to the article: rectifications.net/p/fractally-ri…
• • •
Missing some Tweet in this thread? You can try to
force a refresh


