I trade $SPY for a living...
This is one of my favorite ways to find A+ setups 🧵
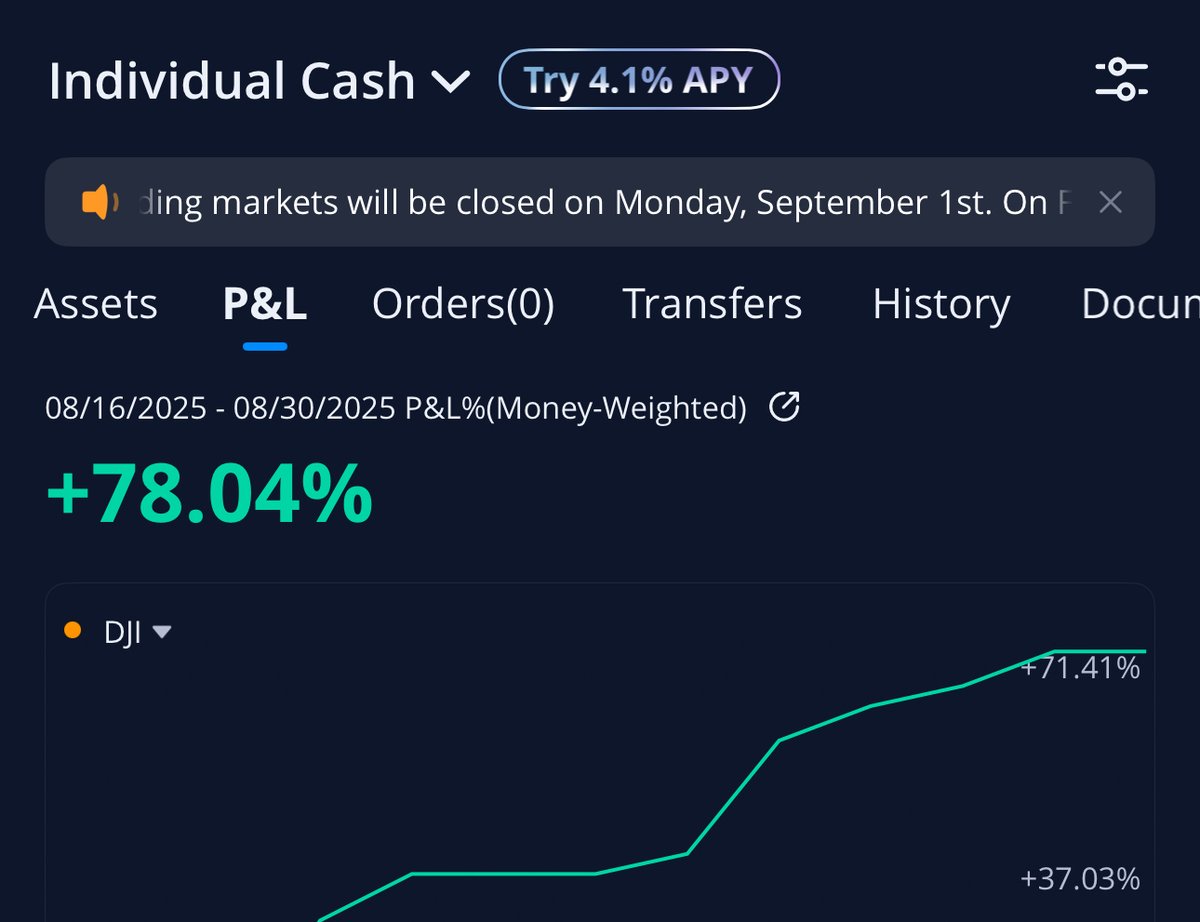
You've seen the daily payouts!
You've seen the big options trades!
You've seen the consistency day after day!
Now let's dive in and learn one of my go to plays 👇
This is one of my favorite ways to find A+ setups 🧵
You've seen the daily payouts!
You've seen the big options trades!
You've seen the consistency day after day!
Now let's dive in and learn one of my go to plays 👇


The goal of this thread is to show you how I identify key levels, confirm the break, enter the trend.
Identify key levels ✅
Confirm the break ✅
Enter the trend ✅
That is the only mission we are looking to accomplish with this setup when the market opens 👇
Identify key levels ✅
Confirm the break ✅
Enter the trend ✅
That is the only mission we are looking to accomplish with this setup when the market opens 👇


Identifying key levels ✅
Keep it simple and focus on these 4 levels ✍️
Previous Day High ✔️
Previous Day Low ✔️
Pre Market High ✔️
Pre Market Low ✔️
These are the levels price trades near every single day. So they offer plenty of opportunities.
Keep it simple and focus on these 4 levels ✍️
Previous Day High ✔️
Previous Day Low ✔️
Pre Market High ✔️
Pre Market Low ✔️
These are the levels price trades near every single day. So they offer plenty of opportunities.

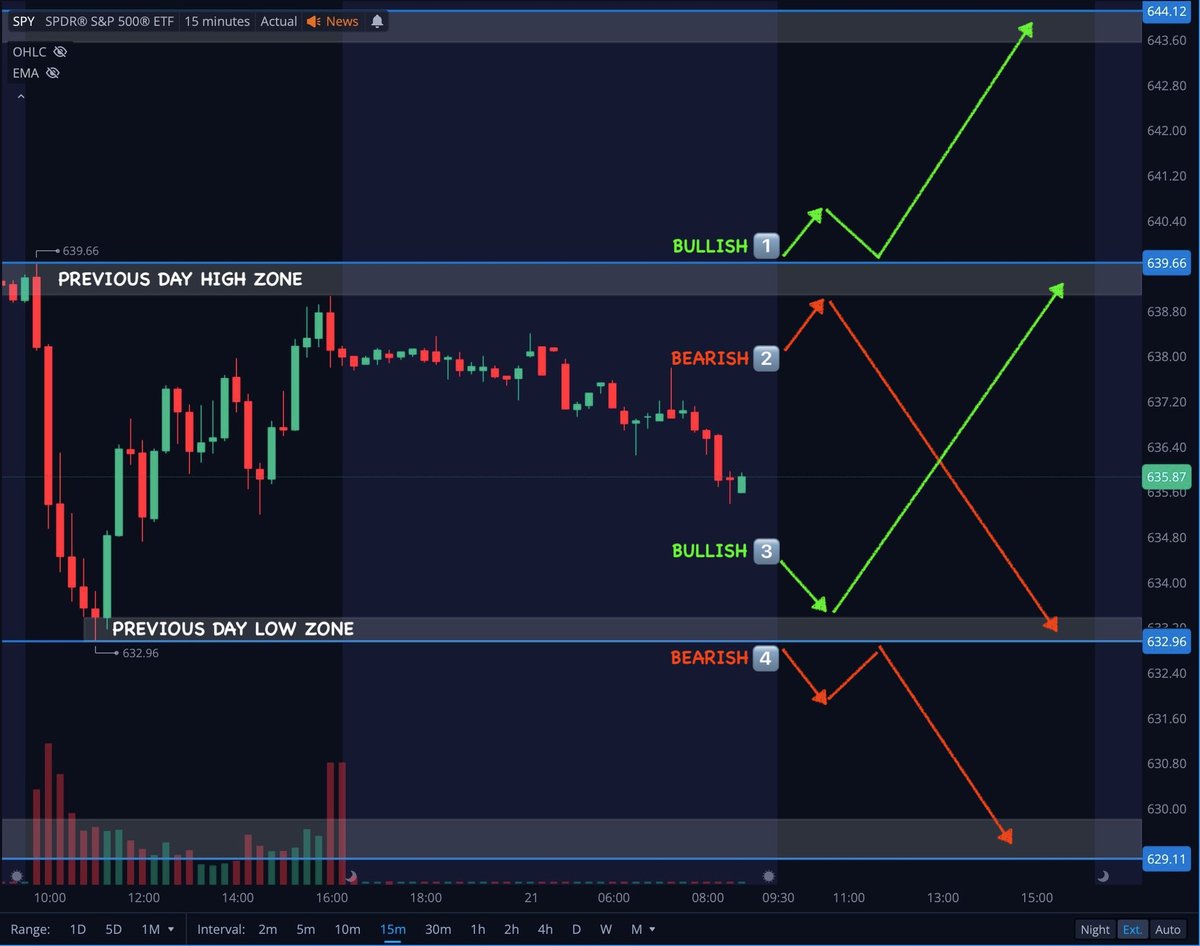
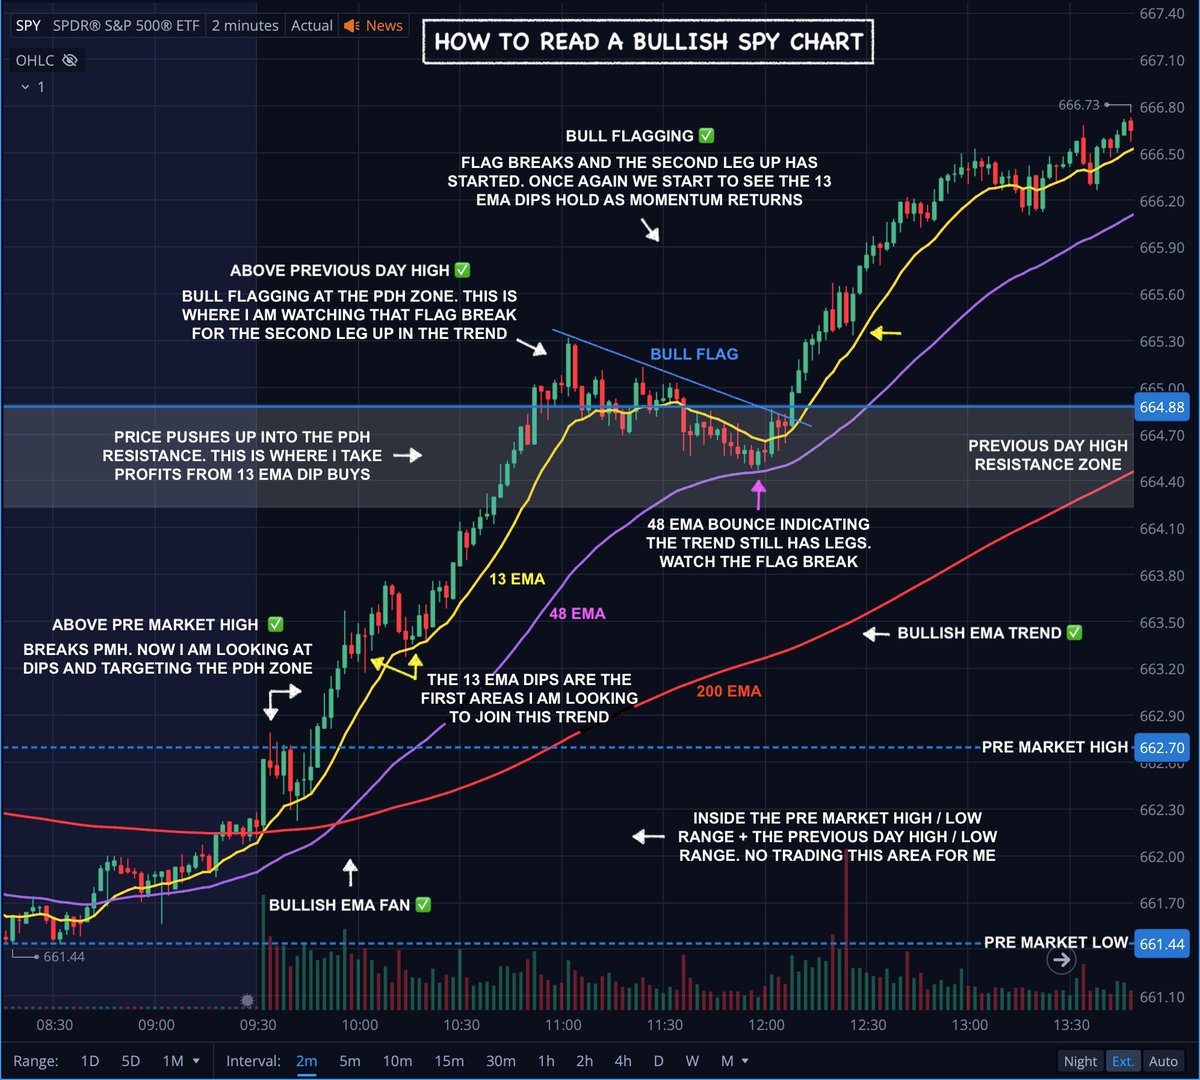
*Note - I like to make a zone using the Previous Day High & Low levels. These become the main areas of support & resistance I watch each day. (Image below)
Pre Market High & Low (4am to 9:30am EST) I keep as the secondary levels to watch.
Pre Market High & Low (4am to 9:30am EST) I keep as the secondary levels to watch.

Confirm the break ✅
Next step is to patiently watch these 4 levels until we get a 15 minute candle close above or below one of them.
Waiting for that 15 minute candle close above / below the level is how you confirm the break and avoid a lot of fake outs 👇
Next step is to patiently watch these 4 levels until we get a 15 minute candle close above or below one of them.
Waiting for that 15 minute candle close above / below the level is how you confirm the break and avoid a lot of fake outs 👇

Again... Let the 15 minute confirm the break👇

Enter the trend ✅
Once the key level breaks is time to enter the trend!
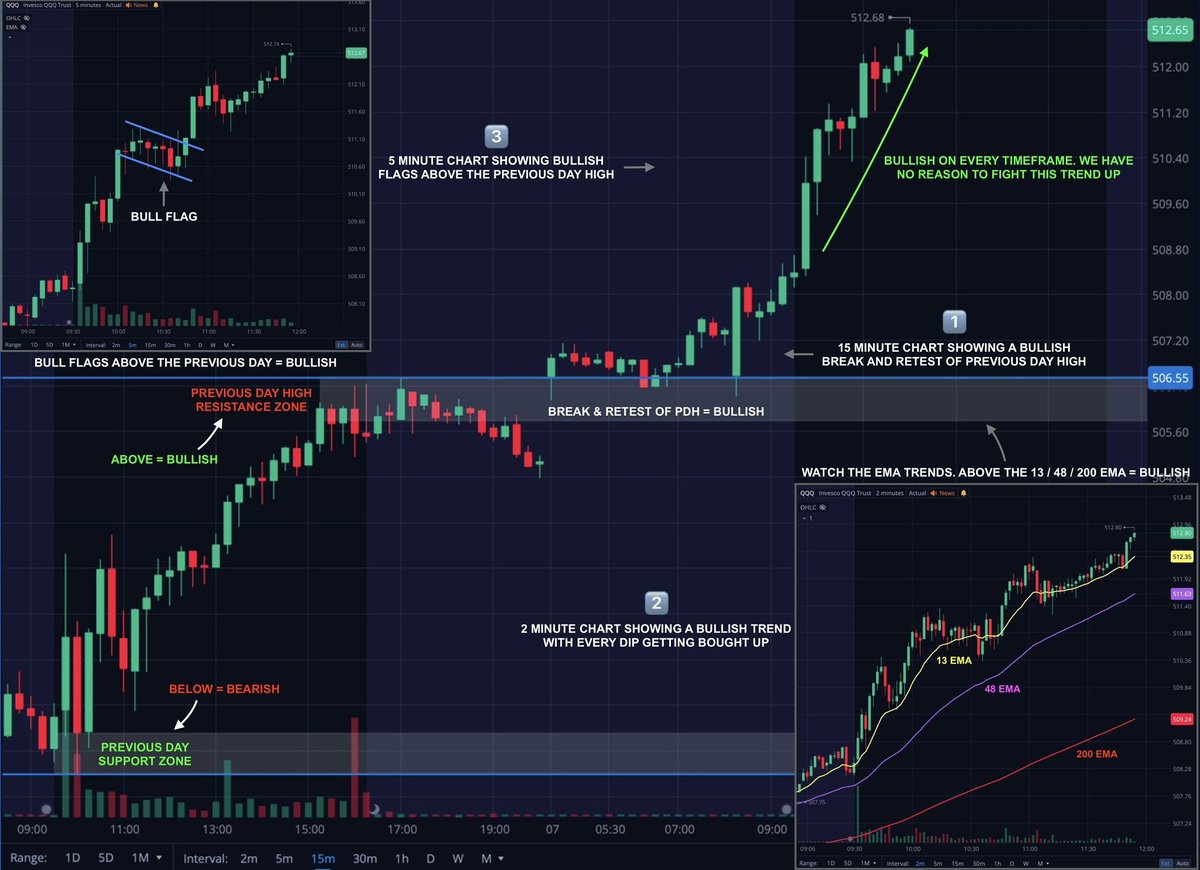
I do this with my EMA strategy on the 2 minute chart. When the level breaks it brings in enough one sided momentum to start buying the 13 EMA dips 👇
Once the key level breaks is time to enter the trend!
I do this with my EMA strategy on the 2 minute chart. When the level breaks it brings in enough one sided momentum to start buying the 13 EMA dips 👇

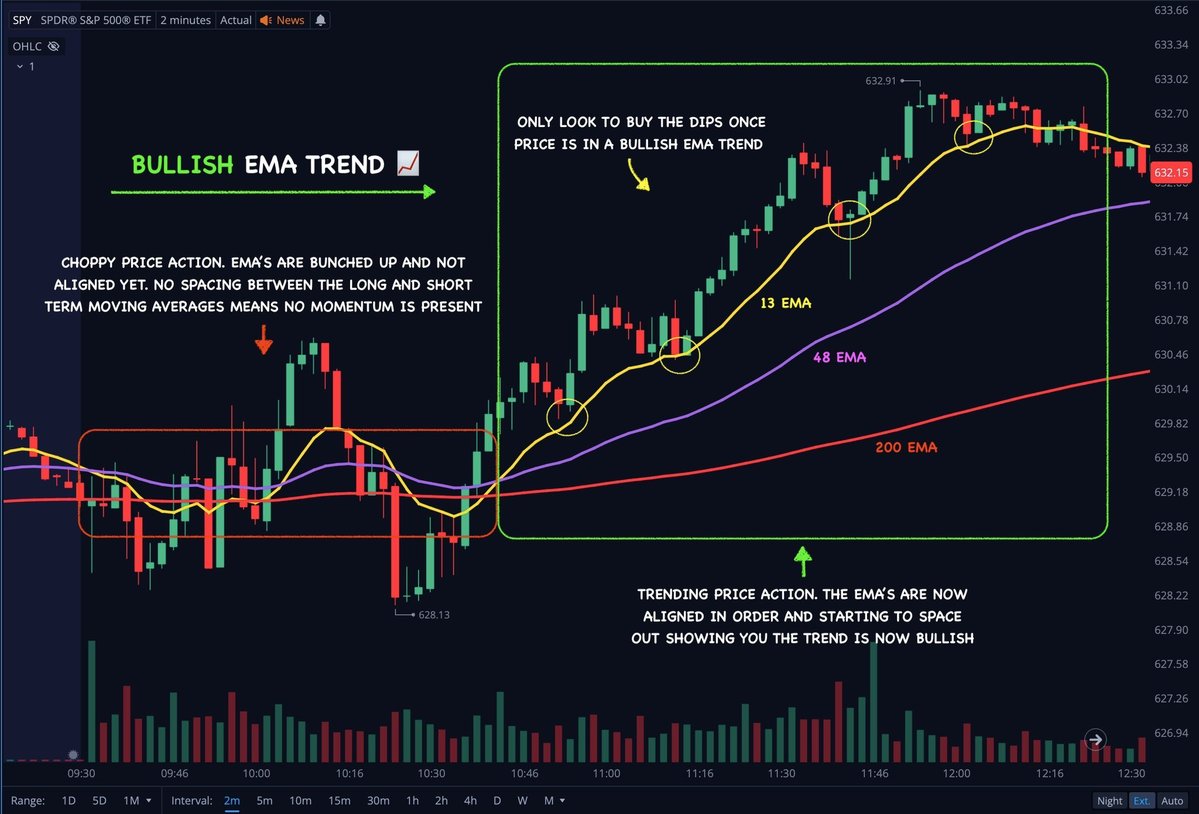
Ensure the EMA trend system is aligning with the level break. Here's how that works.
Add the 13 / 48 / 200 EMA's to the 2 minute chart.
Bullish EMA trend 📈
13 EMA on top 🟡
48 EMA in middle 🟣
200 EMA on bottom 🔴
Bearish EMA trend 📉
200 EMA on top 🔴
48 EMA in middle 🟣
13 EMA on bottom 🟡
Now...
When those 3 EMA's tightly stacked or braided together it's a clear indication of chop / lack of momentum.
When those 3 EMA's start to space out and drift apart it's a clear indication of trend / momentum coming in.
Aim to buy dips when the level breaks and the EMA trend system is showing momentum 👇


Example of a trade on $SPY calls...
Watching PMH ✅
15 minute close ✅
13 EMA pullback ✅
Watching PMH ✅
15 minute close ✅
13 EMA pullback ✅


Check out this one on $SPY puts...
Watching PDL support ✅
Confirm the break ✅
Enter the trend ✅
Note all the momentum that pours in instantly after our entry alert! This is because we are letting the level break + EMA trend align 👇
Watching PDL support ✅
Confirm the break ✅
Enter the trend ✅
Note all the momentum that pours in instantly after our entry alert! This is because we are letting the level break + EMA trend align 👇


Another example of timing that momentum on $QQQ using the same simple process 👇

$IWM puts... Rinse & Repeat 👇


$SPY calls... Rinse & Repeat ♻️
Identify key levels ✅
Confirm the break ✅
Enter the trend ✅
Identify key levels ✅
Confirm the break ✅
Enter the trend ✅


This setup is simple & repeatable week after week!
If I could only trade 1 setup for the rest of my life this would be it!
Thanks for reading and I know this will be a game changer for many who apply it.
Have a great weekend 🤙
If I could only trade 1 setup for the rest of my life this would be it!
Thanks for reading and I know this will be a game changer for many who apply it.
Have a great weekend 🤙
• • •
Missing some Tweet in this thread? You can try to
force a refresh