🧑💻 THE KEY STAT WHERE SOUTH AFRICA ARE IN A LEAGUE OF THEIR OWN 🇿🇦
When reviewing the stats for men’s test rugby in 2025, I stumbled upon one metric that demonstrates just how far ahead the #Springboks are of the rest
Let me explain… 🧵
When reviewing the stats for men’s test rugby in 2025, I stumbled upon one metric that demonstrates just how far ahead the #Springboks are of the rest
Let me explain… 🧵

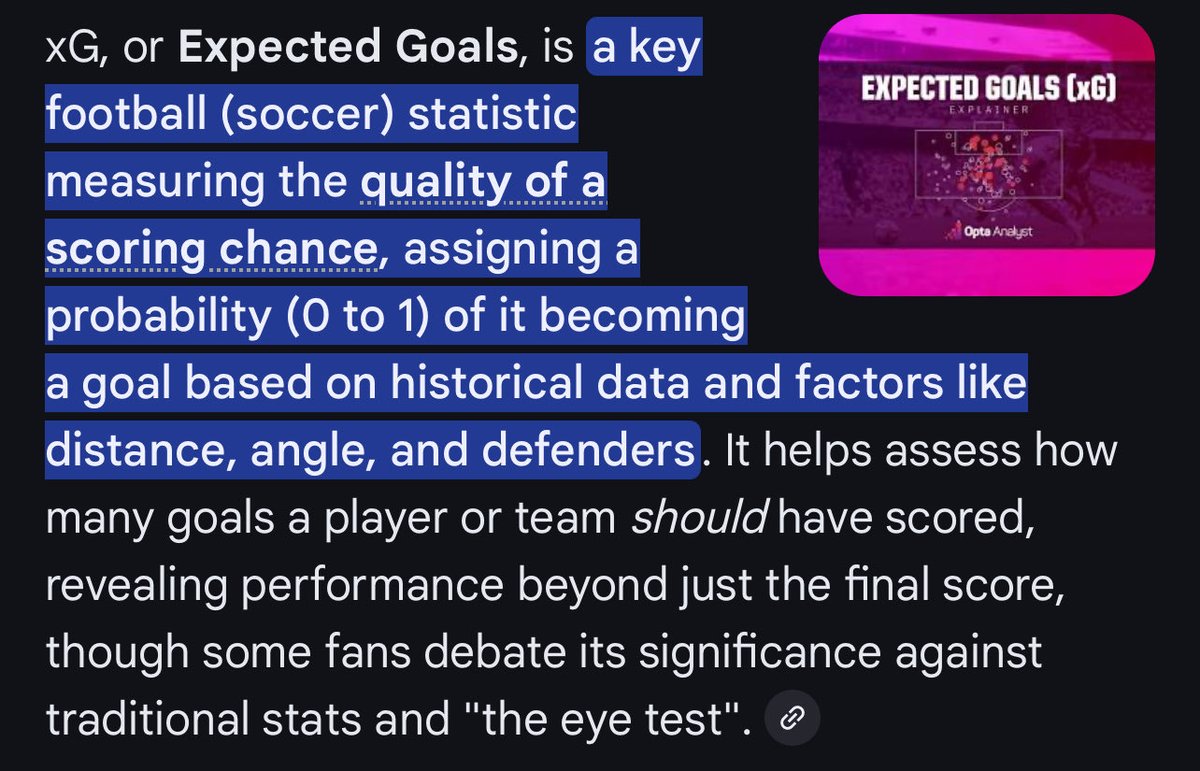
For a while now I’ve been searching for rugby’s equivalent of xG ⚽️
The stat that tells us how a team is performing against the quality of chances they’re creating
There have been attempts by companies like Opta 🧑🔬 but I think I’ve found something does the job the nicely…
The stat that tells us how a team is performing against the quality of chances they’re creating
There have been attempts by companies like Opta 🧑🔬 but I think I’ve found something does the job the nicely…
22m conversion 📊
You’ve no doubt heard it mentioned before, but probably only in relation to one team in a single game/a small handful of games
Rarely is it mentioned as a global picture - a benchmark to measure all teams by 📏
You’ve no doubt heard it mentioned before, but probably only in relation to one team in a single game/a small handful of games
Rarely is it mentioned as a global picture - a benchmark to measure all teams by 📏
I took the 22 conversion for every game played by a T1 test side and plotted them against the number of 22 entries for the same games 💻
Looks like random dots, right? 😵💫
Looks like random dots, right? 😵💫

It doesn’t get any better ❌ if we break it down by nation and include both ‘for’ and ‘against’ data
No real patterns emerging, each game looks to be totally independent from the others 🤷
No real patterns emerging, each game looks to be totally independent from the others 🤷


However, it all starts to come together when we start taking averages 🧮
If we average the 22 entry conversion of each T1 side for every game played in 2025
Then all 12 teams are between 2.6 and 3.8 points per entry
The total number of 22 entries, however, is far more variable
If we average the 22 entry conversion of each T1 side for every game played in 2025
Then all 12 teams are between 2.6 and 3.8 points per entry
The total number of 22 entries, however, is far more variable
This is the important bit: there is a specific range we can expect a test side’s 22 conversion to be
Mean average = 2.9
Median average = 2.8
Standard deviation = 0.36
I even sanity checked against just tries to eliminate goal kicking as a variable, the graph looked the same 🎯
Mean average = 2.9
Median average = 2.8
Standard deviation = 0.36
I even sanity checked against just tries to eliminate goal kicking as a variable, the graph looked the same 🎯
What this gives us is a way to predict a team’s outcomes over a season
i.e. are they getting a lot of 22 entries? If so the odds are the points will at some point start to flow 👍
It is very unlikely for a team to over perform the average 22 conversion rate in every single game
i.e. are they getting a lot of 22 entries? If so the odds are the points will at some point start to flow 👍
It is very unlikely for a team to over perform the average 22 conversion rate in every single game
So, let’s go back to looking at it team by team
We see that, despite some big variations, we can draw a line ✍️ through the box plot of every nation, again suggesting that over a season, all teams coalesce around an average
All teams except one: South Africa 🇿🇦
We see that, despite some big variations, we can draw a line ✍️ through the box plot of every nation, again suggesting that over a season, all teams coalesce around an average
All teams except one: South Africa 🇿🇦

The Springboks consistently outperformed the rest in 22 conversion across their 15 tests in 2025
In fact, there was only 1 game where they significantly underperformed the average: the loss to Australia at Ellis Park 🫢
In that game they had 13 22 entries - well above average
In fact, there was only 1 game where they significantly underperformed the average: the loss to Australia at Ellis Park 🫢
In that game they had 13 22 entries - well above average
Just to emphasise ‼️
South Africa’s numbers actually affect the overall averages significantly
Their average 22 conversion is 0.5 points better than anyone else, a relatively huge gap
And as we’ll see later, that excellence is present in both attack and defence… 🛡️
South Africa’s numbers actually affect the overall averages significantly
Their average 22 conversion is 0.5 points better than anyone else, a relatively huge gap
And as we’ll see later, that excellence is present in both attack and defence… 🛡️
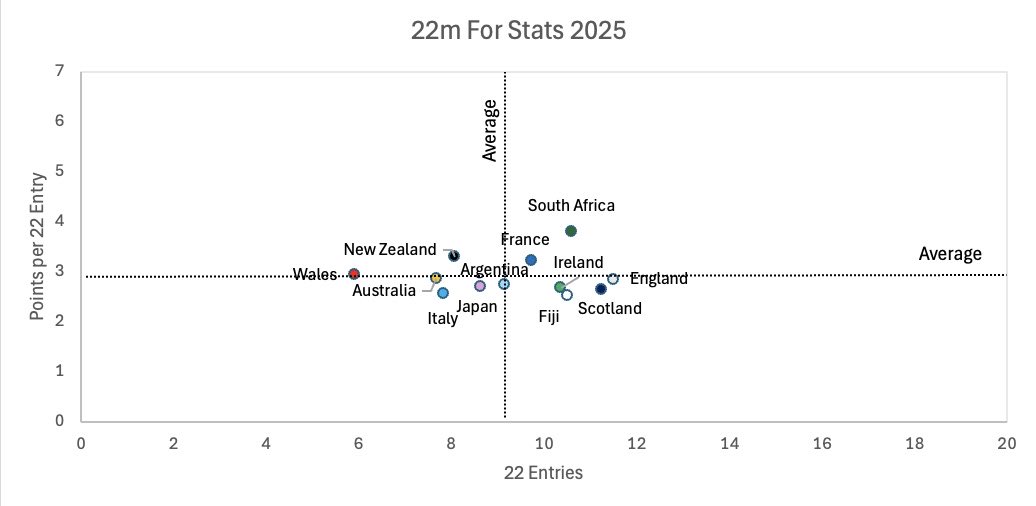
So, who else catches the eye from these stats?
No surprise that Six Nations champions France 🇫🇷 are above average for both 22 entries per match and 22 entry conversion
Italy 🇮🇹 are poor in both metrics, but to be fair to them they did play against South Africa 3 times!
No surprise that Six Nations champions France 🇫🇷 are above average for both 22 entries per match and 22 entry conversion
Italy 🇮🇹 are poor in both metrics, but to be fair to them they did play against South Africa 3 times!
England 🏴 are roughly bang on the average for 22 conversion but are well above average for 22 entries per game 👀
This speaks to the highly data driven approach Steve Borthwick is known for
“If we get down to their 22 enough times, we will eventually score the points” 🧠
This speaks to the highly data driven approach Steve Borthwick is known for
“If we get down to their 22 enough times, we will eventually score the points” 🧠
Interestingly, both New Zealand and Australia have decent or even above average 22 conversion
But they struggle to rack up the 22 entries, suggesting territory management is their weakness 🗺️
The #AllBlacks best 3 games for 22 entries all came in the series against France… 😬
But they struggle to rack up the 22 entries, suggesting territory management is their weakness 🗺️
The #AllBlacks best 3 games for 22 entries all came in the series against France… 😬
Something else we can consider is the 22 entries & conversion ‘against’ or ‘how good are the opportunities teams are giving their opposition?’
Again, the Springboks are outstanding - fewest entries conceded and fewest points conceded per entry 🔥
Most others are tightly bunched
Again, the Springboks are outstanding - fewest entries conceded and fewest points conceded per entry 🔥
Most others are tightly bunched

Unsurprisingly, by far the worst team of the T1 nations is Wales 🏴
Their 22 conversion rate is actually ok, but they’re only averaging 5.9 entries per match - well below average
Their metrics against are frankly hopeless, they are expected to concede around 35 points per match
Their 22 conversion rate is actually ok, but they’re only averaging 5.9 entries per match - well below average
Their metrics against are frankly hopeless, they are expected to concede around 35 points per match
Scotland 🏴 & Fiji 🇫🇯 fans:
Sorry guys, your stats are skewed upwards by how many T2 nations you play against
To be fair, Fiji are actually broadly consistent no matter who they face, T1 or T2!
Scotland… less so 🫠
Sorry guys, your stats are skewed upwards by how many T2 nations you play against
To be fair, Fiji are actually broadly consistent no matter who they face, T1 or T2!
Scotland… less so 🫠
Final takeaways? 📖
This stat is not *perfect* but we can say that because 22 conversion tends to average out across a season ⚖️ total 22 entries are a great way to assess a team’s sustainable success
And that’s why we all should be worried about England… very worried! 😱
This stat is not *perfect* but we can say that because 22 conversion tends to average out across a season ⚖️ total 22 entries are a great way to assess a team’s sustainable success
And that’s why we all should be worried about England… very worried! 😱

• • •
Missing some Tweet in this thread? You can try to
force a refresh