Okay so I've talked to several of the modelers about this and I want to just give a sort of public report for posterity on the state of the public xG models and the NHL shot tracking changes (2023) that have influenced them as I understand it now. 🧵
https://twitter.com/CJTDevil/status/2006940923117412835
Okay so what happened? To understand that, I think we need to know which models did NOT fall out of tune. I examined xG models from Hockeyviz (McCurdy), Evolving-Hockey (Younggrens), Moneypuck (Tanner), HocketStats (Bacon), NaturalStatTrick (Timmins), and Hockeyanalsis (Johnson)
The two models that remained largely in tune were Hockeyviz and Hockeyanalysis. The BIGGEST difference between their models and the others was the training set. They both explicitly exclude the pre-chip tracking data through different mechanisms.
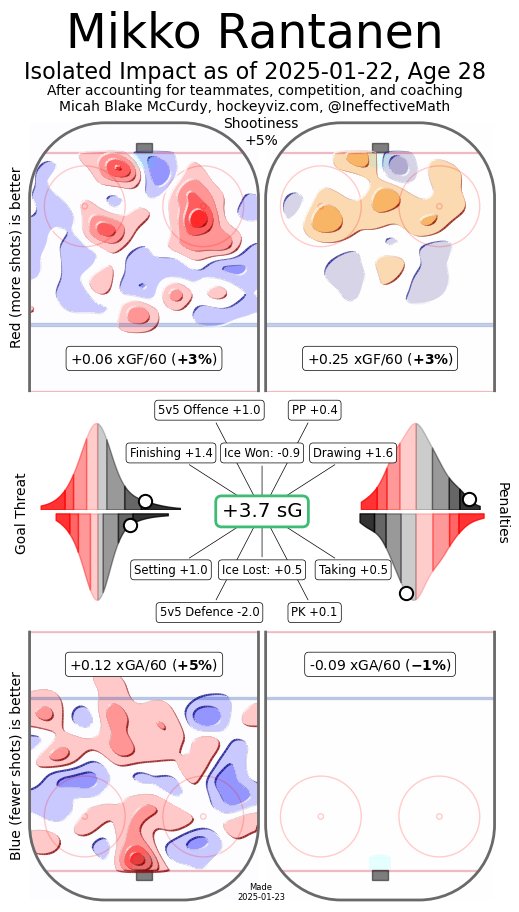
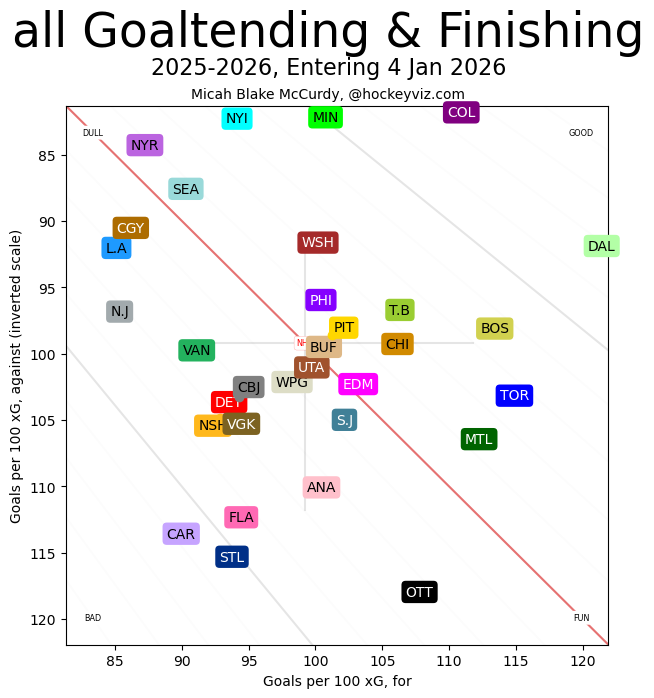
@Hockeyviz is trained on a rolling 1312 game set (). So, currently, this model is trained on, basically, the calendar year 2025. And it is performing pretty close to expected. The grey crosshair is pretty close to 100/100 which would be perfectly in tune. bsky.app/profile/hockey…
But I think the award for the best approach goes to @hockeyanalysis who did two major things. ()
1) Explicitly trained on only chip-tracking data (2023-2024 and on)
2) Excluded "new" shot types. More on that next.bsky.app/profile/hockey…
1) Explicitly trained on only chip-tracking data (2023-2024 and on)
2) Excluded "new" shot types. More on that next.bsky.app/profile/hockey…
I have to plug some great work here by @LadyO_TreeSyrup that I've confirmed from sources inside the NHL is basically dead on accurate and will explain a little of the next weird tidbit puckovertheglass.substack.com/p/a-brief-hist…
Aaron (and David) IDed that there are 2 new shot designations biasing the data: "failed bank shots" and "short" shots are never Gs, but do produce xGs which causes xG inflation. How much? According to my research, it's explains about 30% of the gap that we see between Gs and xGs.
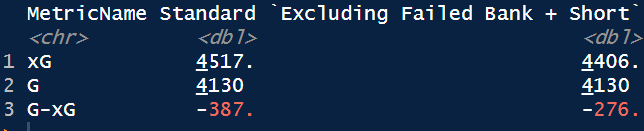
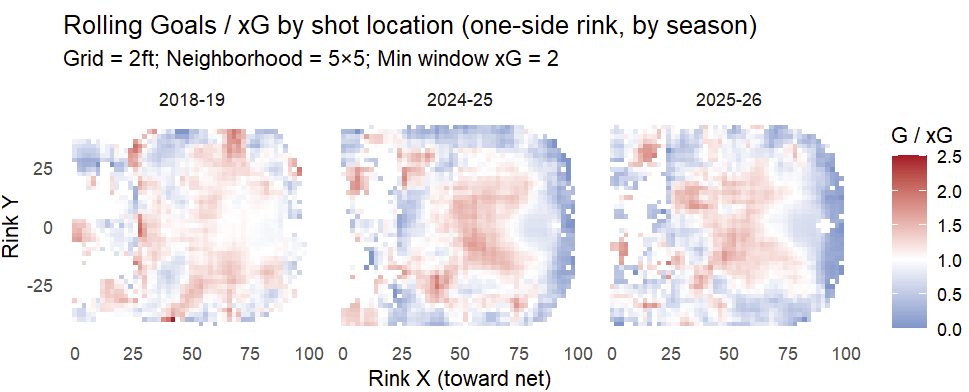
This is substantial, but we're still missing ~70%, this year (not quite as much last 2 years). Whether we have those shots or not, there is a fundamental warping of the goals per xG at various danger levels, and we can see a warping of the fabric of the OZ. I'll elaborate below.
This is all data from January 4th of each season. The past two years and an arbitrary randomly selected pre-tracking season. Ideally, this blue line is horizontal at 1. In 2018-19, it's fine. Then this season and last. You can see the problem.
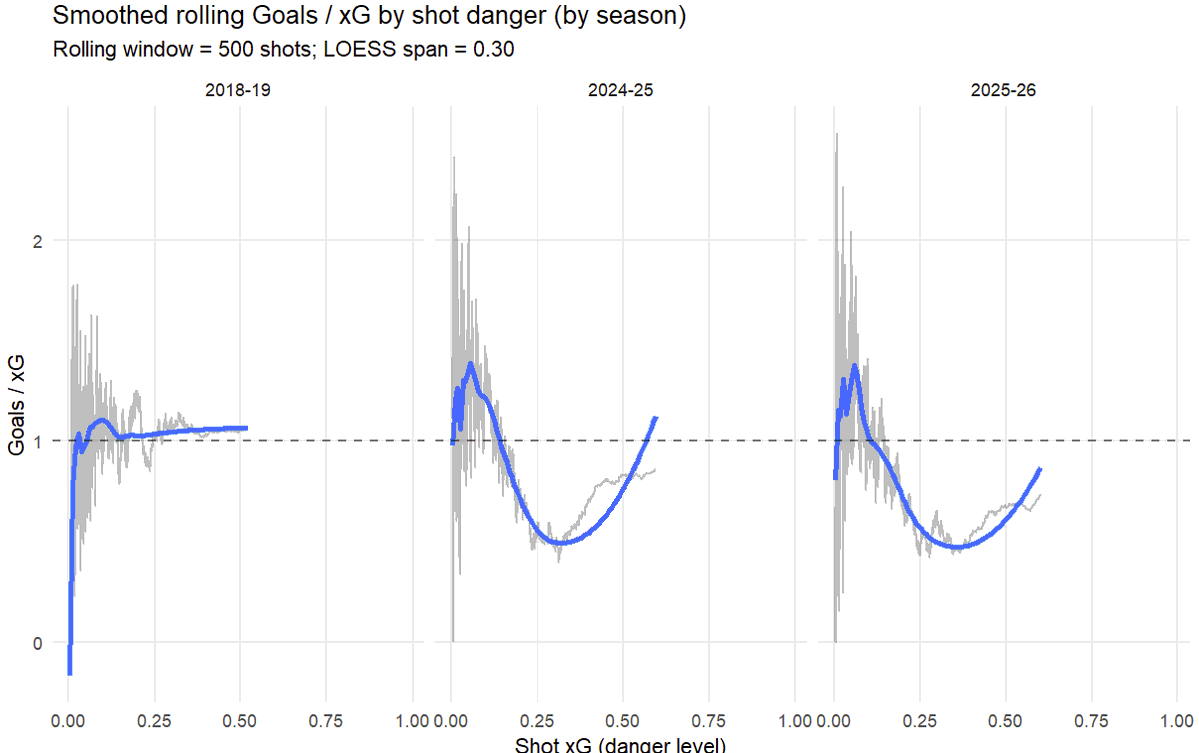
What is happening? Well if we compare this year to 2018-19, the big difference is that thos shots from the low slot have moved closer to the net that little movement is actually HIGHLY consequential as it relates to xGs.
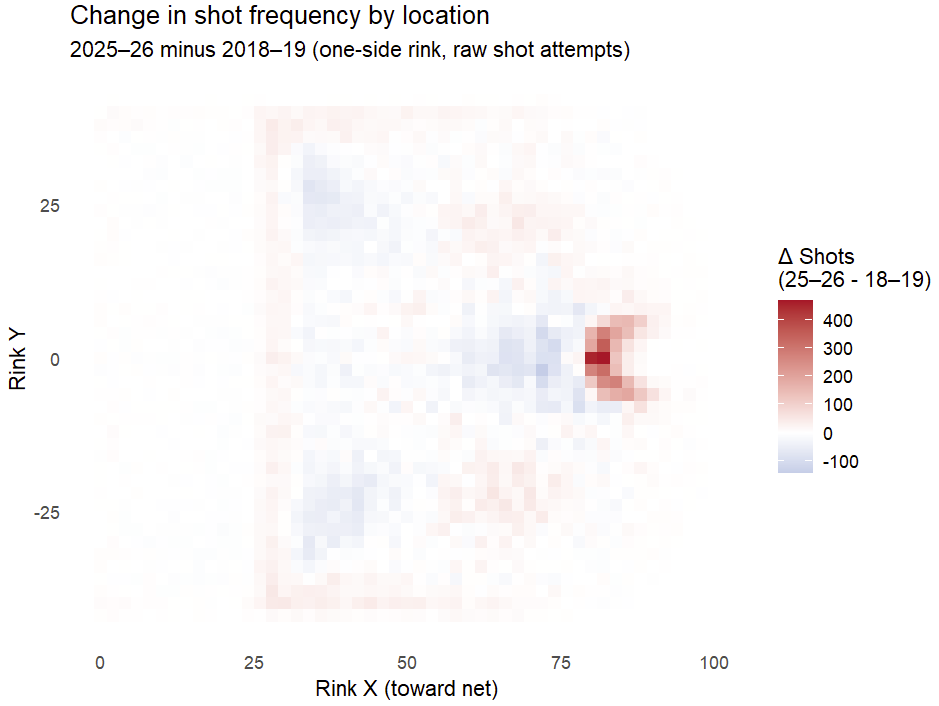
This is producing a warping effect where the slot shots are now actually over-converting, but the far more consequentially high-xG "crease" shots are WAY underconverting.
Having said all of this, THIS SEASON, is somewhat substantially worse in terms of xG overestimation than the previous two tracking seasons. I'm told that at least one private company has observed this as well, I've heard it hypothesized that there may be "organic" causes
For instance, powerplays seem to interact differently than 5v5 with this data and those adapt very quickly as the league learns new things. And the tight schedule from the olympics may impact things. I'm, candidly, not sure what to make of this and open to thoughts. REGARDLESS:
The xG warping described above is consistent across all post-tracking seasons. It's is clear now (and IMO, has been for 2 years), that we cannot rely on pre-chip tracking data to inform our modern xG models. It's a fundamentally different mechanism. So where are we with that?
@EvolvingWild have been remaking their xG model for 2 years and will implement a 5-year rolling window which will eventually phase out this bad data (a long-trail version of what @HockeyViz already does)
bsky.app/profile/evolvi…
bsky.app/profile/evolvi…
@MoneyPuckdotcom has already made some corrections. I'm not sure that the culprit has much to do with tips/deflections so much as the locations that tips/deflections come from, but retraining on current data is good!
https://x.com/MoneyPuckdotcom/status/2007637926604353673
I don't want to speak for them, but based on this tweet, (x.com/JFreshHockey/s…)
it certainly seems that HockeyStats.com has updated their model in comparison to what I had for them just a few days ago.
it certainly seems that HockeyStats.com has updated their model in comparison to what I had for them just a few days ago.
@NatStatTrick's model is somewhere in between in terms of the overestimation and I don't know what their plans are. @HockeyViz is kinda self-cleaning. And IMO @hockeyanalysis doesn't need to change much of anything right now.
There's PLENTY more work do be done here and I'm sure I got things wrong. But I've had a lot of convos over the past day or two and I wanted to consolidate it so that everything I've learned (which isn't to say everything that matters) is in one place.
That's all for now.
/End
That's all for now.
/End
@threadreaderapp unroll
• • •
Missing some Tweet in this thread? You can try to
force a refresh