Neil Mehrotra Profile picture
Mar 3 5 tweets 1 min read Read on X
It is still early, but the energy market response to war in the Persian Gulf has been moderate with Brent oil up to $83/barrel. While much of the focus has been on oil markets, natural gas seems the bigger upside risk. 1/5
Some oil flows can be redirected if the Strait of Hormuz is closed. Countries like the US and China can draw down on strategic reserves, and China seems have significantly increased its reserves recently. More Russian barrels may be allowed to reach market. 2/5
LNG from Qatar (20% of global exports), on the other hand, cannot be easily redirected. The US is constrained by export capacity to further increase LNG exports. Closure of the strait or damage to Qatar LNG production could greatly reduce export volumes. 3/5
The US economy is likely somewhat insulated from events in the Gulf given constraints on natural gas export capacity, strategic reserves, and favorable terms of trade effect. 4/5
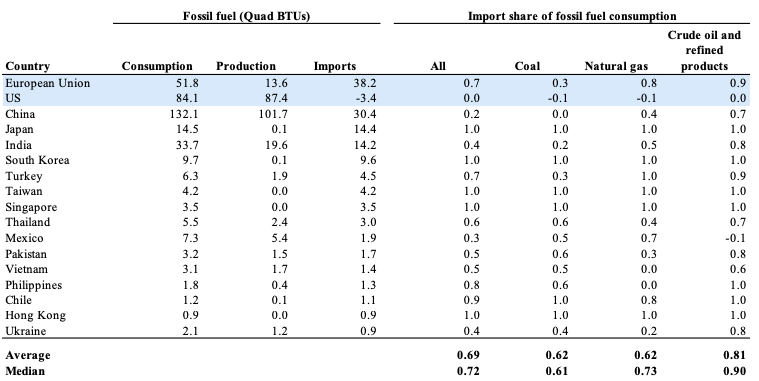
Most other countries are not. The table below shows the 15 largest fossil fuel importers and the US and EU for comparison. The median country imports 73% of its natural gas consumption and 90% of it oil and refined products consumption: 5/5 Image

• • •

Missing some Tweet in this thread? You can try to force a refresh
 

Keep Current with Neil Mehrotra

Neil Mehrotra Profile picture

Stay in touch and get notified when new unrolls are available from this author!

Read all threads

This Thread may be Removed Anytime!

PDF

Twitter may remove this content at anytime! Save it as PDF for later use!

Try unrolling a thread yourself!

how to unroll video
  1. Follow @ThreadReaderApp to mention us!

  2. From a Twitter thread mention us with a keyword "unroll"
@threadreaderapp unroll

Practice here first or read more on our help page!

More from @neilmehrotra

Sep 28, 2023
This morning, the Bureau of Economic Analysis (BEA) released its latest benchmark revisions for the national income and product accounts. 🧵on the work that goes into BEA's efforts to measure the economy: 1/14
As part of our Brookings Paper assessing the climate provisions of the Inflation Reduction Act, we looked at recent trends in power investment in the US, first turning to BEA’s estimates of investment in electric power structures: 2/14 brookings.edu/articles/econo…
I noticed that their data showed a steady increase in the price index for investment in electric power structures in the 2010s. This seemed odd given the price declines in wind and solar power over the previous decade: 3/14 Image
Read 14 tweets

Did Thread Reader help you today?

Support us! We are indie developers!


This site is made by just two indie developers on a laptop doing marketing, support and development! Read more about the story.

Become a Premium Member ($3/month or $30/year) and get exclusive features!

Become Premium

Don't want to be a Premium member but still want to support us?

Make a small donation by buying us coffee ($5) or help with server cost ($10)

Donate via Paypal

Or Donate anonymously using crypto!

Ethereum

0xfe58350B80634f60Fa6Dc149a72b4DFbc17D341E copy

Bitcoin

3ATGMxNzCUFzxpMCHL5sWSt4DVtS8UqXpi copy

Thank you for your support!

Follow Us!

:(