
This Cato ‘immigrants pay more taxes’ flex + Indian chart is peak cherry-picking. Impressive numbers… until you actually look under the hood. 🧐”
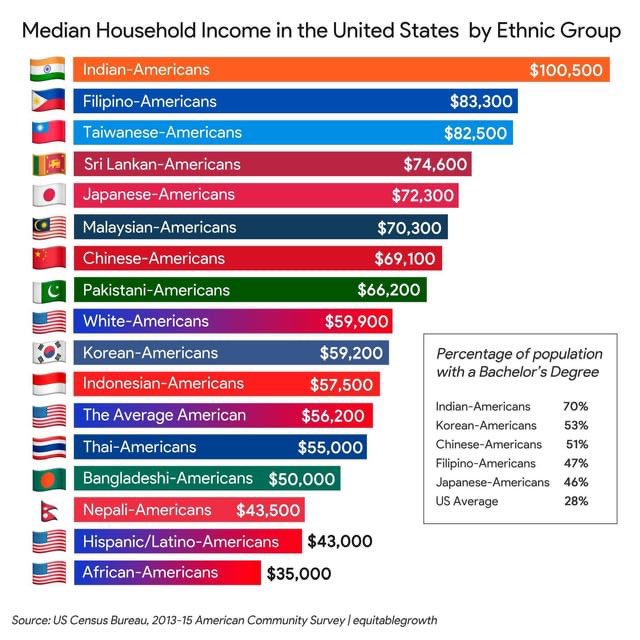
1. It’s median household income, not individual or per-capita — and Indian households are structured differently
• The chart (and the “twice as much” claim) uses households, not people. Indian-American households are larger on average (~3.0–3.8 people vs. U.S. average ~2.5) and far more likely to have multiple full-time high earners (dual STEM/medical professionals is common). en.wikipedia.
• Indian Americans still have high personal earnings (median ~$85k for ages 16+, ~$106k for full-time workers per 2023 Pew), but the “almost twice” headline evaporates when you adjust for household size and number of workers. This is a classic statistical sleight-of-hand when comparing groups with different living arrangements.
2. Extreme positive selection bias … this is the cream of India’s elite, not “immigrants” in general
• Indian Americans aren’t a random sample of India’s 1.4 billion people. The vast majority arrived via H-1B, EB-2/3, or student visas …hyper-selective for advanced degrees and high-skill jobs. You’re comparing the top ~0.1–1% of India’s talent/IQ/education distribution to the broad U.S. average (which includes everyone from McDonald’s workers to retirees).
• India’s own per-capita income and education levels are far lower. This doesn’t prove broad immigration is economically magical; it proves cherry-picked high-skill immigration works for the selectees. Second-generation outcomes are strong but show some regression toward the mean, and chain migration/family sponsorship often dilutes the skill level over time.
3. Cato’s overall “immigrants pay more taxes” claim has well-documented methodological holes
• Cato (a libertarian think tank that favors more immigration) attributes welfare benefits received by U.S.-born children of immigrants to “natives,” not the immigrant parents. This understates immigrant fiscal costs. The Center for Immigration Studies (CIS) and others note this flips the picture: when you count the full household burden (including kids), immigrant-headed households use welfare at higher rates than native-headed ones.
• Cato aggregates all immigrants (high-skill Indians + low-skill groups + illegals). The net positive they find is heavily driven by the high earners. Other studies (National Academies of Sciences, Heritage, etc.) have found first-generation immigrants often impose net costs, especially low-skilled/illegal cohorts.
• Their data ends before the post-2021 border surge effects fully hit long-term budgets.
4. H-1B-specific issues (the main pipeline for Indian success)
• Many Indian immigrants in tech come via H-1B, which has documented problems: outsourcing/body shops (e.g., Infosys, TCS), wage suppression (foreign workers often paid less for similar roles), and ethnic nepotism once Indians reach management (preferring co-ethnics for hiring/promotions). This displaces U.S. workers and depresses wages in STEM.
• Fraud allegations are common (fake credentials, benching workers, etc.). Critics argue this isn’t “adding value” so much as arbitraging cheaper labor and networks.
5. Other drains and context
• Remittances: Indian Americans send massive sums back to India (India receives over $100B+ in remittances annually, a huge chunk from the U.S.). That’s money leaving the U.S. economy.
• Cost of living: Indians are heavily concentrated in high-cost metros (SF Bay, NYC, etc.), where nominal incomes are inflated anyway. Adjust for purchasing power and the gap shrinks.
• The post uses Indian success to defend a general “immigrants = net positive” narrative from Cato. But Indians are ~1.4% of the U.S. population and an outlier. Broad policy implications (more low-skill immigration, open borders, etc.) don’t follow from one high-performing subgroup.
https://x.com/SanDiegoKnight/status/2048786392575029583
Bottom line: The raw numbers on Indian achievement are real and impressive — selective high-skill immigration from India has produced strong economic outcomes for that group. But the post overreaches by using an old household-income chart + a contested Cato aggregate study to imply broad immigration is unambiguously great or that Indians represent “typical” immigrants. It’s cherry-picking + statistical framing.
• • •
Missing some Tweet in this thread? You can try to
force a refresh


