
Thread on risk management in general and in derivatives relative value in particular, because this generated a lot of interesting discussion. (1/n)
https://twitter.com/bennpeifert/status/2058214546905674170
First and foremost in derivatives, we think about stress tests -- how the portfolio might perform in a wide range of market moves, both broad-based (e.g. equities down 20%) and with respect to basis risks held in the book.
Slide risk with respect to the major risk markets affecting a portfolio is central. For example, moving equities up and down while shifting volatility surfaces in a variety of different ways (more or less vol response, more or less term structure inversion, etc). 

Using a variety of calibrations of volatility surface moves for a given spot shift is critical, otherwise it can lead a portfolio manager to game the assumptions of the risk system. Gives a sense of the basis risk embedded in the convexity of a portfolio.

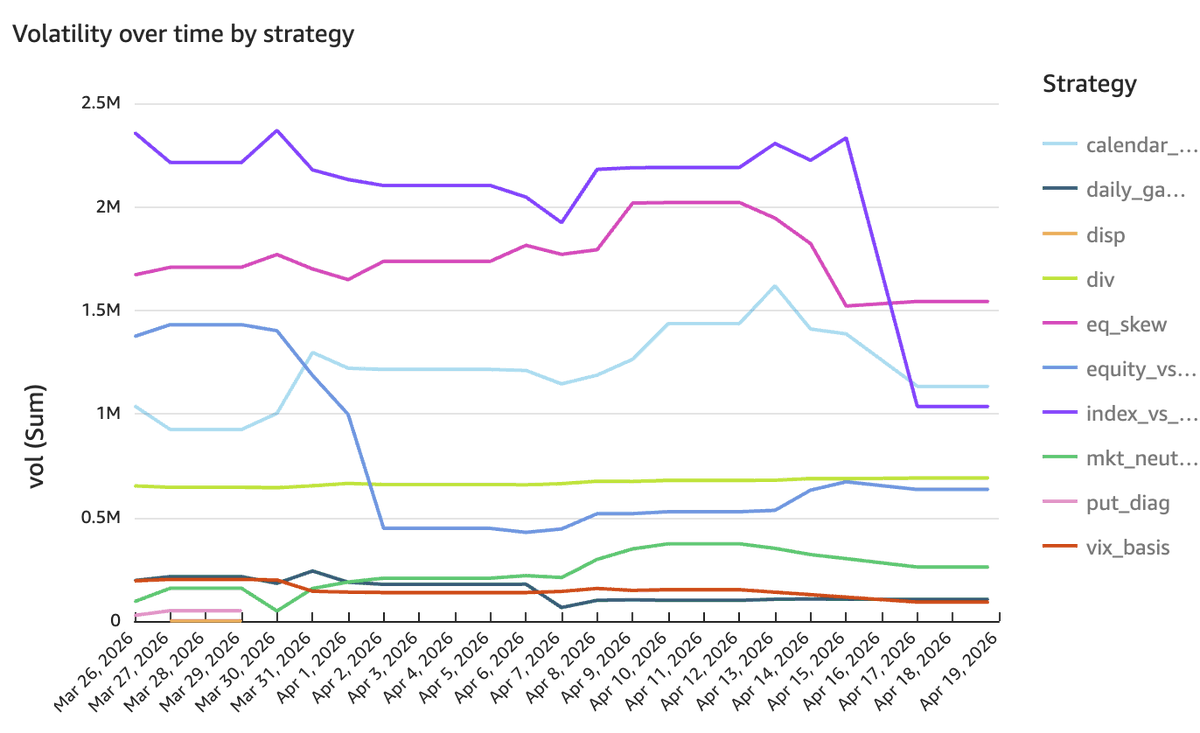
Breaking out slide risk by sub-strategy is helpful for understanding the complementarities between the positions in a portfolio

Basis risk stress tests are also essential - tests which break empirical relationships and just move things like skew, term structure, dividends, correlation, etc in relatively extreme ways.

Ranking stress tests by the losses the portfolio shows for each stress is helpful in identifying and validating the nature of major risk exposures. What would drive the largest losses in the portfolio? Does that make sense? Are those exposures attractive and desired?
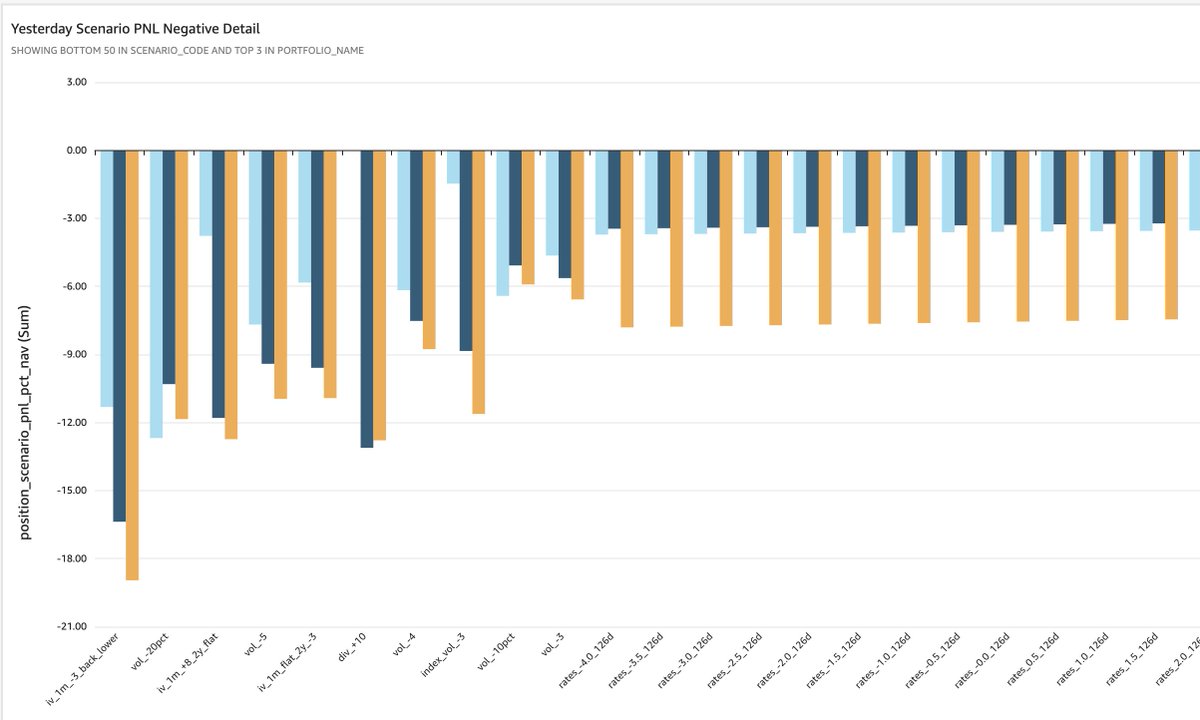
Typically a fund imposes limits on maximum stress test losses, and if a given stress test showed an excess of that, corrective action would be taken. In QVR multi-strat's case, we limit any stress test loss to 15% of NAV, and exceeding that would trigger cuts and/or hedging.
The opposite ranking is nice to look at as well -- where should the portfolio make money? How asymmetric are those gains that relative to the size of losses in negative scenarios?

Keep in mind that QVR multi-strat experienced a 28% drawdown in 2026, when it had made 117% on a risk-adjusted basis in 2020, or 78% outright :)
Stress tests are typically implemented as instantaneous or one-day shocks. This is unsatisfying, but it is because risk evolves dynamically in a derivatives book and the thought experiment of holding a portfolio static and letting a long time period pass is very artificial
Because positions are rolled and re-hedged constantly, etc - especially in a listed derivatives book. What that means is that the role of stress tests is in understanding how well protected the book is against sudden large shocks.
Value at risk (VaR) is another helpful tool, though caution should always be applied when interpreting it. VaR is inherently a historical exercise, while stress tests can be implemented which are worse or different than anything that has been experienced before.
A 99% 1-day historical VaR might, for example, consider all historical days over the last 1, 5, 10, 20 years, and simulate how the current portfolio would have performed in each of those days, and report the 99th percentile worst losses from those distributions
VaR should not be taken literally as a measure of likely extreme loss, as things can happen which did not happen in the historical window. However, a long-horizon VaR is a sensible and stable denominator for measuring risk allocation and changes in risk levels

Similar for a standard deviation estimate from the same distribution. This is important because traditional denominators (e.g., gross exposure) that work for long/short equity are not very helpful for derivatives where notionals are very misleading indicators of risk
(Just to explain that a little more -- consider one portfolio that is outright short a put, versus another one that is short a put spread -- the former is much riskier but the latter has twice the notional. Derivatives notionals are extremely game-able)
VaR also is only helpful as a short-horizon measure, for the same reason. You can carry out the thought experiment of VaR for a six month period, for example, but it is very artificial, because the risk of a derivatives portfolio changes dramatically, positions expire, etc
Stress tests can be pulled together to think about longer term and more multi-dimensional loss potential. e.g., what if the dispersion spread increased by 5 points and medium-term vol outperformed the front and back by 3 points and realized vol is 10 for a month and (...)
And ultimately the question about how much overall risk to run in the book is a question about risk/reward tolerance, the perceived (conservative) probability of many such losses all occurring together (note - not some kind of modeled or historically estimated probability!)
There is no model or empirical estimate that you can come up with to "correctly" estimate the probability of these things - each one is a draw from an unknown fat-tailed distribution and the co-movement is also unknown and fat-tailed
This is, of course, why many people in certain types of strategies like and apply mechanical drawdown limits. It is a no-brainer in highly liquid strategies that have momentum characteristics themselves, e.g. long/short equity and macro
Or a related tool, forced de-risking based on a short term VaR. It is much less common in derivatives strategies that have mean-reverting PNL streams. There are pod shops that apply such tools strictly and they tend to have negative performance over time in these strategies
Because PMs should be putting on risk when positions are most attractive and cutting risk when positions are least attractive. Those firms actually become sources of dislocations in the market when they liquidate positions indiscriminately
However, you can see the appeal of such tools in addressing the problem of unknown distributions of medium-term returns. I think the right answer lies in applying such tools, but in a way that incentivizes risk takers to ladder up risk at an appropriately slow pace --
As a PM, I'd say I had too much risk in the portfolio at baseline, when we rated the opportunity set at say a 6/10, so that even as we added gradually as dislocations widened and the opportunity set got better, we were too exposed too early, that was critical
And calibrating better that relationship between risk tolerance and the attractiveness of the opportunity set given the potential for extended dislocations across many areas given the overall risk tolerance a product is supposed to have is a key point of reflection
• • •
Missing some Tweet in this thread? You can try to
force a refresh


