
(1/12) Announcing R CHARTS, the new #rstats and #rstatsES #dataviz site which includes, per language:
📈 Over 1100 #ggplot2 and base R charts
🧑🏫 Over 120 tutorials
📊 Over 50 different chart types
🎨 Several color & palette tools
r-charts.com
Made with #blogdown 🤩
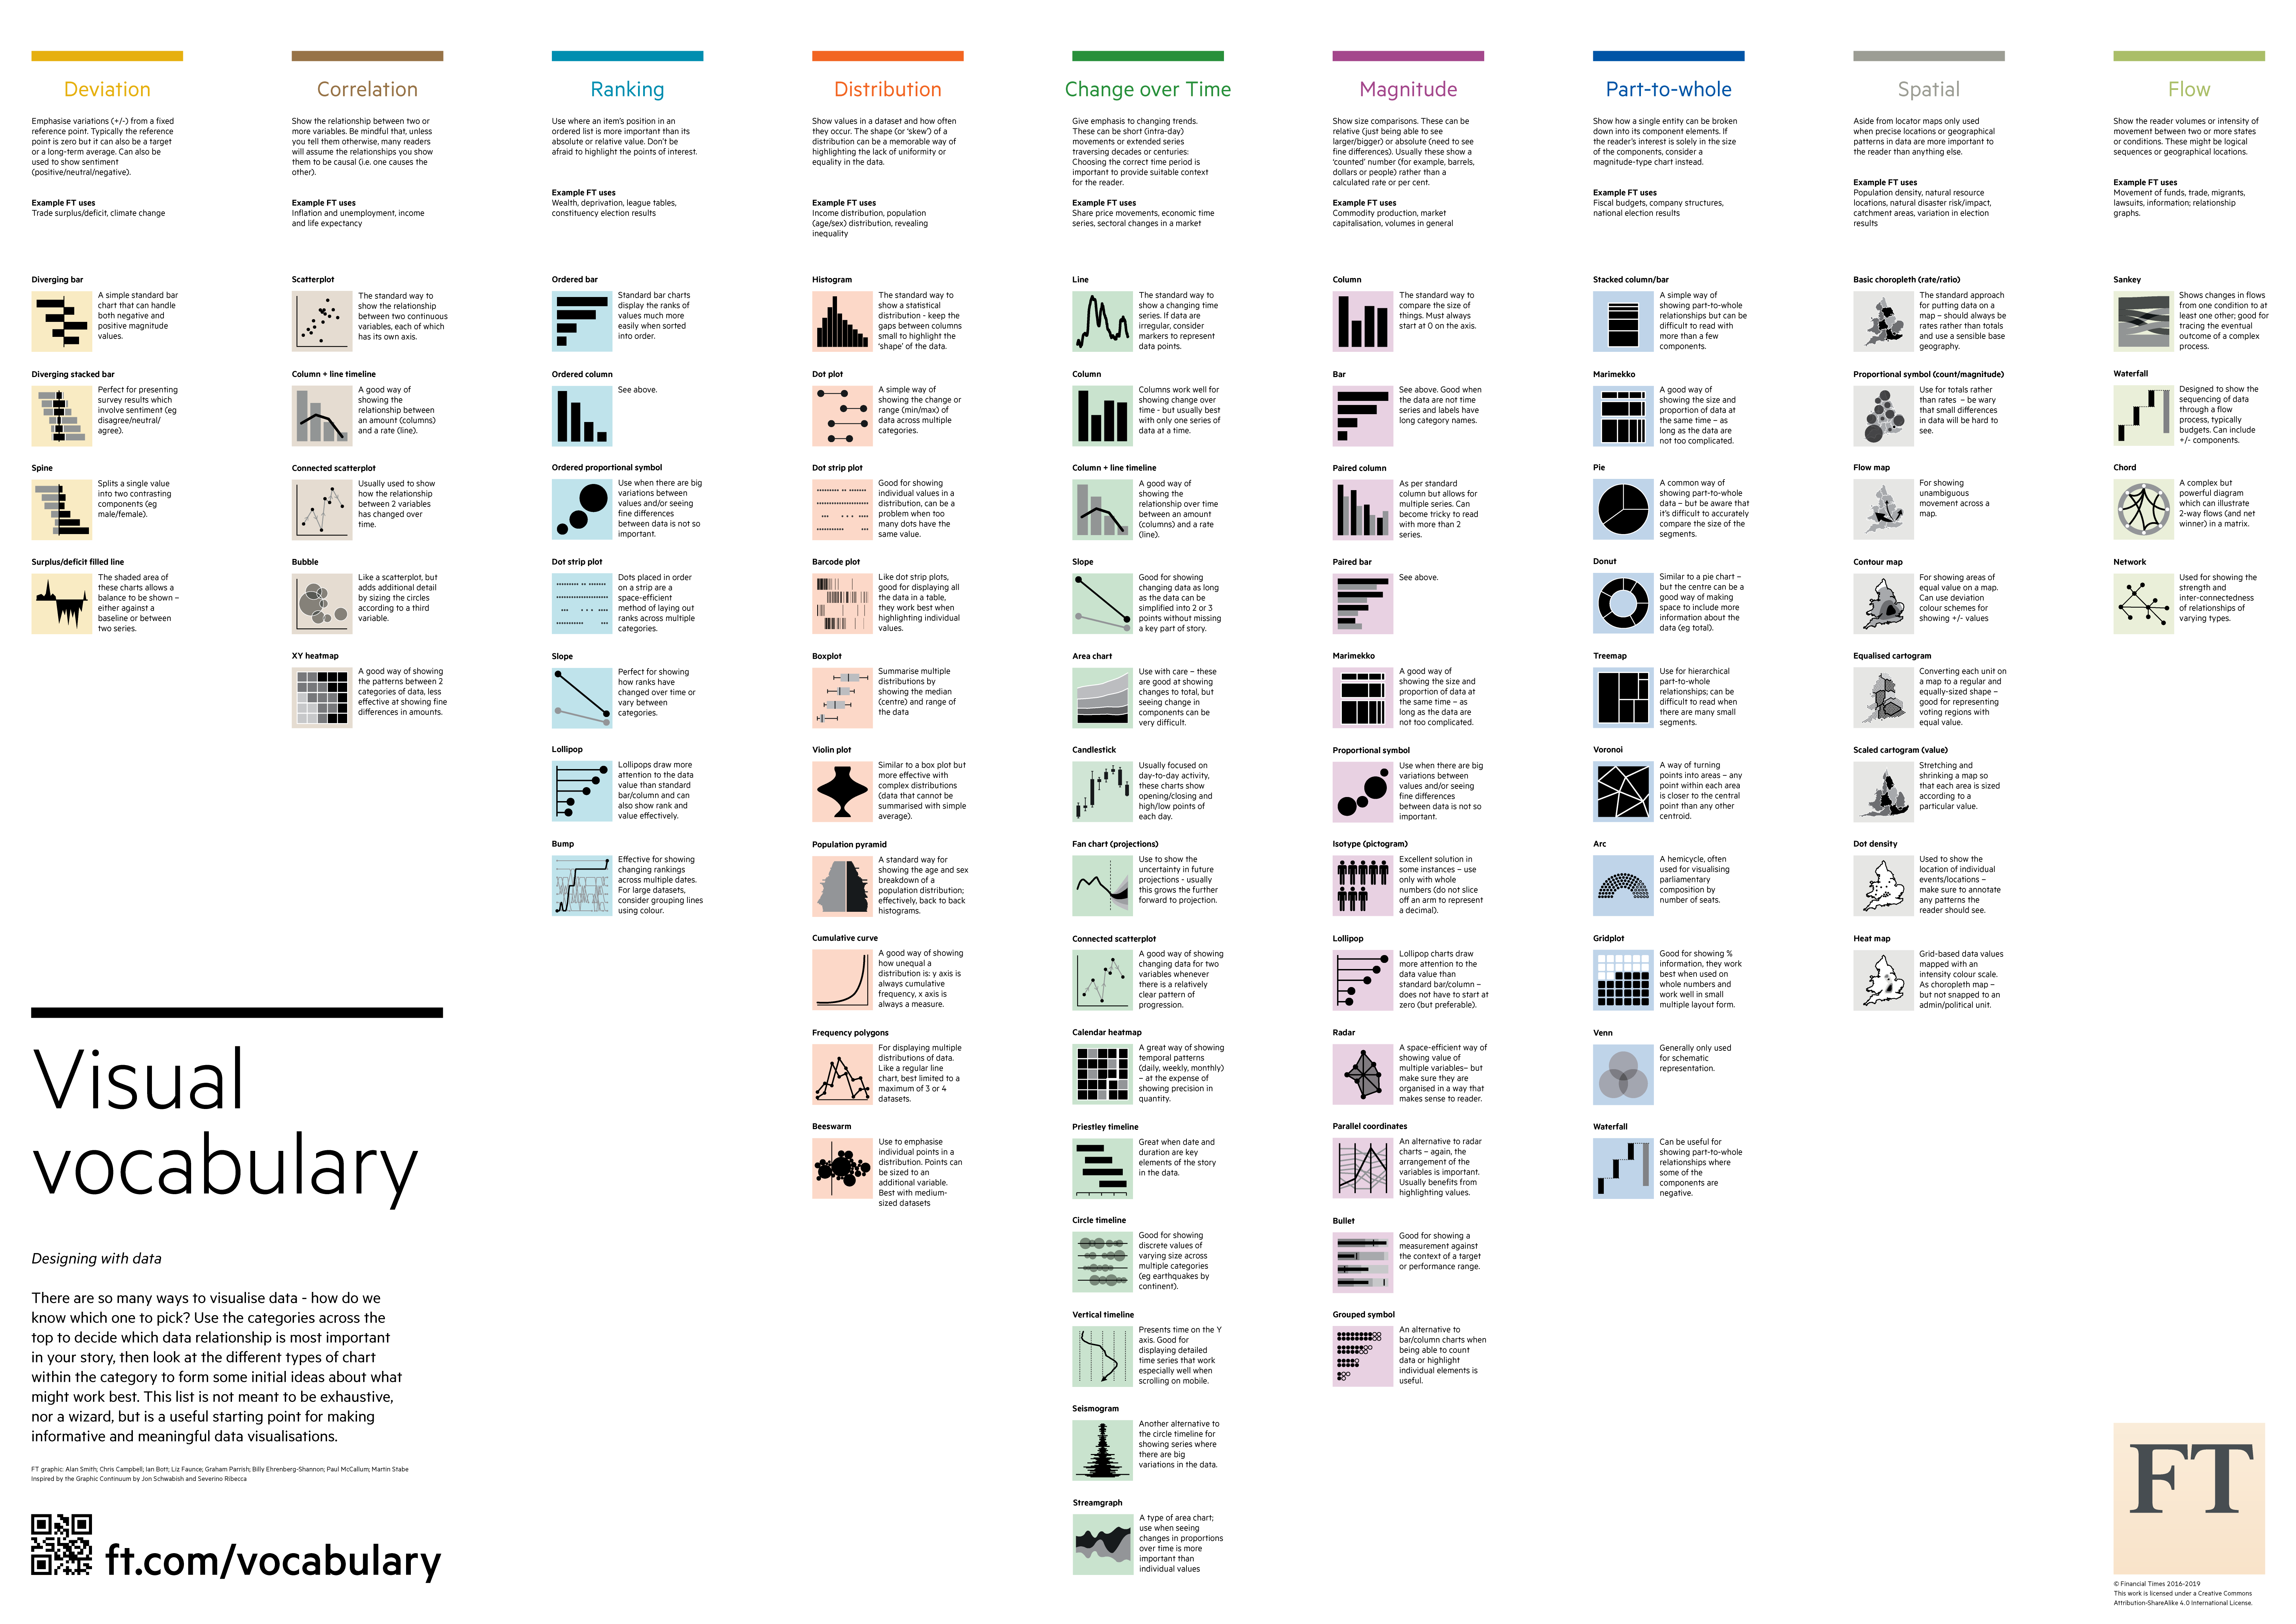
(2/12) The site contains 8 different categories (the Spatial section is under construction) based on the Financial Times Visual Vocabulary:
raw.githubusercontent.com/ft-interactive…
(3/12) Once you pick a category you will see all the available #rstats charts for that category.
You can filter them by their chart type and base R or #ggplot2.
r-charts.com/correlation/
(4/12) Each tutorial provides an easy-to-follow comprehensive guide with lots of examples of the process of creating and customizing each graph.
It is possible to copy each chunk pressing the copy button on the top-right corner.
(5/12) There are also two pages that contain all the tutorials both for base R or ggplot2 graphics:
r-charts.com/ggplot2/
r-charts.com/base-r/
(6/12) There is also a page that contains all the colors from the colors() function. 👨🎨
You can copy its name, its HEX reference or convert them to RGB with the color converter.
The page also provides a color picker to preview the colors.
r-charts.com/colors/
(7/12) The color palettes page contains almost 500 different discrete, continuous and dynamic palettes from 16 different #rstats packages.
You can copy each color individually or use the whole palette with the corresponding package or with {paletteer}.
r-charts.com/color-palettes/
(8/12) There is an additional color tool: a color palette generator (single-hue and diverging tabs are under construction). 🎨🎨
Pick the colors, create your own color palettes and copy them as R vectors.
r-charts.com/color-palette-…
(9/12) The website provides a live search feature built with Fuse.js. This was definitely the hardest thing to achieve. 🔎🔎
You can open it pressing Shift or pressing the corresponding button (🔍) of the header.
(10/12) Both the content and the HUGO theme of the site were developed by a single person. 😎
It took me about 7 months creating this web, working full time, even weekends and holidays. 😳
If you want to know more about me check the about page:
r-charts.com/about/
(11/12) All you can see was developed without any financial support. If you want to support me you can do it via this site:
buymeacoffee.com/RCODER
If you, your company or institution want to place ads on my sites please get in touch with me via email.
(12/12) Enjoy the site, share it with your colleagues and please try not to overload my server!
🥳🥳🥳
Share this Scrolly Tale with your friends.
A Scrolly Tale is a new way to read Twitter threads with a more visually immersive experience.
Discover more beautiful Scrolly Tales like this.