
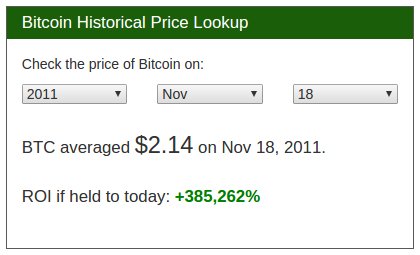
1/ We've added bitcoin price data going back to July 2010: onchainfx.com/asset/bitcoin. Check it out on the chart, and in the price lookup tool. And now for some historical 'bubble' charts... 
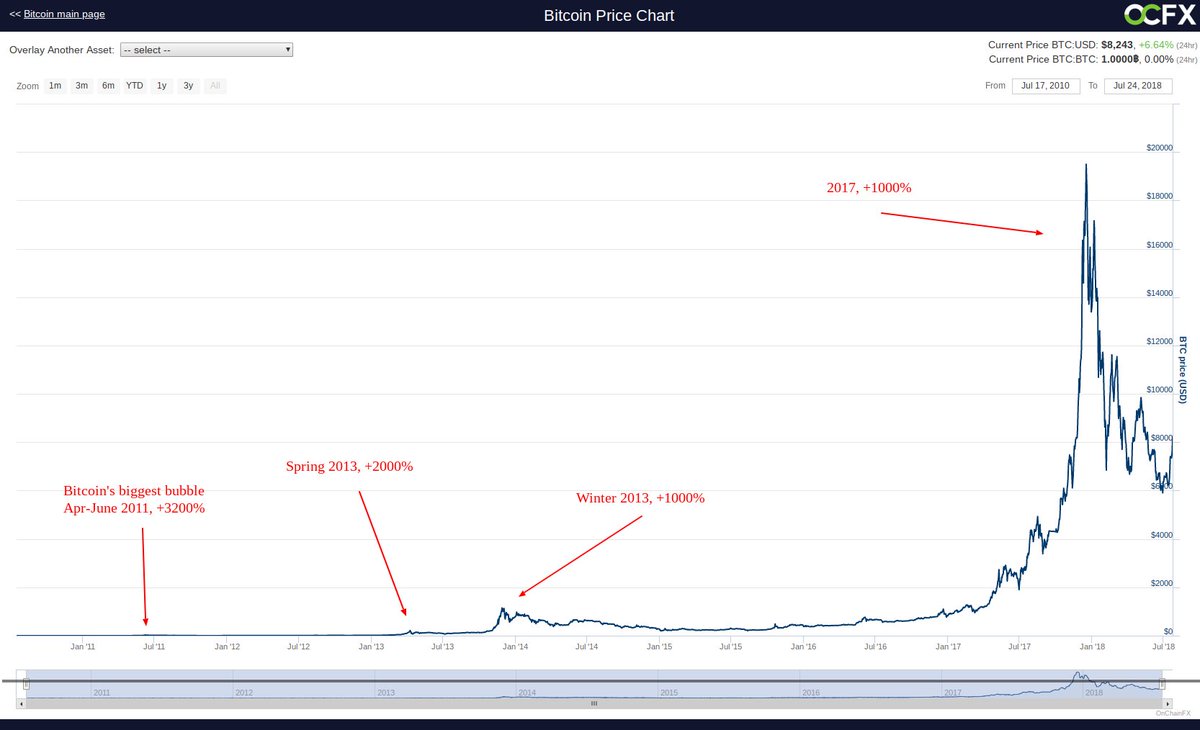
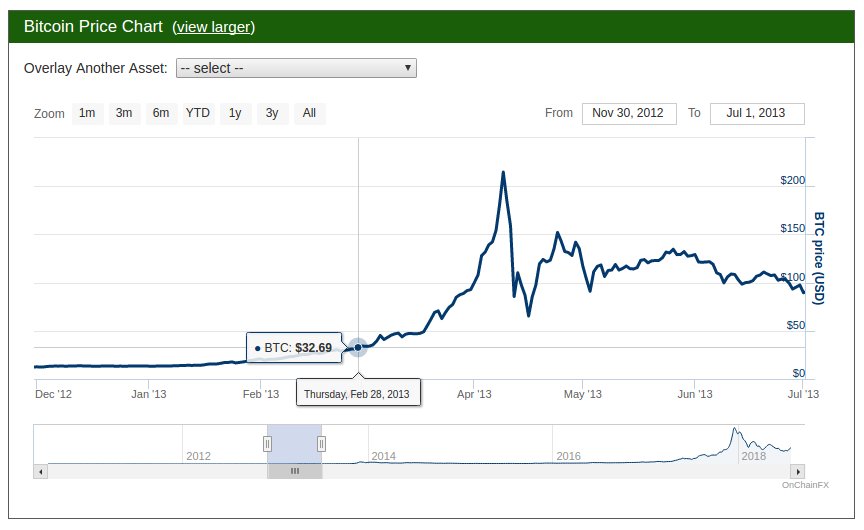
2a/ This is bitcoin's biggest-ever bubble. $1 to $32 from April-June 2011. That's +3200% in 2 months. -94% from peak 5 months later.
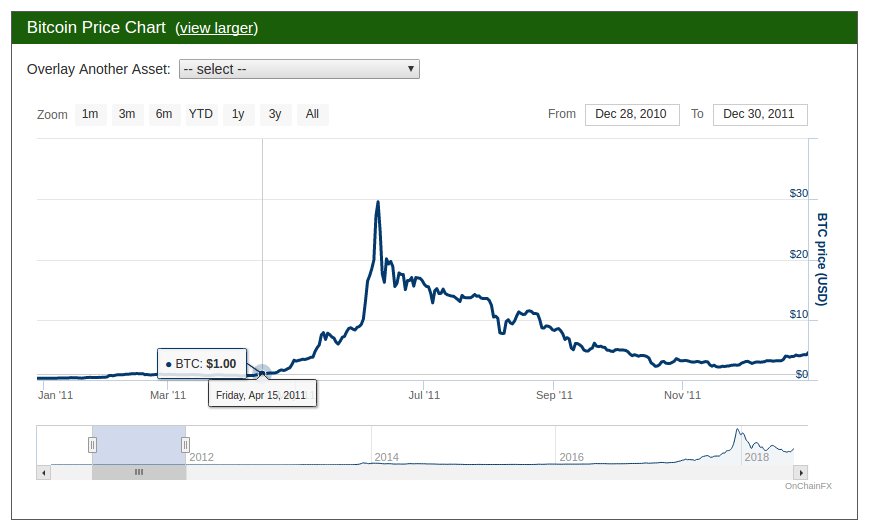
2b/ Who remembers watching the MtGox price crash to a penny a few days after the high, due to the first big MtGox hack (1m BTC dumped, price to $0.01)? Check out recent @BitMEXResearch piece: blog.bitmex.com/the-june-2011-…
3a/ Here's the Spring 2013 ramp (notice "massive" 2011 bubble on the left). This one ran from $13 to an intraday high of $266 four months later for +2000%. -81% immediately after.
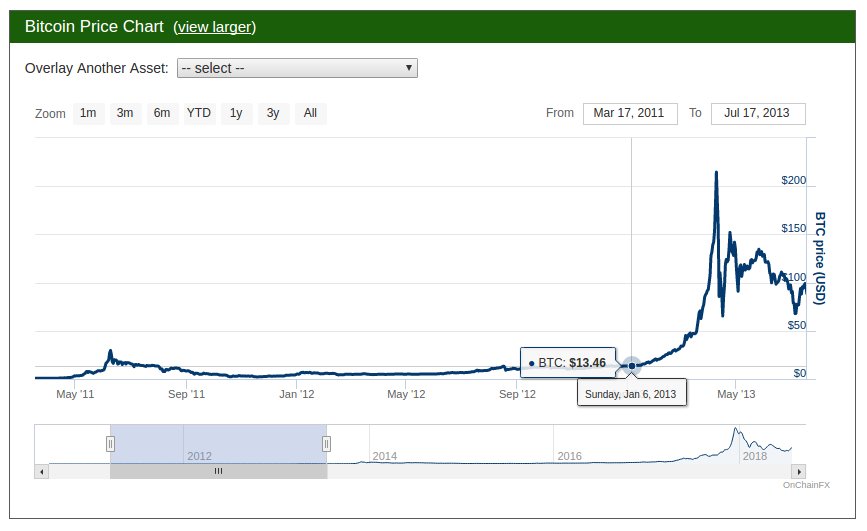
3b/ Breaking the 2011 high of $32 in late Feb setup the ramp to Apr-9 intraday $266 peak. Then Gox shutdown for a "cool down" period. Day's range on reopen was $50 - $150. This was the 2nd "Goxxing".
4a/ And here's the winter 2013 bubble (dwarfing spring 2013's +2000%). This was roughly $115 to $1163 in 3 months, peaking in late Nov 2013. -87% 1+yr later.
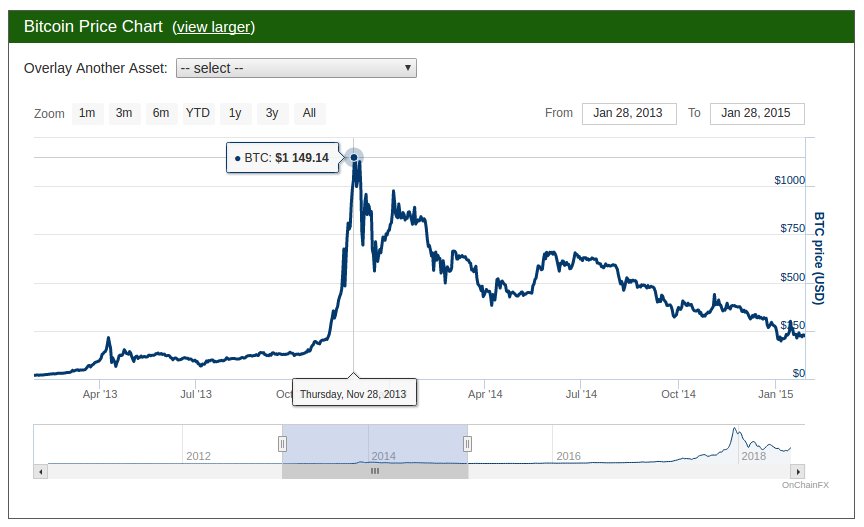
4b/ And of course, the 3rd "Goxxing", when MtGox declared bankruptcy on Feb 28th 2014. The bubble peaked 2mo prior, but Gox bankruptcy arguably destroyed sentiment for 2yrs.

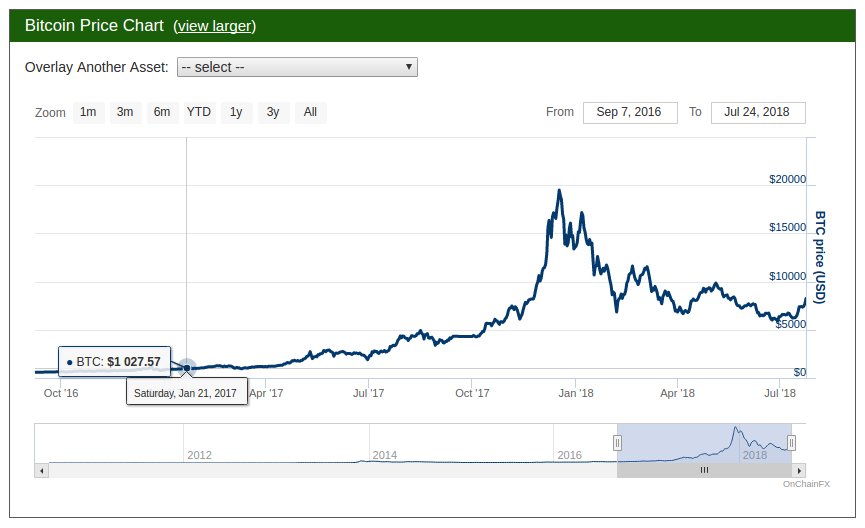
5a/ Finally, here's the 2017 bubble. On the left, notice the peak of bitcoin's incredible 2013 full-year 100x run. Hard to see now :)
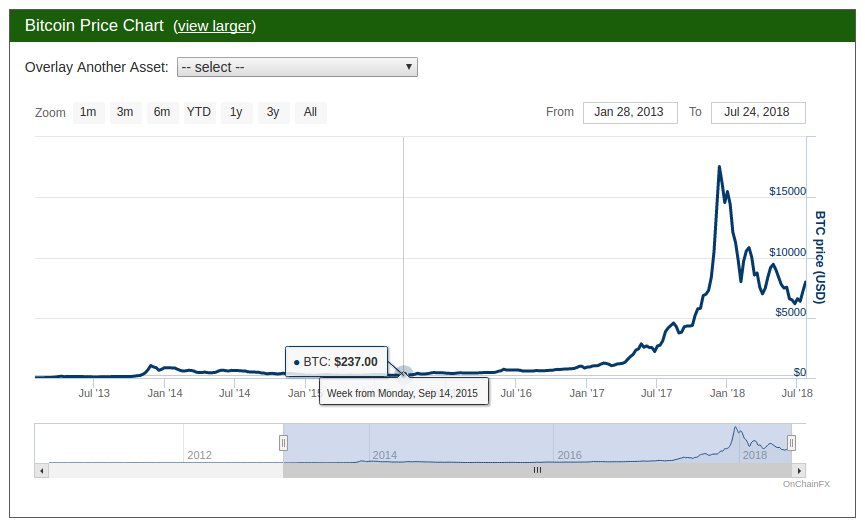
5b / The 2017 run was by far the longest duration, from a base around $1000 to a peak of ~$20k about a year later for +2000%. Subsequent low so far was -71%.
6/ So that's four bubbles of 1000% or more in the past 7 years. Remind us to revisit this thread in another 7 years :)
• • •
Missing some Tweet in this thread? You can try to
force a refresh


