1,
Every trader has a unique look into the market, I personally really enjoy looking deep into the mechanics of a financial product (Bitmex's XBTUSD contract in this case).
Every trader has a unique look into the market, I personally really enjoy looking deep into the mechanics of a financial product (Bitmex's XBTUSD contract in this case).
2,
In my mind, LT trading is all about finding those individuals who are using much larger amounts of leverage than they should and squeezing/stopping them out/liquidating them.
In my mind, LT trading is all about finding those individuals who are using much larger amounts of leverage than they should and squeezing/stopping them out/liquidating them.
3,
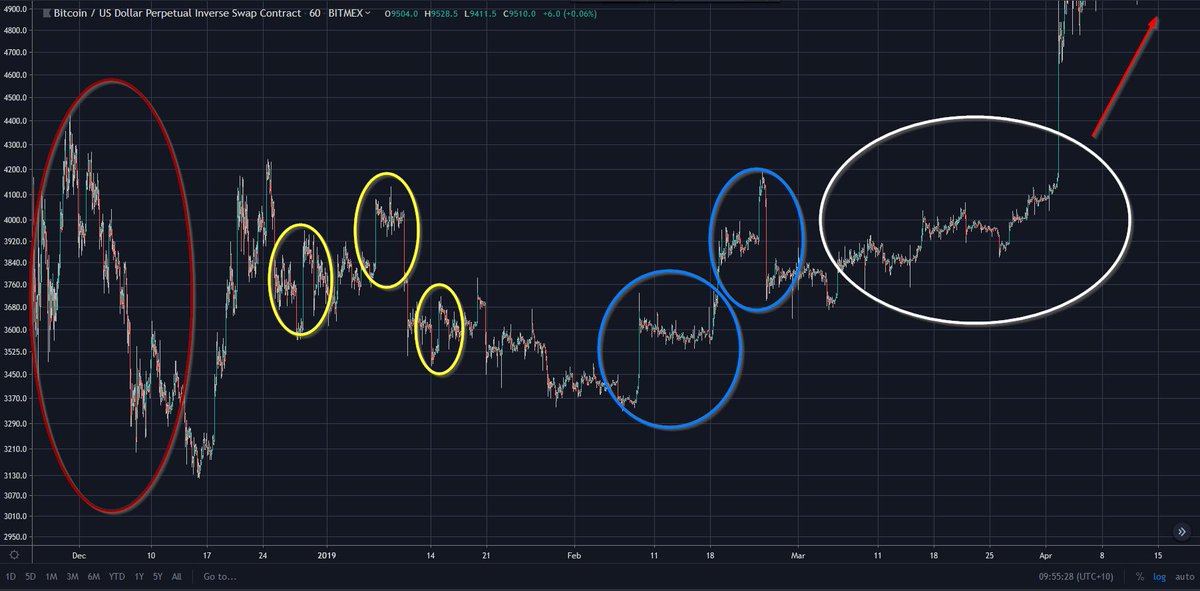
This trading strategy came to mind when Bitmex research posted their article on leverage statistics blog.bitmex.com/bitmex-leverag…. Between October 2018 and February 2019 there was a significantly larger amount of longs using leverage and from March the trend reversed.
This trading strategy came to mind when Bitmex research posted their article on leverage statistics blog.bitmex.com/bitmex-leverag…. Between October 2018 and February 2019 there was a significantly larger amount of longs using leverage and from March the trend reversed.

4,
When one side is using much higher leverage than the other, the tipping point of the market is much closer to you, and can easily cascade from one liquidation to the next. We see that markets punish the individuals who are more leveraged, generally.
When one side is using much higher leverage than the other, the tipping point of the market is much closer to you, and can easily cascade from one liquidation to the next. We see that markets punish the individuals who are more leveraged, generally.

5,
It's all well and good looking at past data and using hindsight as a way to show your point but how do you use that knowledge and predict market movement? How do you find which side is more leveraged than the other?
It's all well and good looking at past data and using hindsight as a way to show your point but how do you use that knowledge and predict market movement? How do you find which side is more leveraged than the other?
6,
Each liquidation run has its own characteristics and events leading upto it so take this with a grain of salt and think of this as a good market overview and not the holy bible.
Each liquidation run has its own characteristics and events leading upto it so take this with a grain of salt and think of this as a good market overview and not the holy bible.
7,
If you were to compare two separate stop runs /"breakouts" (1 upmove, 1 downmove) that are similar in % movement and then compare the amount liquidated on each move you will have somewhat of an accurate picture of which side is more leveraged than the other.
If you were to compare two separate stop runs /"breakouts" (1 upmove, 1 downmove) that are similar in % movement and then compare the amount liquidated on each move you will have somewhat of an accurate picture of which side is more leveraged than the other.
8,
As an example; lets say you were to compare 2 BTC moves that ran 5% each. If you were to have $40MillionUSD liquidations on the upmove, and $82MillionUSD on the down move, you'd assume the longs are much more leveraged than shorts.
As an example; lets say you were to compare 2 BTC moves that ran 5% each. If you were to have $40MillionUSD liquidations on the upmove, and $82MillionUSD on the down move, you'd assume the longs are much more leveraged than shorts.
9,
I'd use this technique if I had a bias in the market and each move were close to each other in time. This is just one of the many factors that may help to contribute to a longer term outlook on the market.
I'd use this technique if I had a bias in the market and each move were close to each other in time. This is just one of the many factors that may help to contribute to a longer term outlook on the market.