1) I've run this hedging strategy on most global indices now and its been very effective in reducing drawdowns.
Here are the rules -
When price closes < 150d ema AND 5d ema < 7 day ema --> hedge. When 5day ema closes > 7 day ema, you cover. When price > 150d ema, no hedging.
2) This hedging strategy has protected capital from EVERY major stock market decline for almost 100 years and it should continue to do the same in the future.
This hedging strategy reduces returns during strong bull-markets, but makes a lot of money during strong bear-markets..
3) Depending on the index, even though the upside is reduced by 2-3% per year during powerful bull-markets, by hedging, one is able to stay fully invested in his/her stocks and yet avoid nasty drawdowns. So, this may be more suitable for growth stock investors who target...
4) high returns but want to smooth out the wild volatility. The benefit is peace of mind, good sleep and the ability to hold onto equity positions for the long-term.
Here are the charts of $SPX going back to the 1920s...
5) With this strategy, you stay fully invested (without hedges) when price is above the red shaded area and you start hedging/trading 5day ema/7day ema cross when it falls below the 150day ema (red shaded area).
$SPX (1 Jan 1929-1 Jan 1940)
$SPX (1 Jan 1940 - 1 Jan 1950)
$SPX (1 Jan 1950 - 1 Jan 1960)
$SPX (1 Jan 1960 - 1 Jan 1970)
$SPX (1 Jan 1970 - 1 Jan 1980)
$SPX (1 Jan 1980 - 1 Jan 1990)
$SPX (1 Jan 1990 - 1 Jan 2000)
$SPX (1 Jan 2000 - 1 Jan 2010)
$SPX (1 Jan 2010 - now)
Finally, I've done this study and backtests using these particular exponential moving averages; but one can play around and tweak the longer-term and two shorter-term emas; to better suit their temperament.
Hope this has been useful.
How do I hedge?
a. For China exposure, I short $KWEB (same $ amount as my China stocks) - I trade a short term ema cross (sell when shorter-term ema goes below the longer-term ema and cover on reverse)
b. For non-China exposure, I short #NQ_F (beta hedging; so 1.2X my longs)
• • •
Missing some Tweet in this thread? You can try to
force a refresh
1/ - 🧵- Cutting out the "noise": Systematic hedging strategy
Nobody can consistently predict what the stock market will do but trend following allows one to exploit the trends in the markets.
Buy & hold works over long periods of time but this approach comes with...
2/ ...anxiety, gut-wrenching volatility, large drawdowns and secular bear-markets which can last for 10-14 years.
Fortunately, one can reduce the drawdowns and volatility of a long-term investment portfolio by utilising trend following which does not require any forecasts...
3/ ...or the use of predictive fundamental or technical indicators.
By adopting a systematic trend following hedging strategy (zero discretion), one can totally remove emotions from the investment business and significantly reduce drawdowns and volatility.
Lately, numerous trolls are incorrectly claiming I've been wrong about everything all year long, so this thread will set the record straight.
Yes, it is true that I've been discussing the prospects of a recession since late 2022...
2/9) ... and my expectation was that a downturn would start in 2023 and in this department, I have been proven wrong.
However, up until recently, I haven't traded off my macro views and have only recently liquidated my growth stock portfolio and started protecting my...
3/9)...capital from the elevated risk of a hard landing. Even now, I'm tactically trading index futures on both the long and short side (as stated in my Pinned Tweet).
In April, I posted the below which turned out to be correct....
The post-COVID bull market was the first cycle when stocks peaked several months *before* the end of QE.
Between '09 and '20, stocks peaked after the end of QE, but in '21 the speculative stuff peaked in Feb, junior growth stocks peaked in Aug/Sep, tech peaked in Nov...
...and $SPX peaked in Jan '22 whereas QE ended in Mar '22!
Interesting to note that the growth stocks ETF $IWO bottomed in Jun '22 (four months before lows in $NDX and $SPX) and many growth names bottomed between May and July.
At the end of the last bull-market in '21...
...the stock market clearly discounted the Fed's tightening several months before the event (end of QE in Mar '22) which is why stocks peaked whilst QE was ongoing (a first)!
Given the price action in $IWO and many growth stocks plus strength in $NDX and $SPX...
Up until 11 March, the Fed was reducing the size of its balance-sheet and draining excess "liquidity" from the system. On 12 March, it suddenly decided to inject new "liquidity" into the banking system...an abrupt U-Turn.
Over the following two weeks, Fed's balance-sheet...
...expanded by ~$400 billion and this undid 8-months of liquidity drainage via QT!!!
Since the Fed's intervention, the financial markets have rallied sharply...bitcoin, silver, gold, tech stocks - the usual suspects have all benefited from the Fed's balance-sheet expansion...
So, whether one calls this "QE" or "NOT QE", this dollar creation is impacting the financial markets (similar to the "NOT QE" reverse repo operations in 2019)!
I'm aware that technically this isn't QE as the Fed is not buying assets, it is lending against banks' assets...
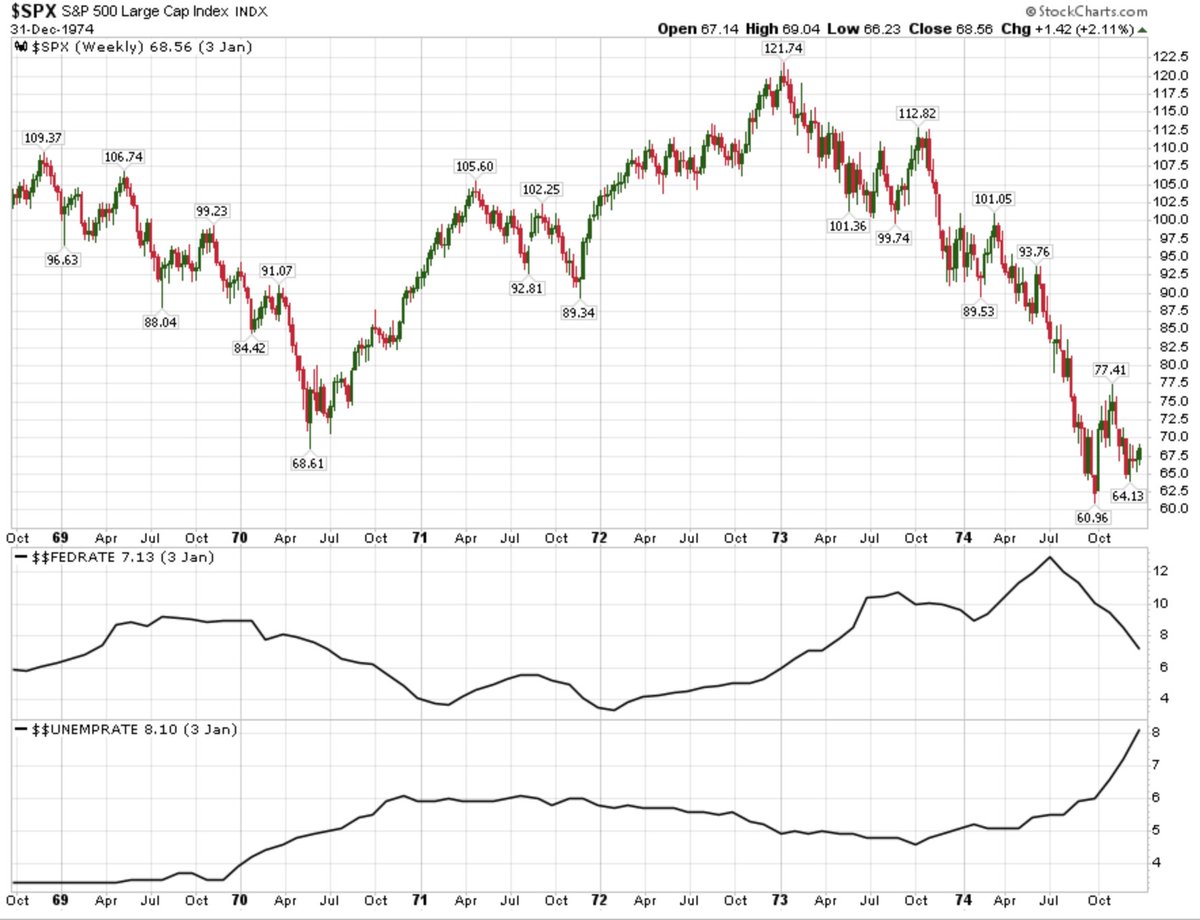
Many are convinced $SPX bottomed last October and we are now in a new bull-market. If this is a labour cycle and unemployment rate is set to rise, then history shows the bear-market low lies ahead...
1/ $SPX during 1969 and 1973/74 cycles -
2/ $SPX during 1980 and 1981/82 cycles -
$SPX declined when unemployment rate rose and only bottomed after rate cut(s) by the Fed (just before the peak in the unemployment rate)
3/ $SPX during 1990 cycle -
$SPX declined when unemployment rate rose and only bottomed after rate cut(s) by the Fed
Over the past 2 weeks, the Fed has created $400b out of thin air and injected this new liquidity into the banking system...via loans.
These newly created dollars are neutralising the natural deflationary forces (preventing liquidation)...
2/...within the banking system and economy, therefore these operations are inflationary.
Granted, this new liquidity has not seeped into real spending yet (via loan creation by banks) but its affects are already showing up in the financial markets!...
3/ Since the Fed started expanding its balance-sheet (creating new dollars to lend to the banks), amidst the escalating banking crisis, asset prices have gone up (see below chart from @ycharts)!
This rally in asset prices is clearly due to the Fed's expanding balance-sheet...